


Robots, Resumes, and Regional Woes
AI is rewriting the rules of work, but not every state will feel the shake-up the same way. Some economies are better built to roll with the punches, while others are stacked with jobs that could disappear faster than you can say “chatbot.” To figure out who’s most exposed, we leaned on four key signals:
Jobs at automation/AI risk: This shows how much of each state’s workforce is made up of roles that AI tools are most likely to replace or shrink.
Manufacturing share of jobs: Factories are ground zero for automation, and now AI is turbocharging those machines, which means states with more manufacturing jobs are more exposed.
Bachelor’s+ adults: Education gives workers more wiggle room. States with fewer college grads have fewer people positioned to shift into the higher-skill roles AI is creating.
AI job demand/readiness: This is about opportunity. States already seeing strong AI hiring can absorb some of the shock, while places with little tech demand could be left behind.
With that in mind, here’s our countdown of the 25 states most likely to feel AI’s growing pains. The top 5 might surprise you.
 25: Montana
Jobs at automation/AI risk: Above-average (tourism/service heavy)
Manufacturing share of jobs: Low (~4%)
Bachelor’s+ adults: 34.8%
AI job demand/readiness: Modest outside Billings/Bozeman
Tourism, extraction, and service roles dominate, leaving rural markets vulnerable.
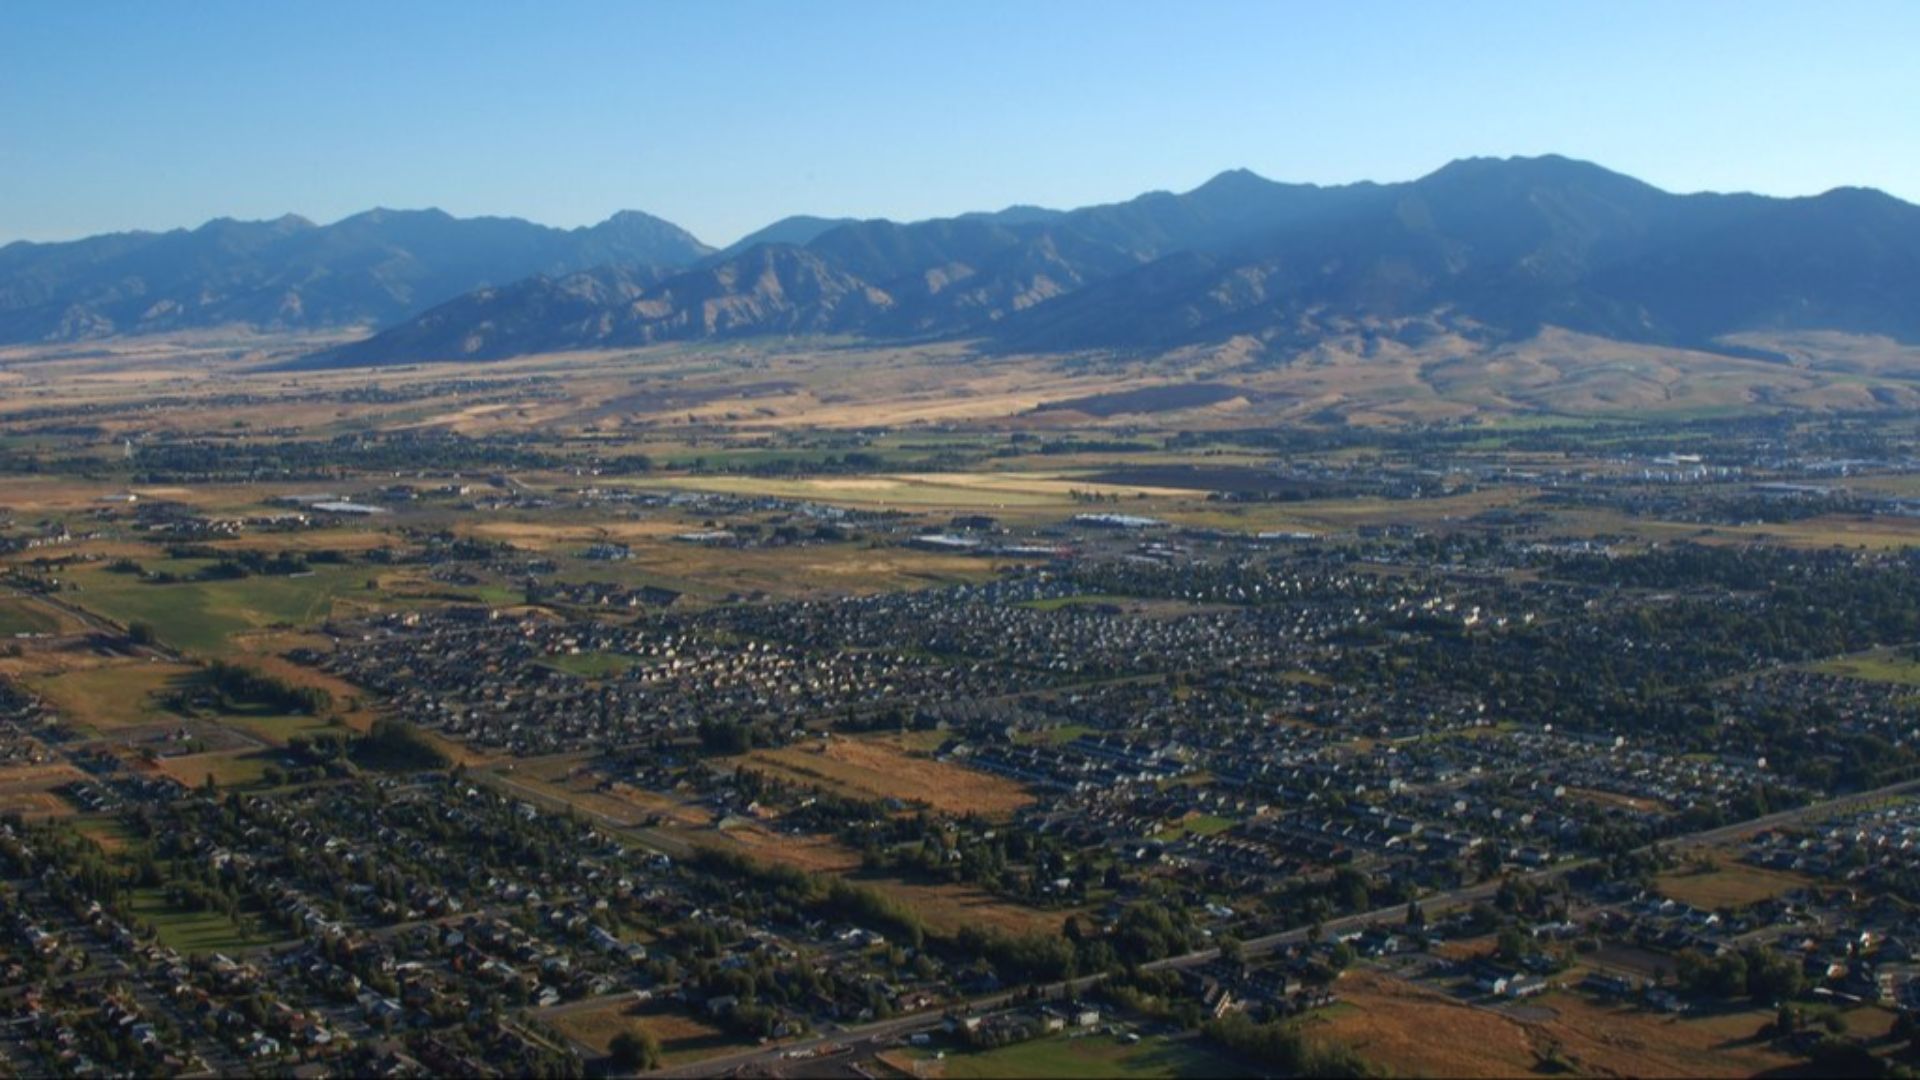 Feetyouwear, Wikimedia Commons
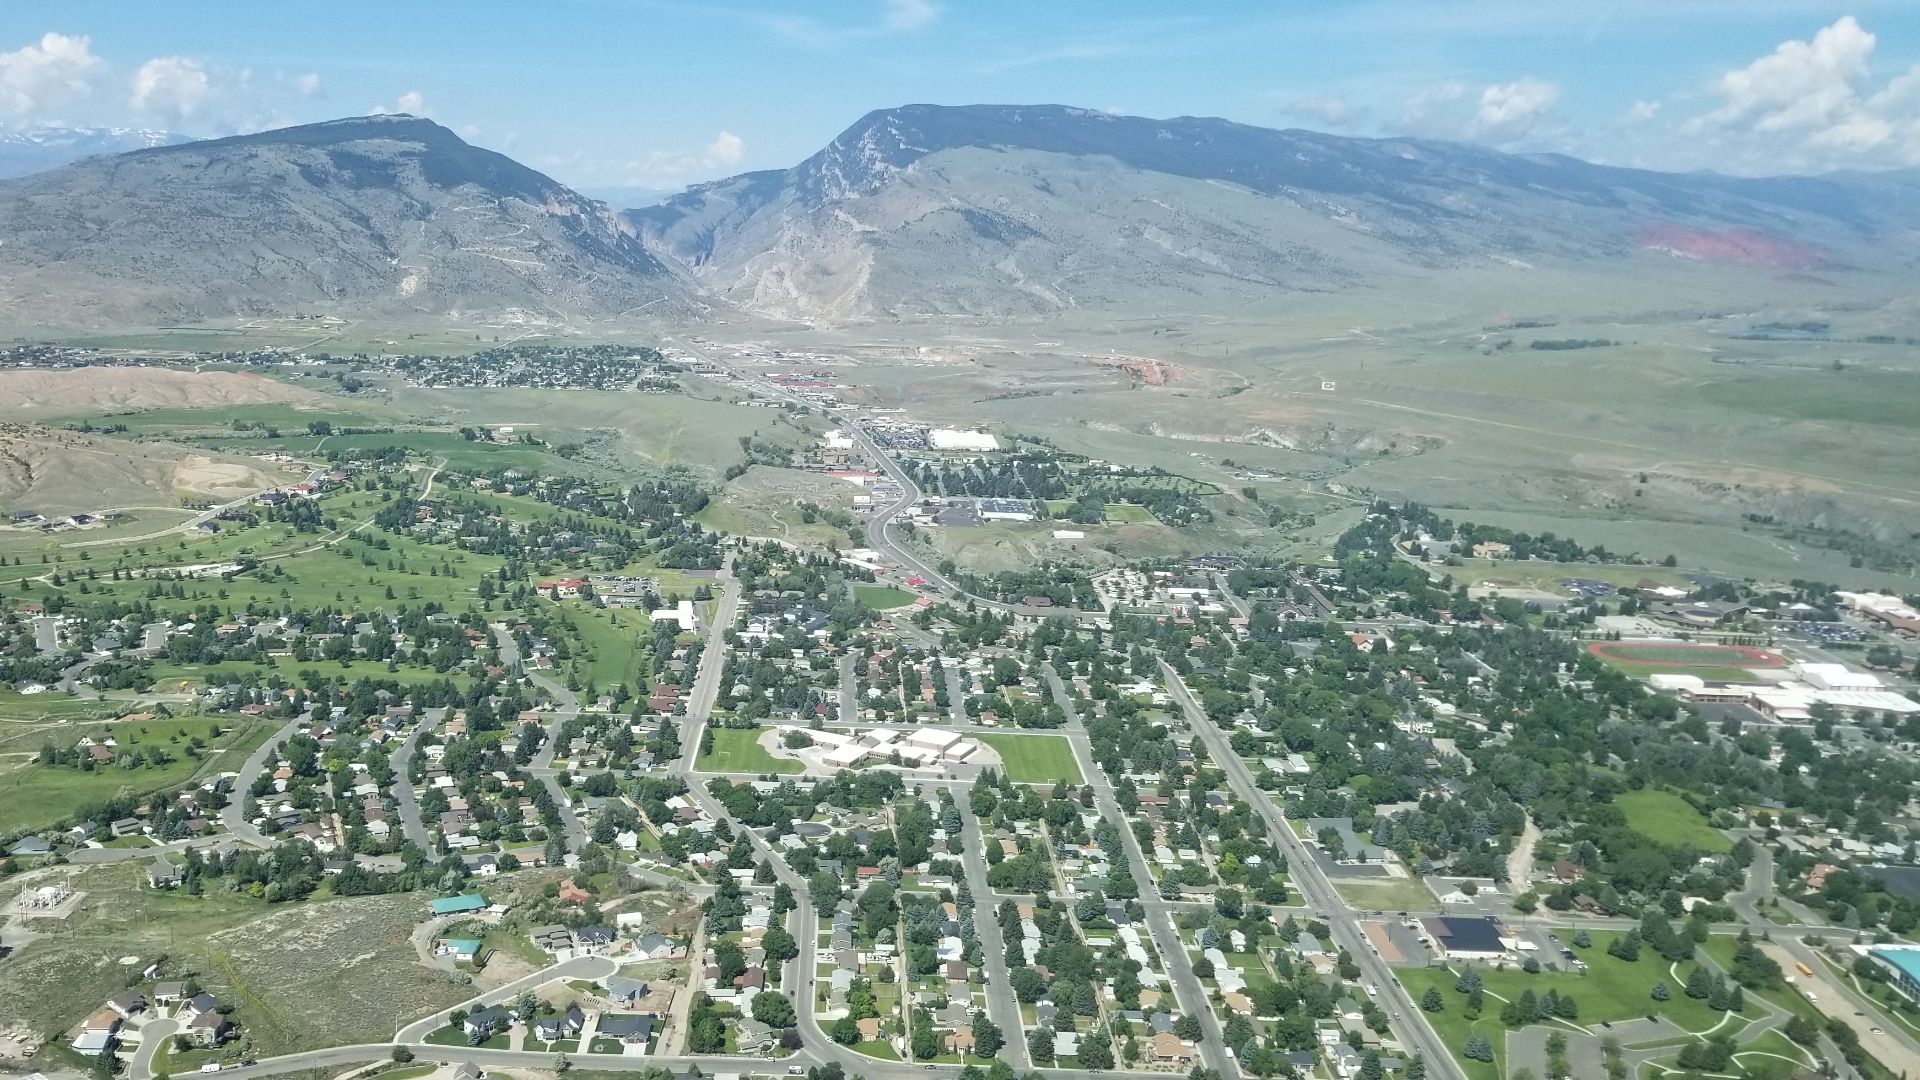
24: Wyoming
Jobs at automation/AI risk: 56.4% (top five nationally)
Manufacturing share of jobs: Very low (~3%)
Bachelor’s+ adults: 28.6%
AI job demand/readiness: Sparse beyond energy hubs
Energy extraction cushions some jobs, but weak tech presence limits options.
23: Idaho
Jobs at automation/AI risk: Above-average (warehouse/logistics heavy)
Manufacturing share of jobs: ~6%
Bachelor’s+ adults: 30.5%
AI job demand/readiness: Growing in Boise; weak elsewhere
Logistics and back-office roles are exposed, especially outside Boise’s tech scene.
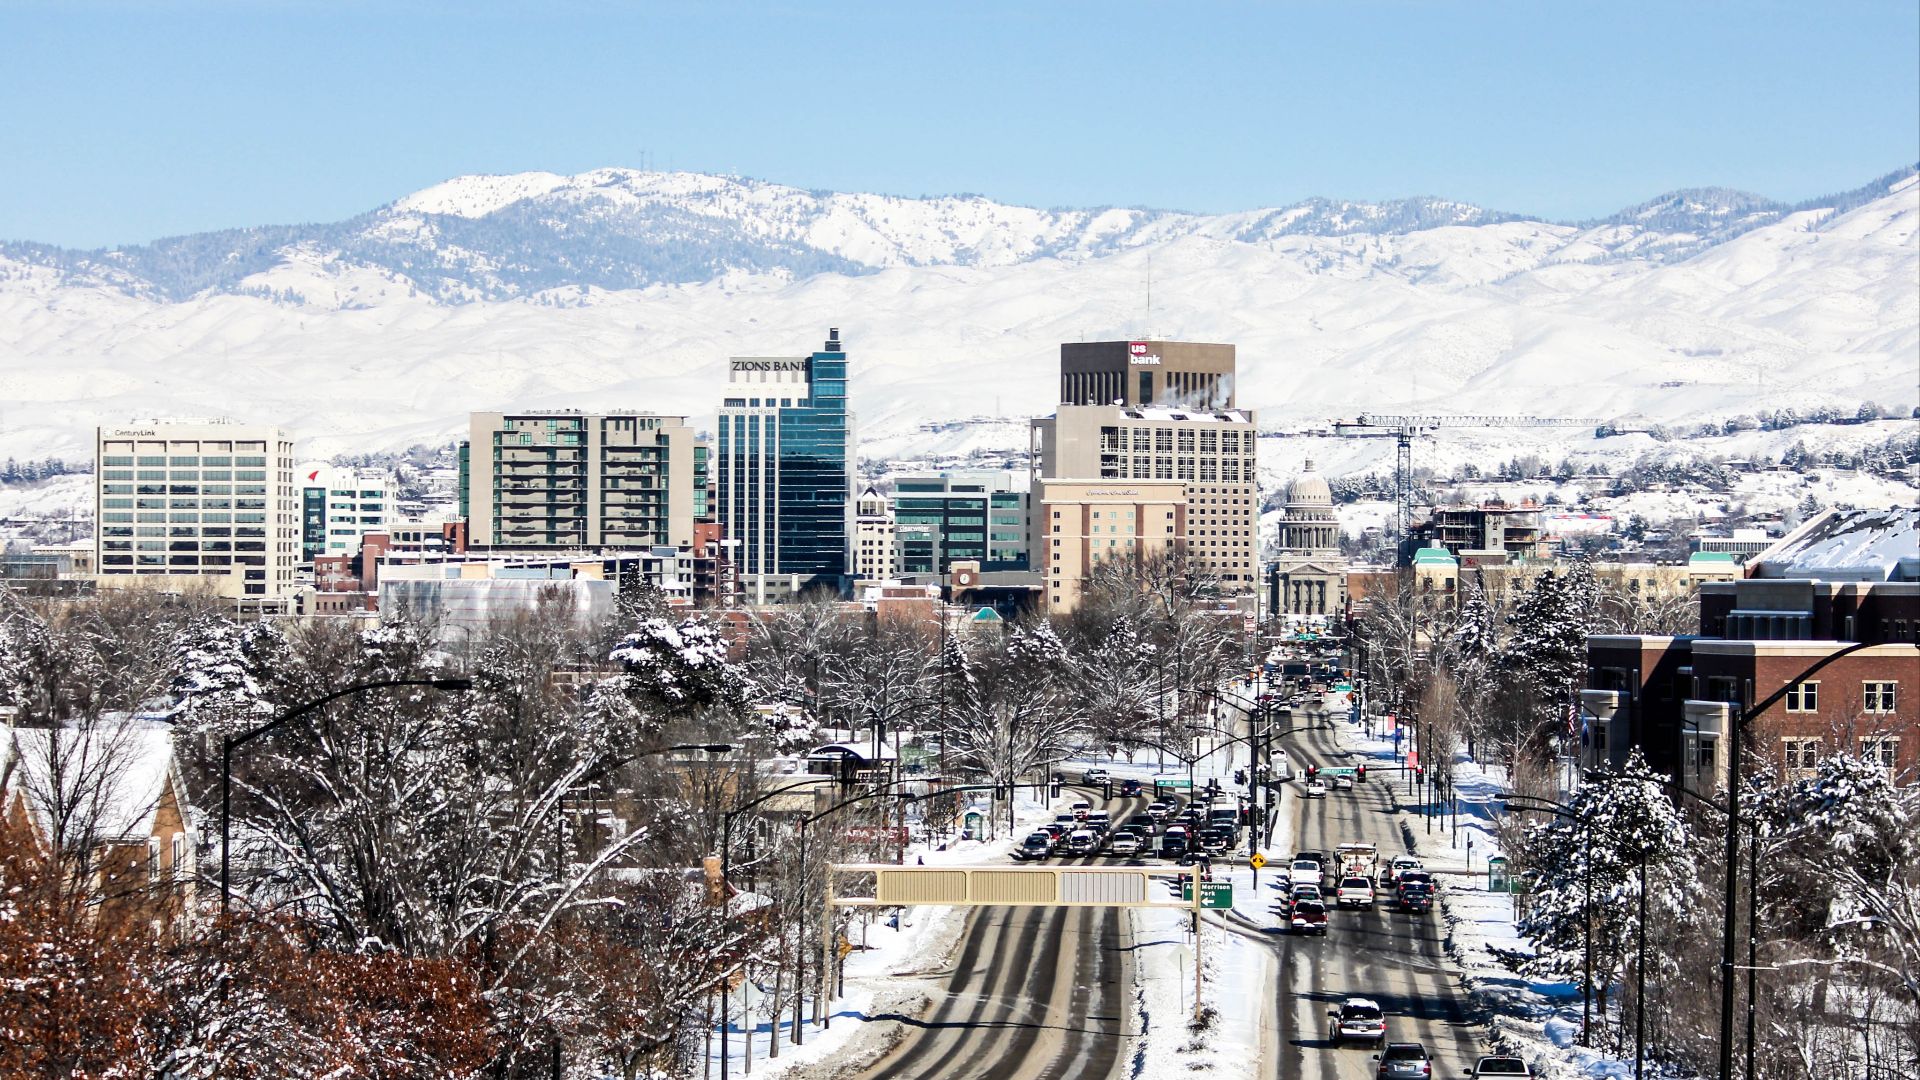 Erin Cave, Boise Chamber of Commerce, Wikimedia Commons
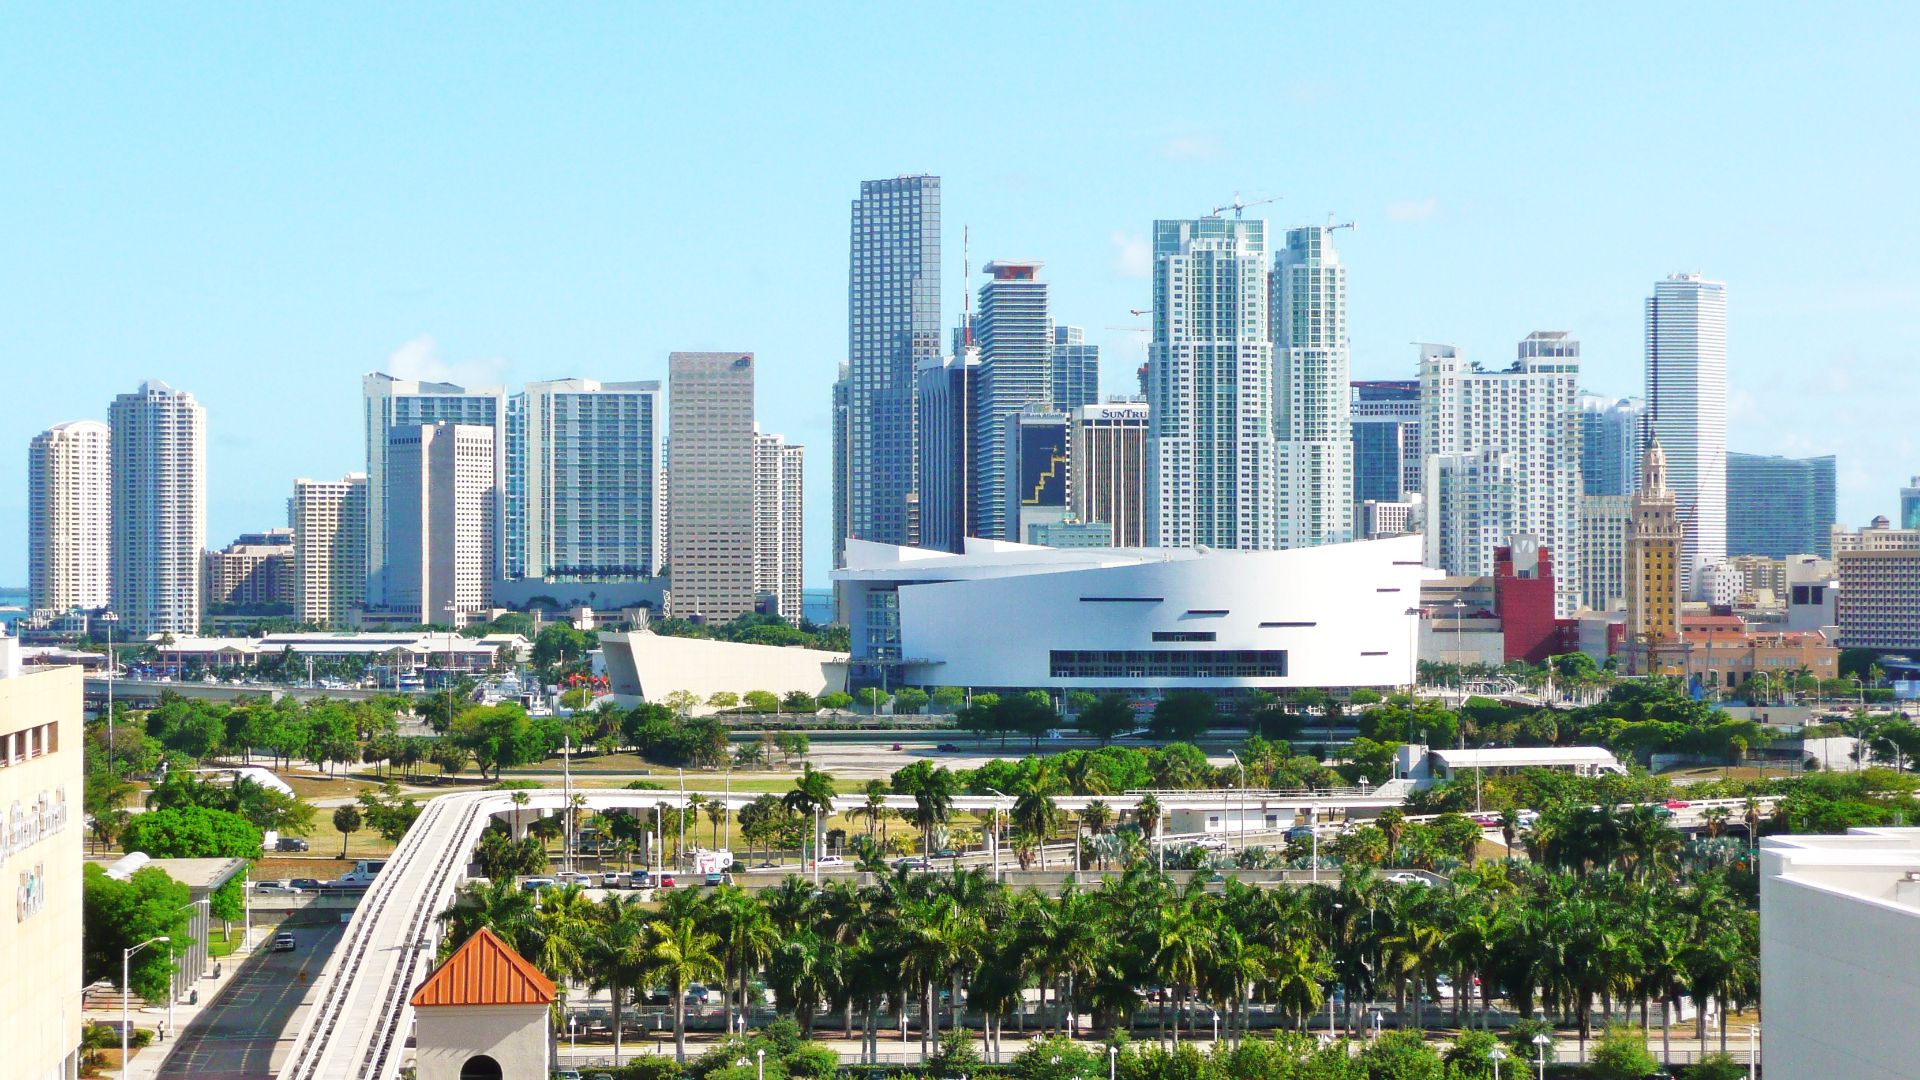
22: Florida
Jobs at automation/AI risk: Above-average (hospitality/retail)
Manufacturing share of jobs: Low (~4%)
Bachelor’s+ adults: 32.5%
AI job demand/readiness: Rising fast in Miami/Orlando
Tourism and service dominate, leaving millions vulnerable despite urban tech growth.
21: Arizona
Jobs at automation/AI risk: Above-average (call centers/logistics)
Manufacturing share of jobs: ~6%
Bachelor’s+ adults: 32.6%
AI job demand/readiness: Strong in Phoenix/Tucson corridors
Back-office hubs face AI disruption; tech growth helps but doesn’t cover all.

20: New Mexico
Jobs at automation/AI risk: Mid-to-high (admin/service skew)
Manufacturing share of jobs: ~5%
Bachelor’s+ adults: 30.9%
AI job demand/readiness: Strong at labs, weak in private sector
Labs provide high-skill jobs, but rural service roles remain exposed.
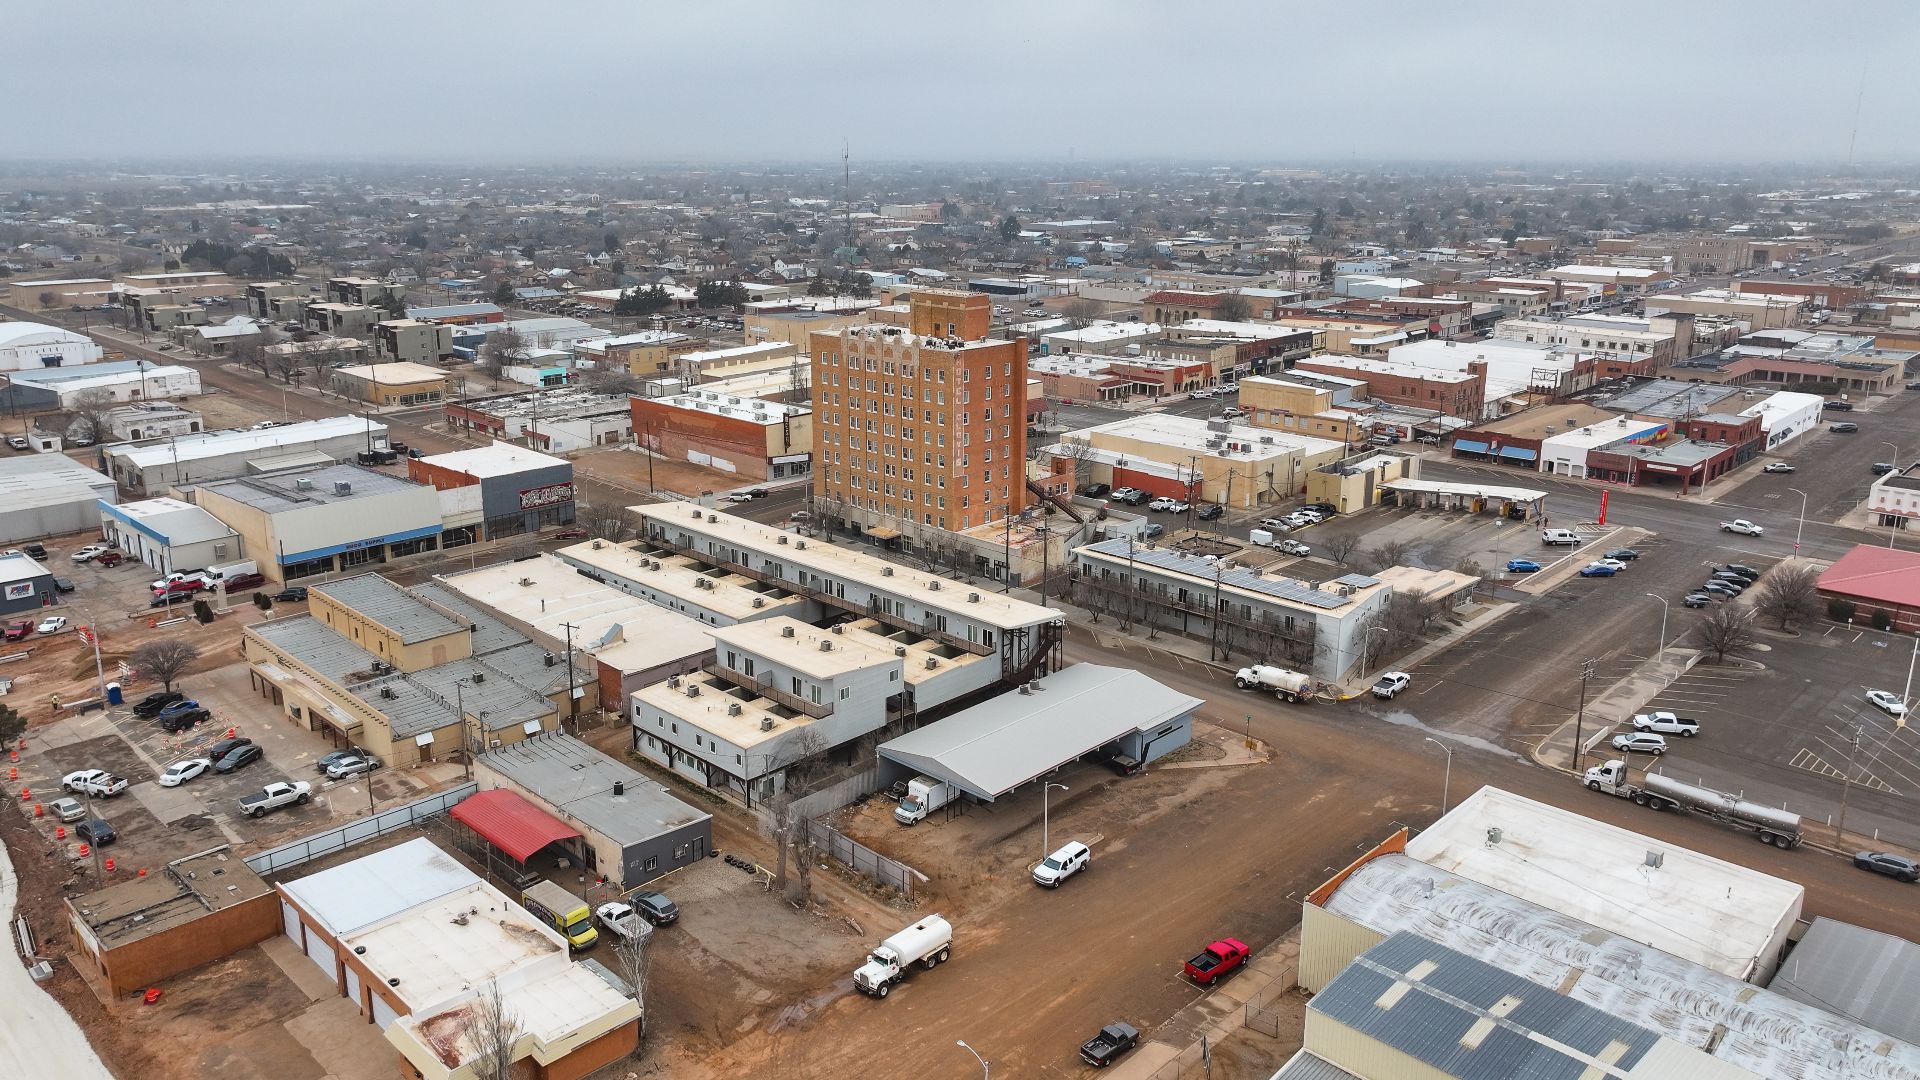 Quintin Soloviev, Wikimedia Commons
19: Pennsylvania
Jobs at automation/AI risk: Mid-to-high (manufacturing corridors)
Manufacturing share of jobs: ~9%
Bachelor’s+ adults: 33.6%
AI job demand/readiness: Lagging regional peers in adoption
Old-school manufacturing areas are vulnerable despite Pittsburgh’s tech revival.
 Popscreenshot, Wikimedia Commons
18: North Carolina
Jobs at automation/AI risk: Mid-to-high (advanced manufacturing/logistics)
Manufacturing share of jobs: ~10%
Bachelor’s+ adults: 33.4%
AI job demand/readiness: Strong in Research Triangle; weaker elsewhere
Tech hubs thrive, but many regions depend on jobs AI targets.
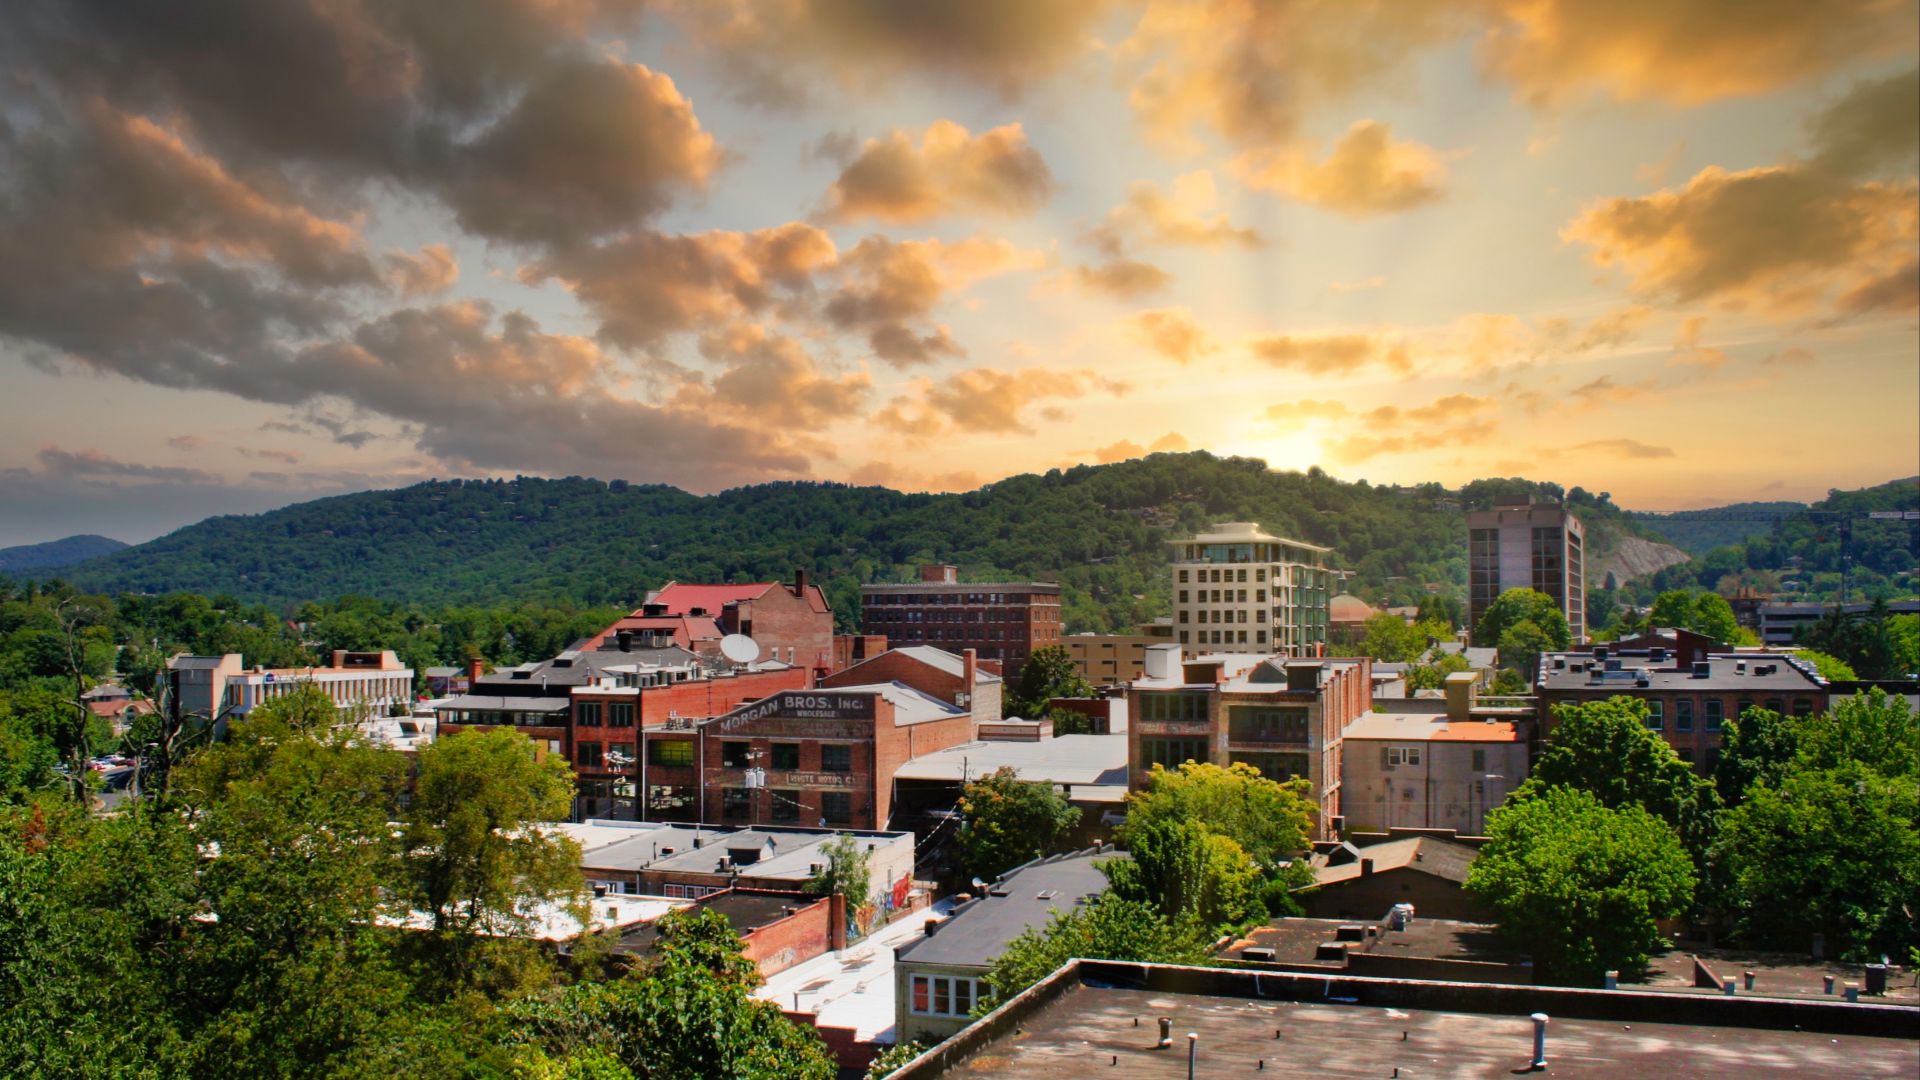 Harrison Keely, Wikimedia Commons
17: Georgia
Jobs at automation/AI risk: Above-average (logistics/service hubs)
Manufacturing share of jobs: ~9%
Bachelor’s+ adults: 33.0%
AI job demand/readiness: Growing fast in Atlanta
Atlanta offsets risk, but rural and logistics-heavy areas face pressure.
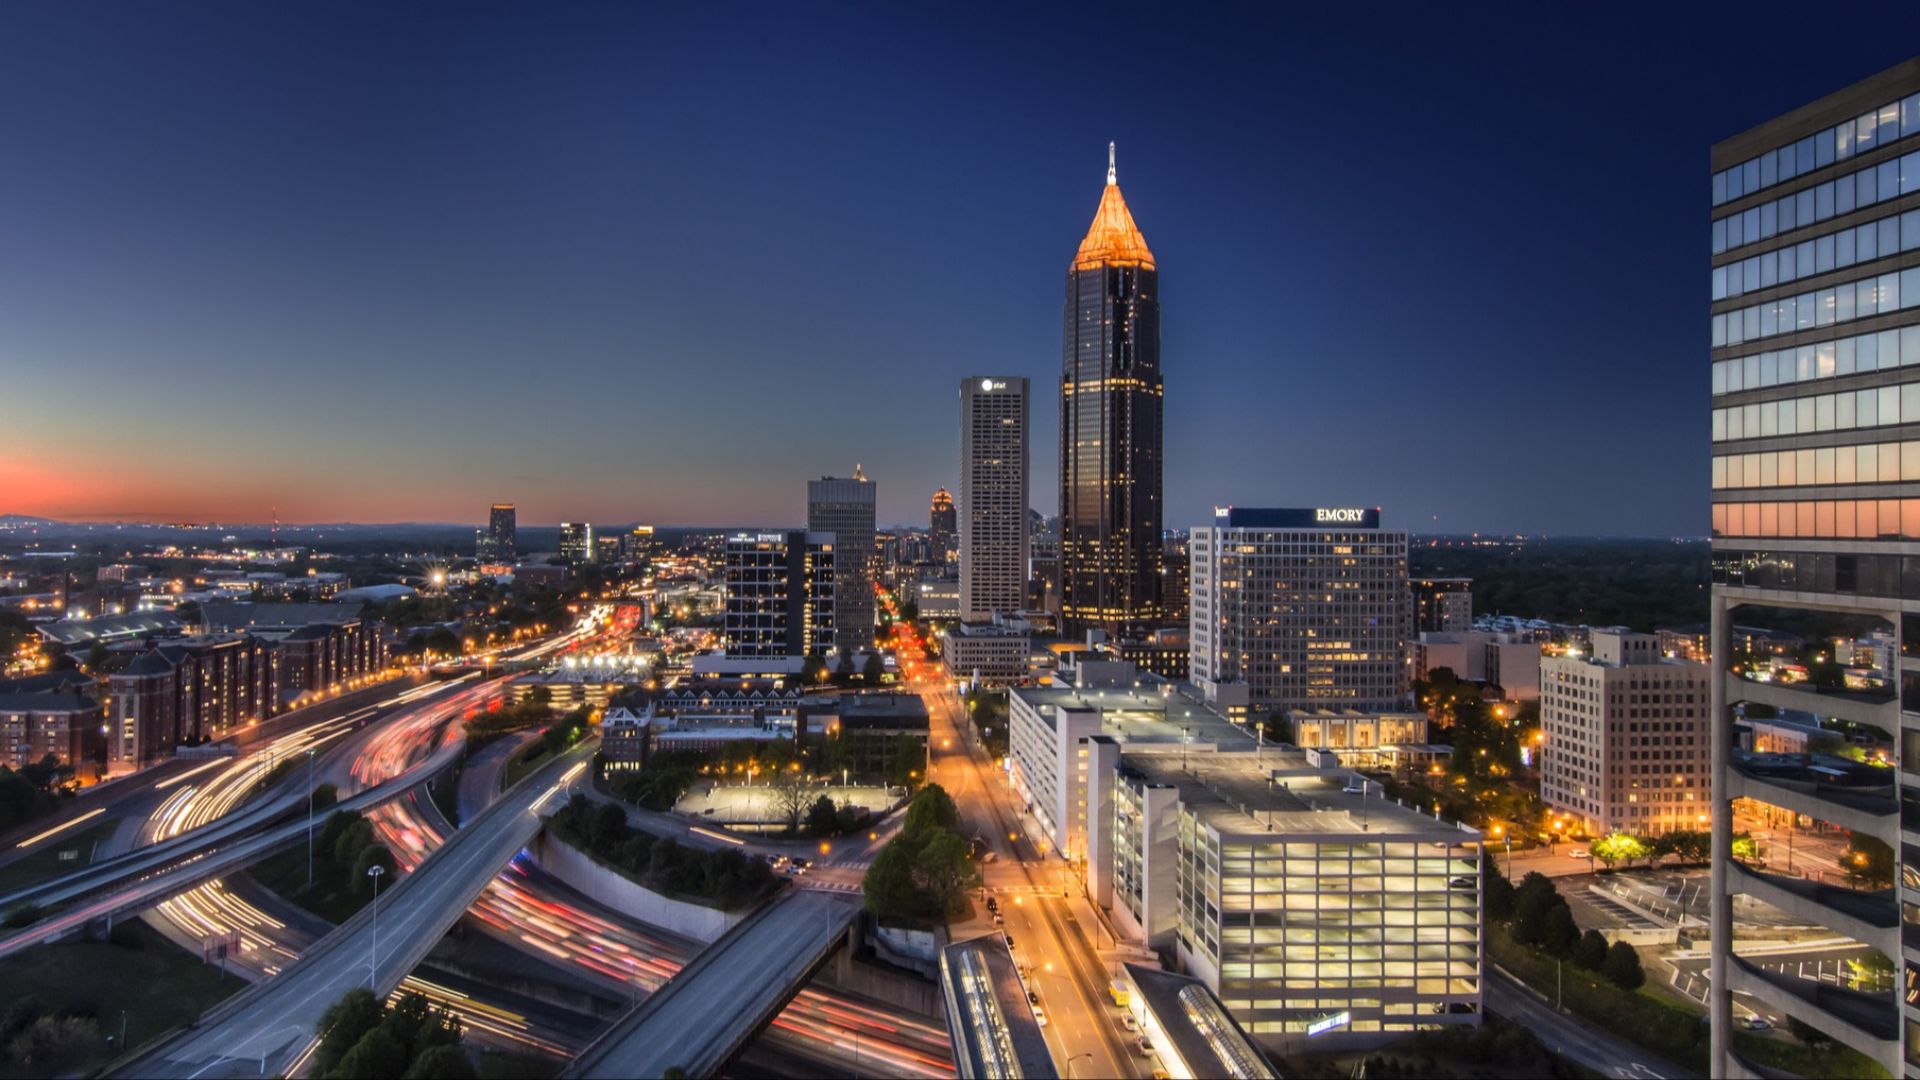 ericstokley, Wikimedia Commons
16: Missouri
Jobs at automation/AI risk: Mid-to-high
Manufacturing share of jobs: ~10%
Bachelor’s+ adults: 31.7%
AI job demand/readiness: Moderate; St. Louis and KC drive demand
Manufacturing and admin hubs align with AI target sectors.
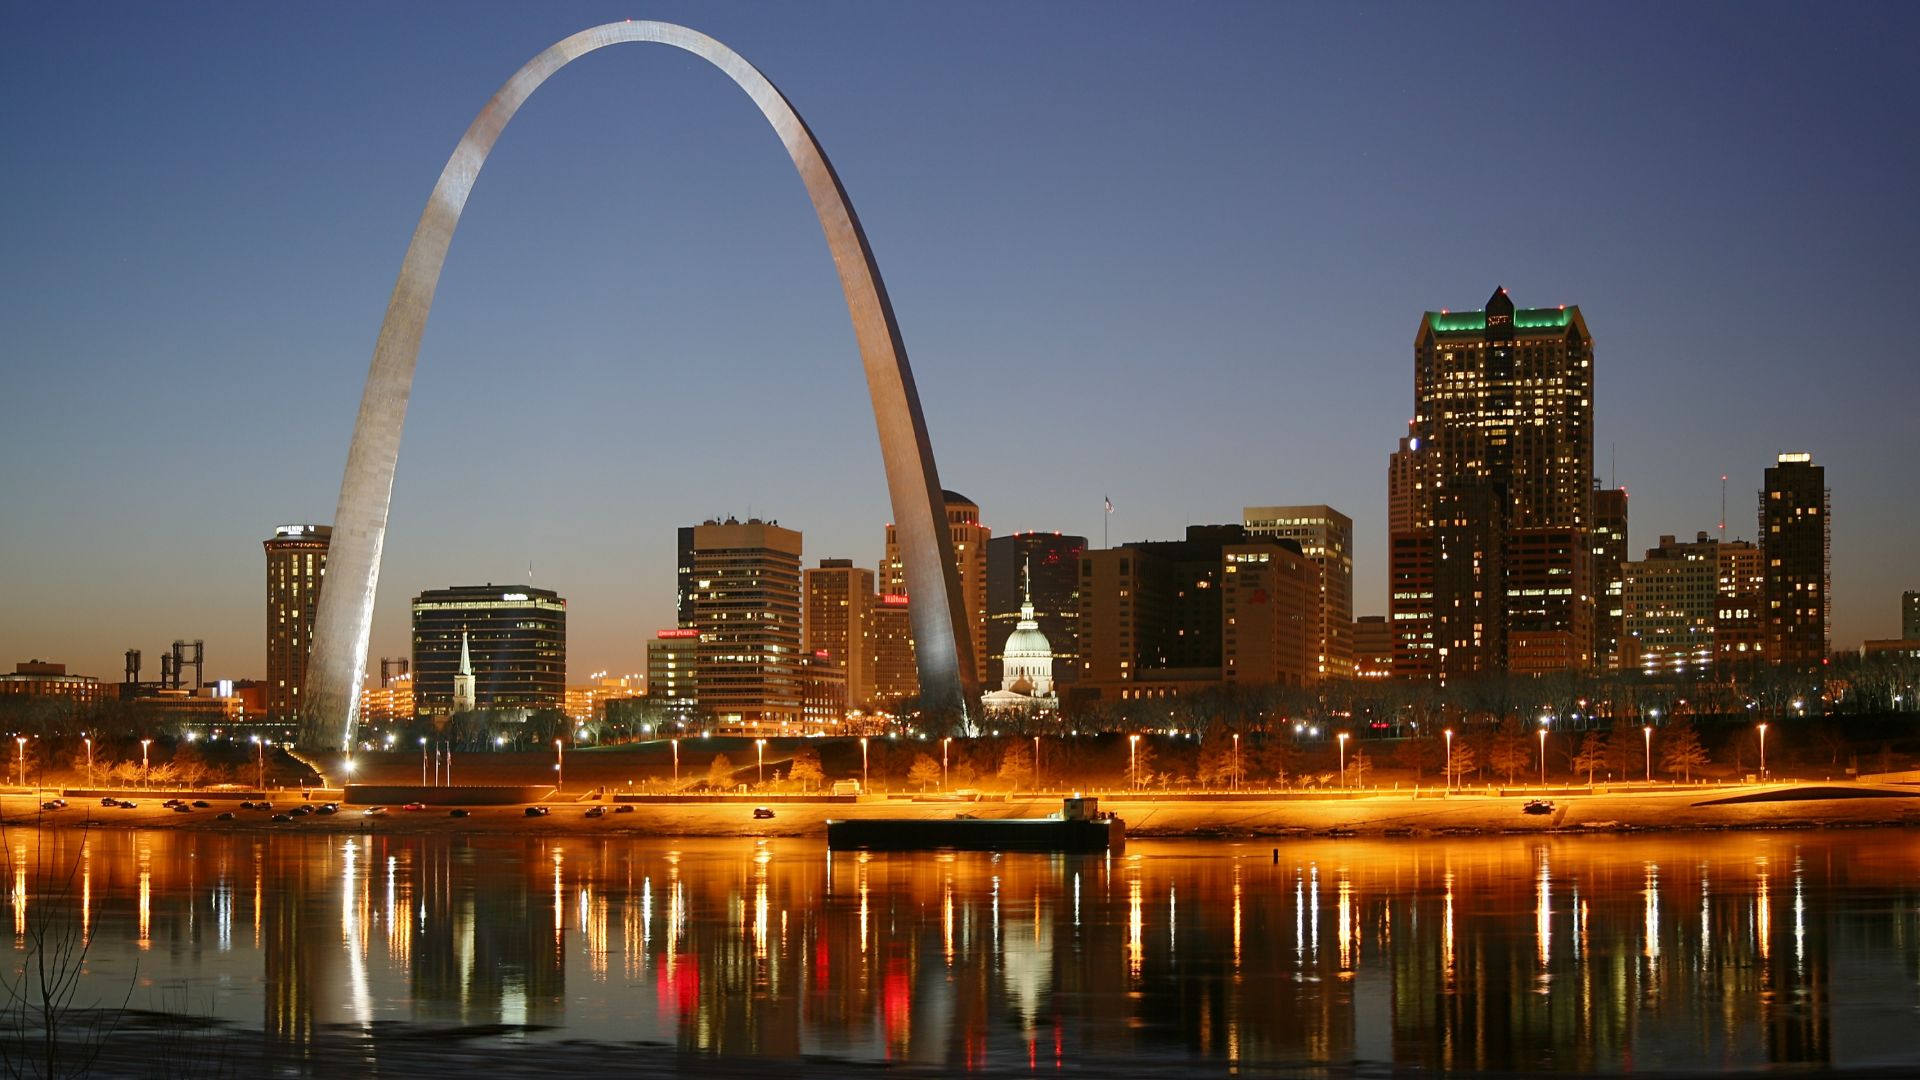 Daniel Schwen, Wikimedia Commons
15: Oregon
Jobs at automation/AI risk: Mid-to-high
Manufacturing share of jobs: ~9%
Bachelor’s+ adults: 35.5%
AI job demand/readiness: Strong in Portland; limited beyond
Portland thrives, but rural areas rely on automatable roles.
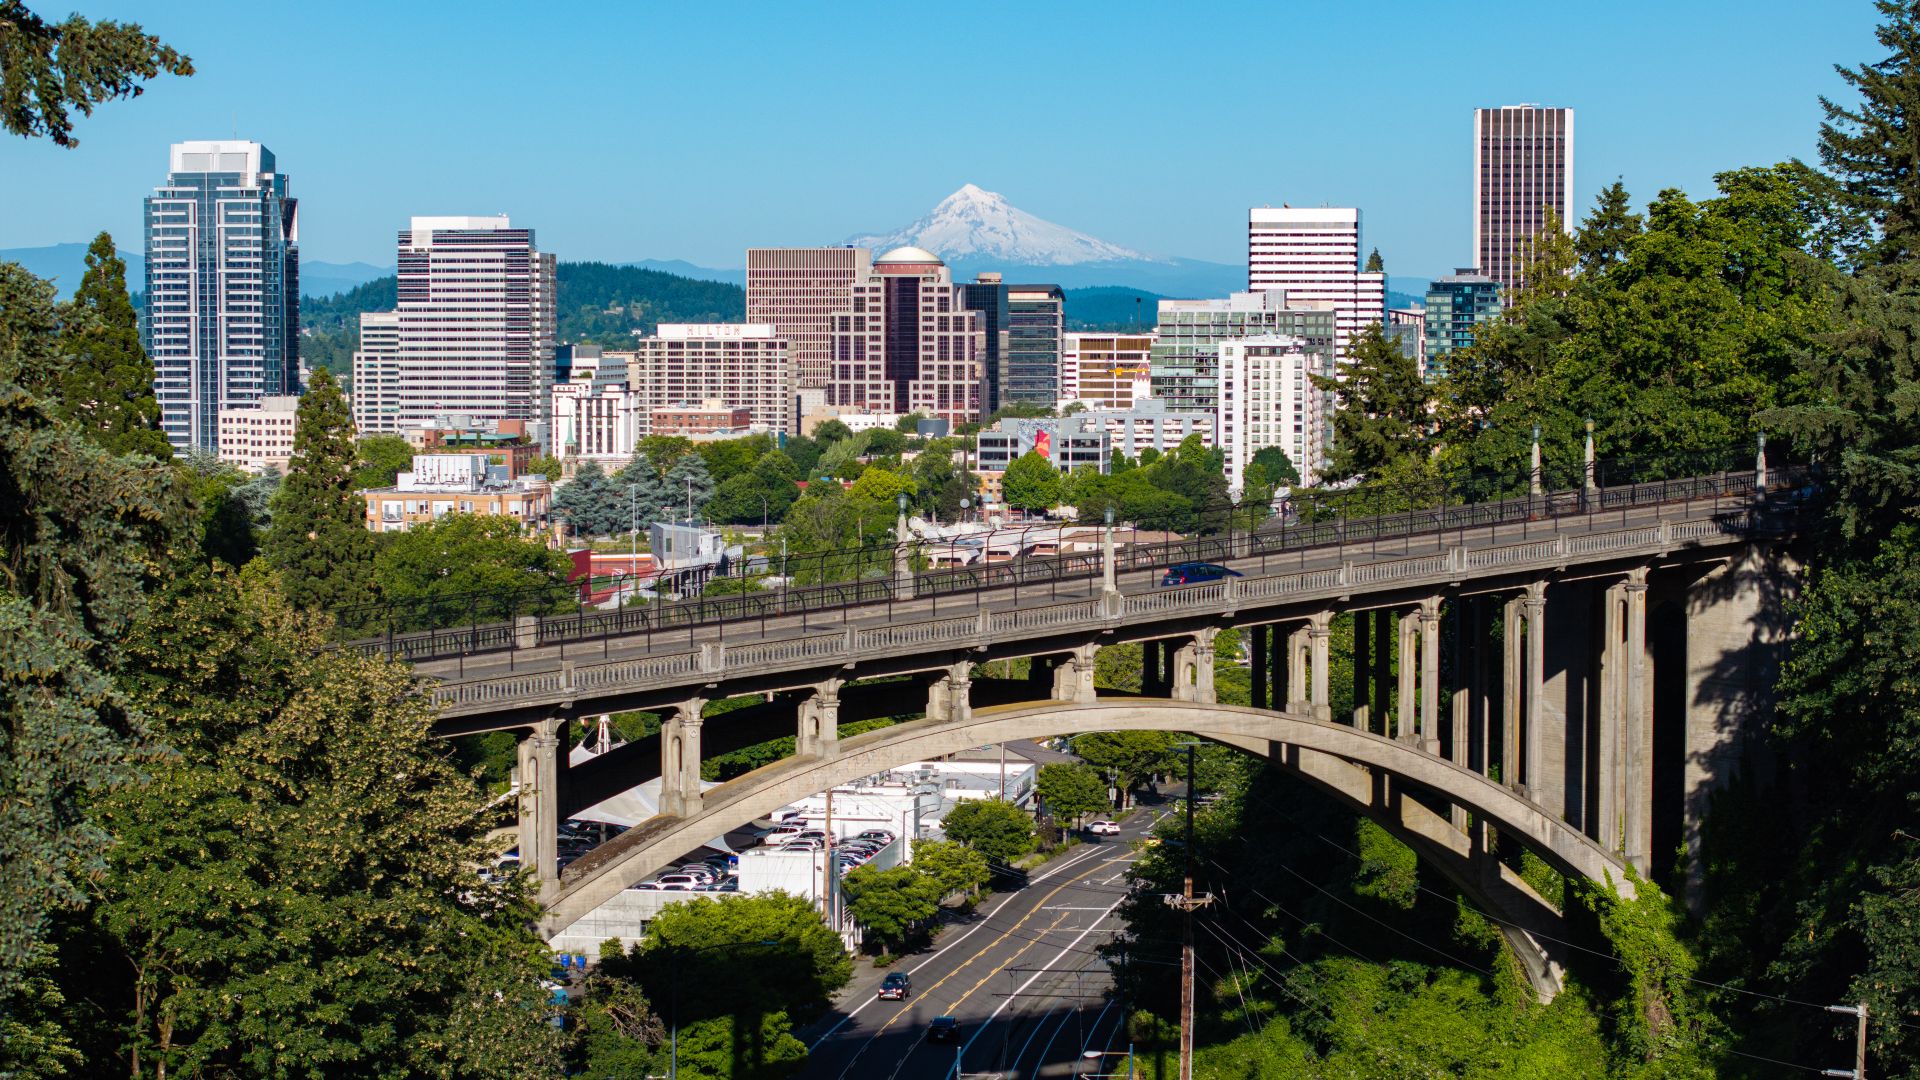 Spicypepper999, Wikimedia Commons
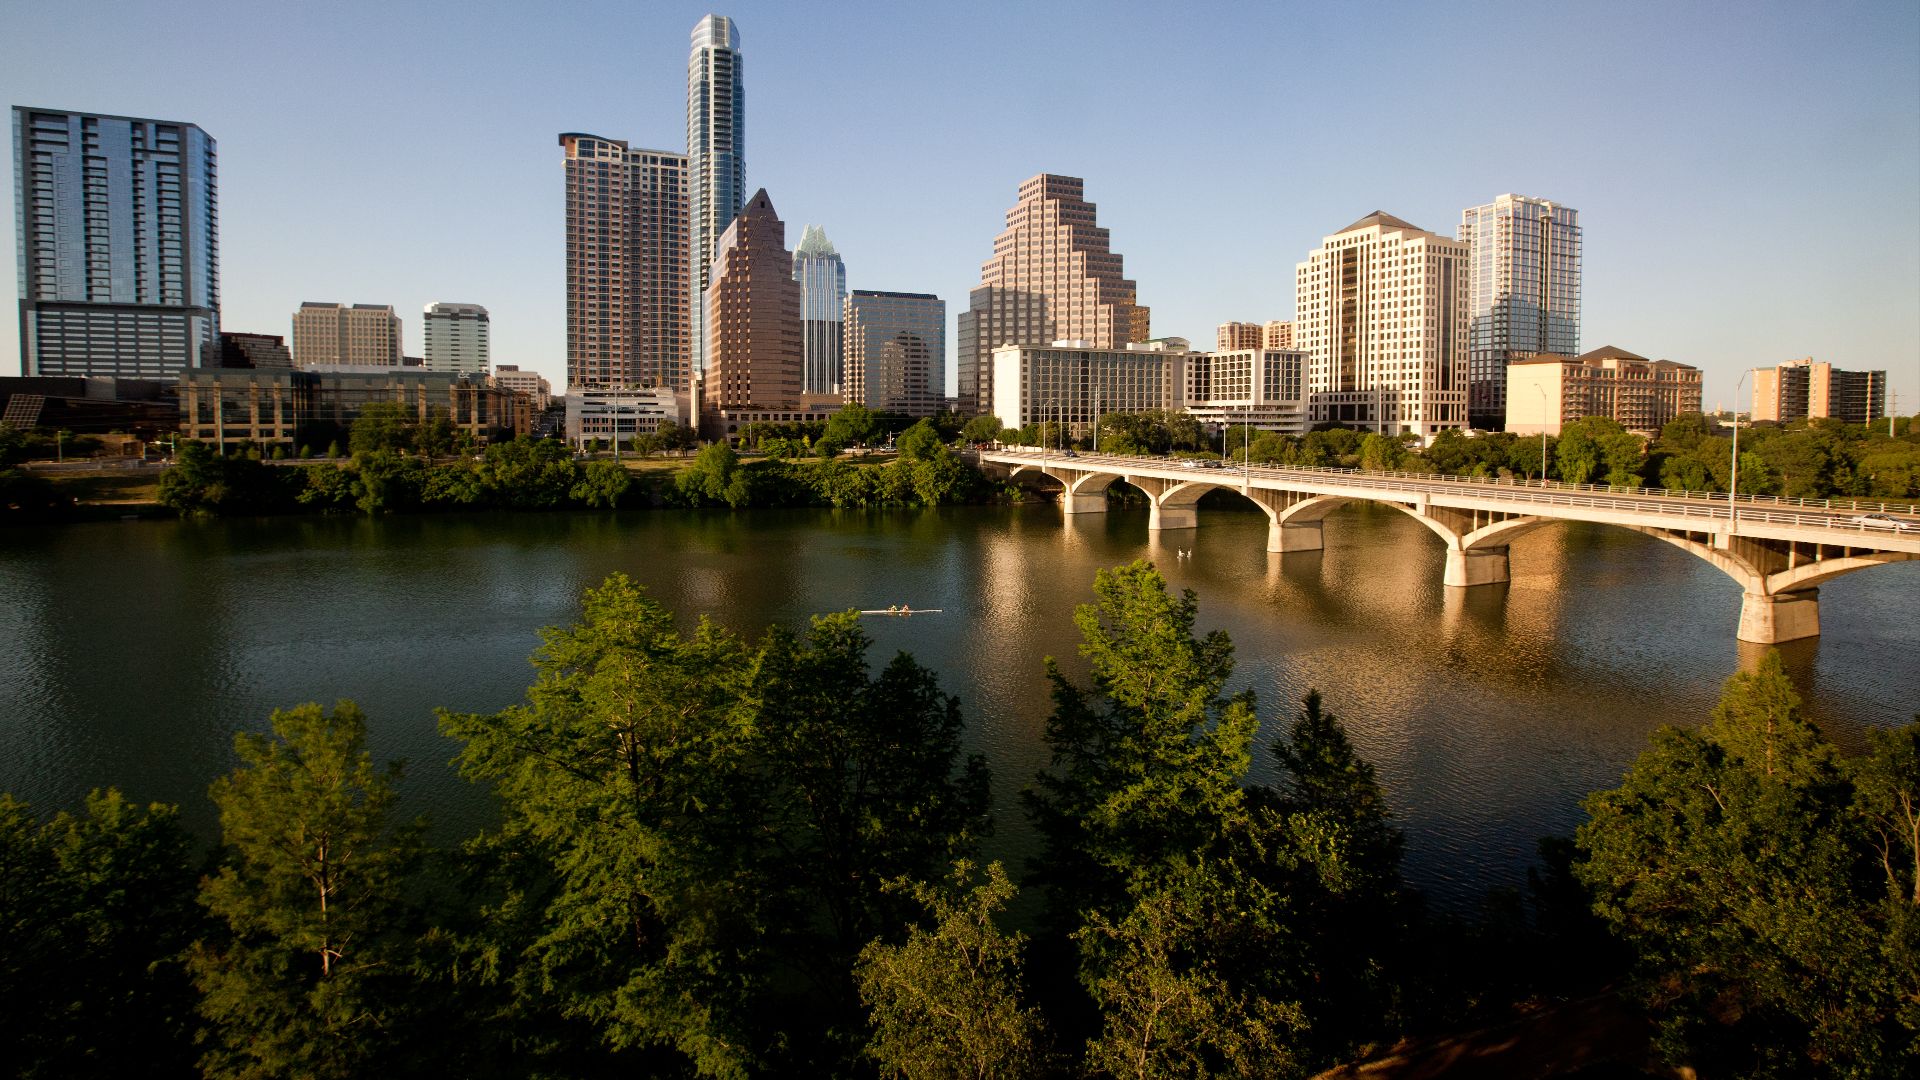
14: Texas
Jobs at automation/AI risk: Mid-to-high (millions of service roles)
Manufacturing share of jobs: ~7%
Bachelor’s+ adults: 33.5%
AI job demand/readiness: Very strong in Austin/Dallas/Houston
Tech metros thrive, but millions of service jobs are vulnerable.
13: Tennessee
Jobs at automation/AI risk: Above-average
Manufacturing share of jobs: ~11%
Bachelor’s+ adults: 30.2%
AI job demand/readiness: Growing in Nashville/Memphis
Logistics and manufacturing dominate, raising exposure.

12: Ohio
Jobs at automation/AI risk: High (manufacturing legacy)
Manufacturing share of jobs: ~12%
Bachelor’s+ adults: 31.0%
AI job demand/readiness: Strong in Columbus/Cincinnati; weaker elsewhere
Legacy industries heighten risk, with uneven education levels.
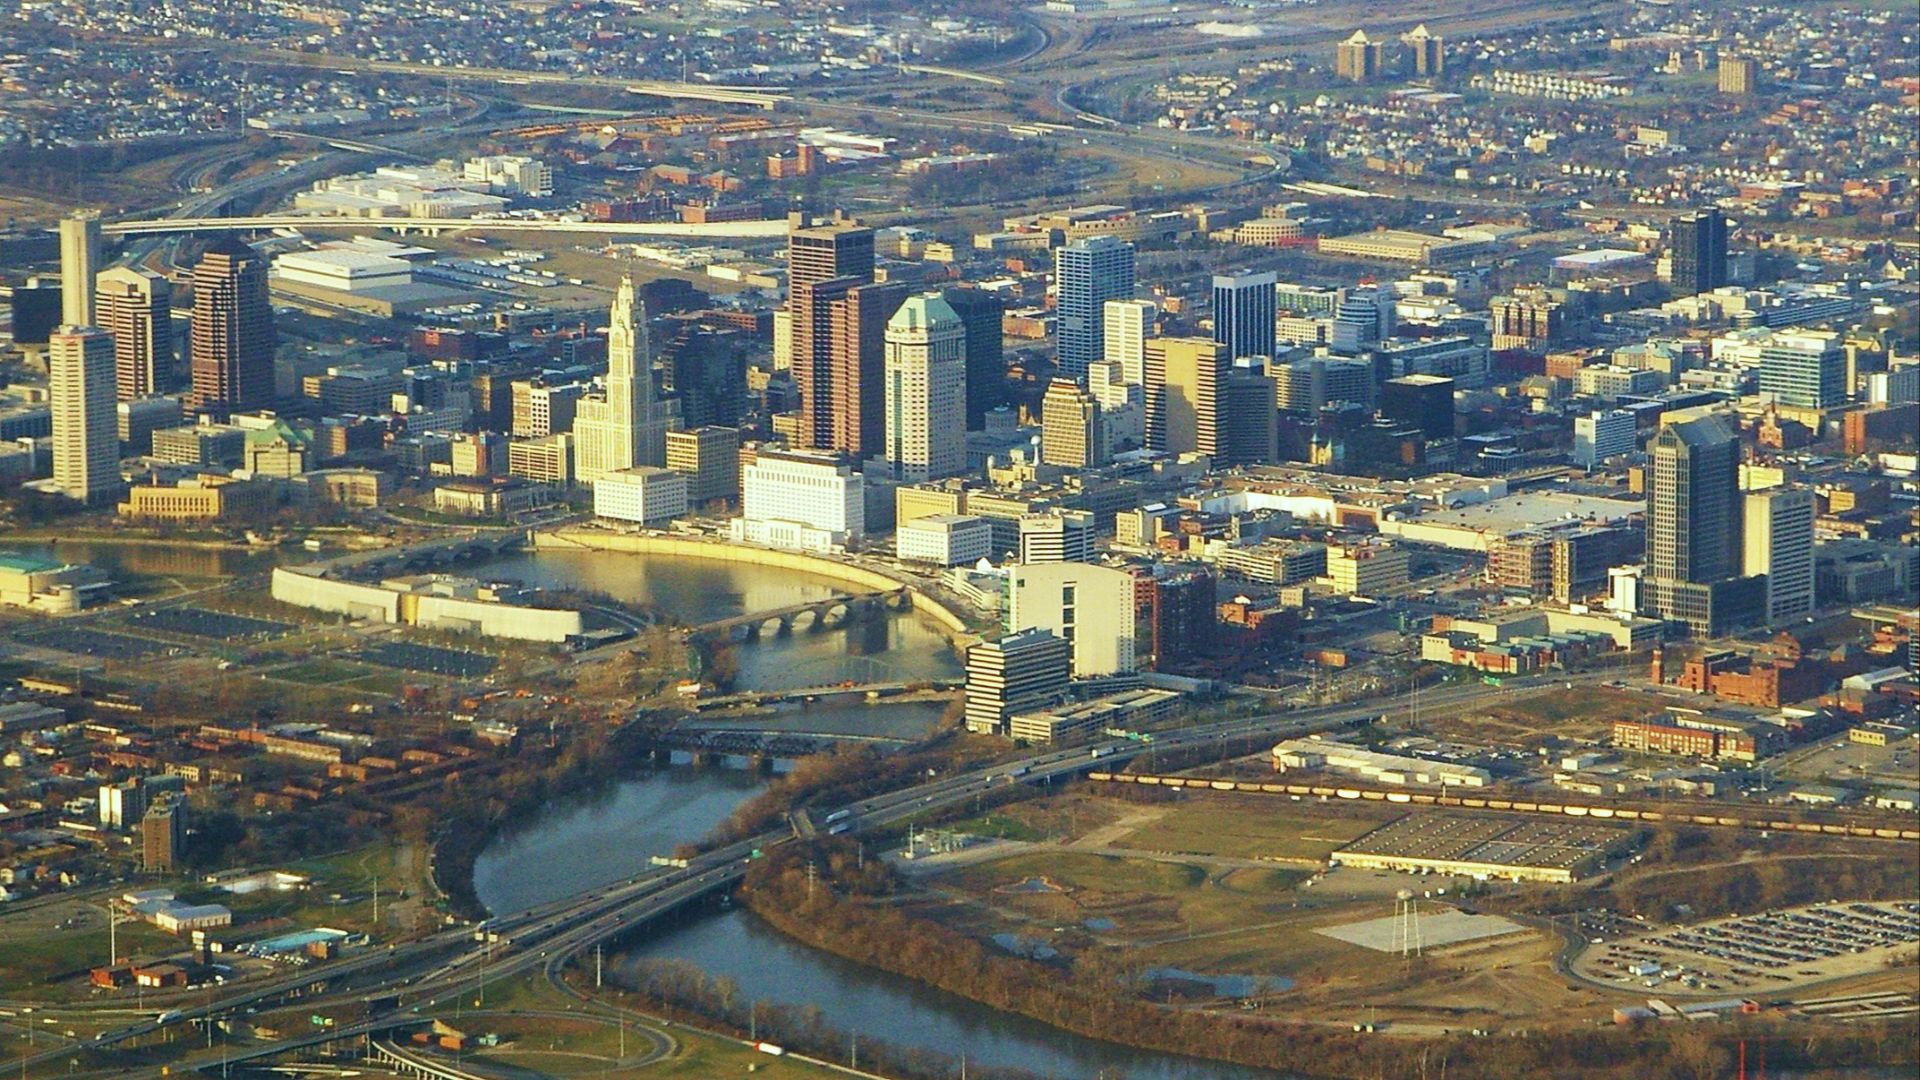 Ron Reiring, Wikimedia Commons
11: Michigan
Jobs at automation/AI risk: High (auto/parts)
Manufacturing share of jobs: ~14%
Bachelor’s+ adults: 30.7%
AI job demand/readiness: Growing in Detroit/Ann Arbor
Auto re-engineering boosts productivity but cuts routine roles.
 Crisco 1492, Wikimedia Commons
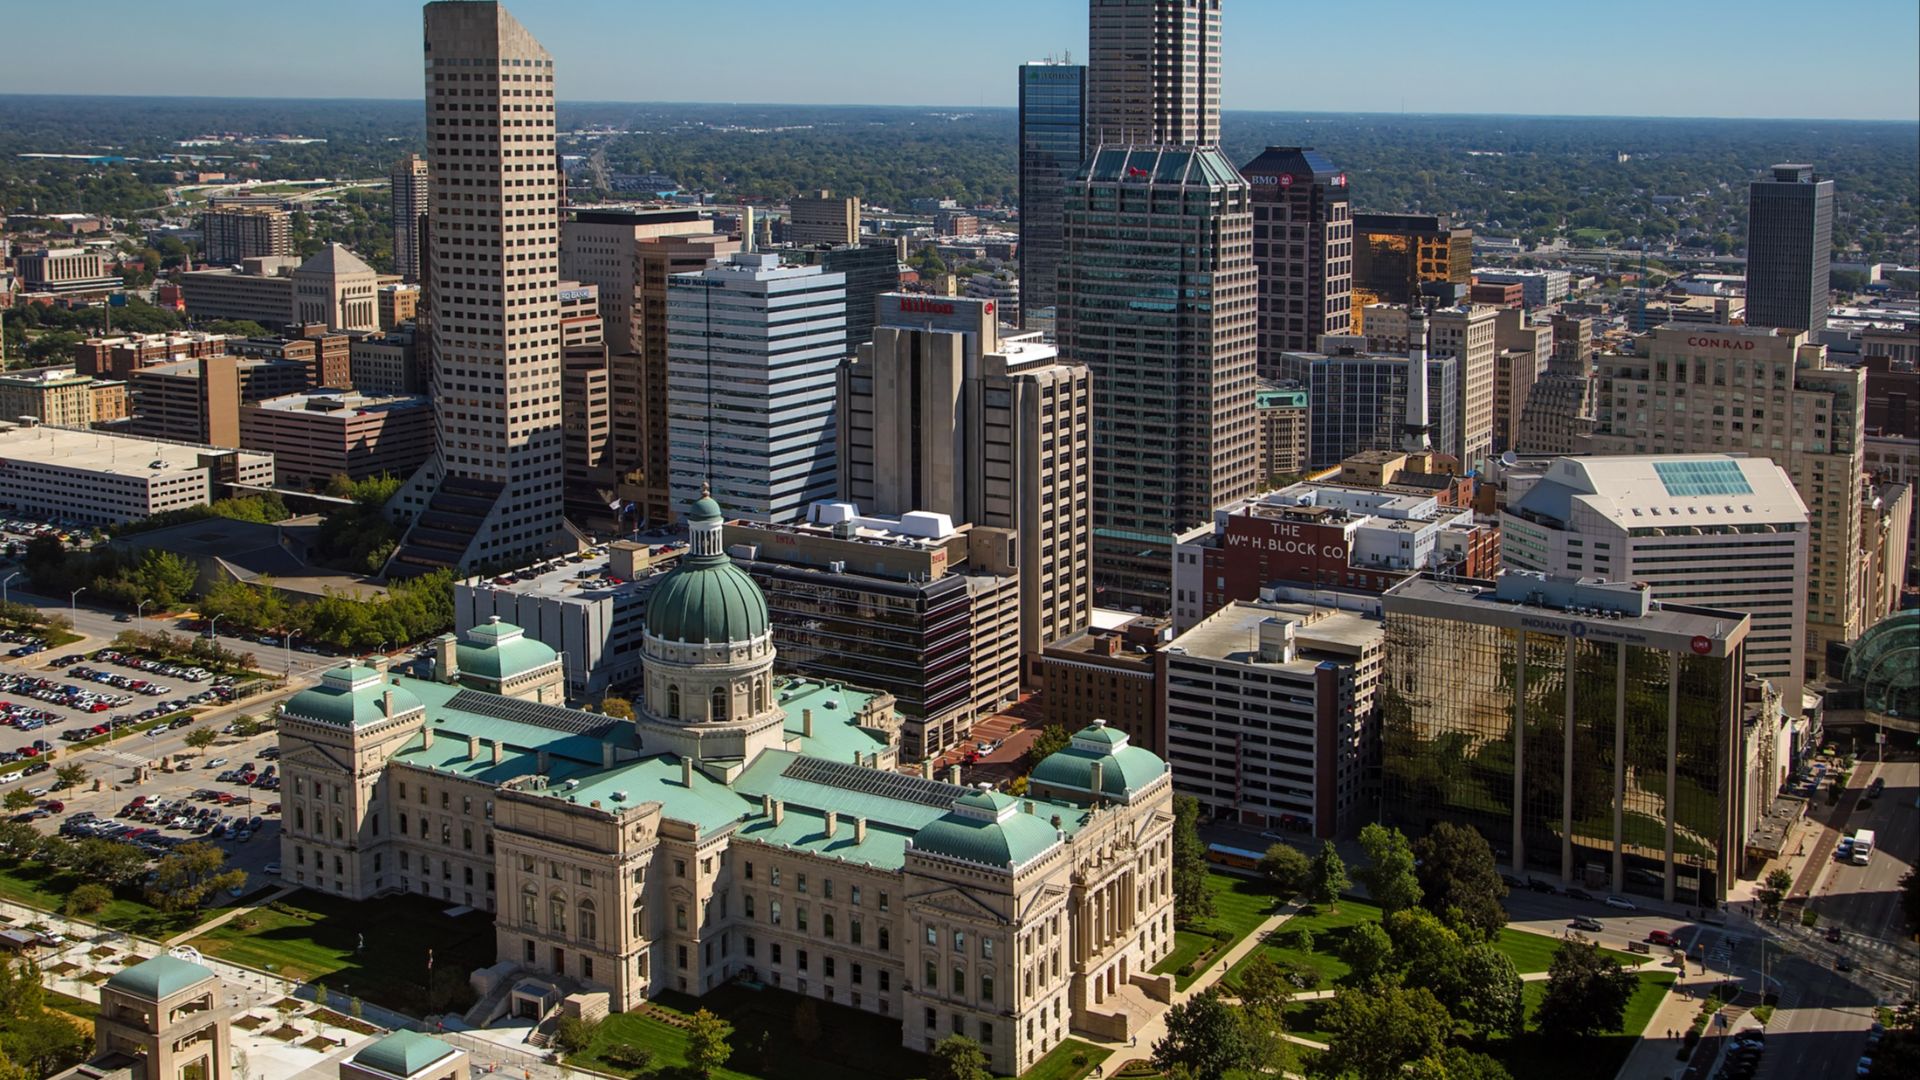
10: Indiana
Jobs at automation/AI risk: High (top tier)
Manufacturing share of jobs: ~15.8% (highest in U.S.)
Bachelor’s+ adults: 28.8%
AI job demand/readiness: Uneven; growth in Indy corridor
Heavy reliance on manufacturing makes Indiana highly exposed.
9: South Carolina
Jobs at automation/AI risk: Just over 55%
Manufacturing share of jobs: ~11%
Bachelor’s+ adults: 31.5%
AI job demand/readiness: Growing, but concentrated in few metros
Advanced manufacturing and ports bring growth and risk.

8: Oklahoma
Jobs at automation/AI risk: High (energy + admin)
Manufacturing share of jobs: ~7%
Bachelor’s+ adults: 27.8%
AI job demand/readiness: Modest outside OKC/Tulsa
Energy and admin roles are exposed to AI disruption.
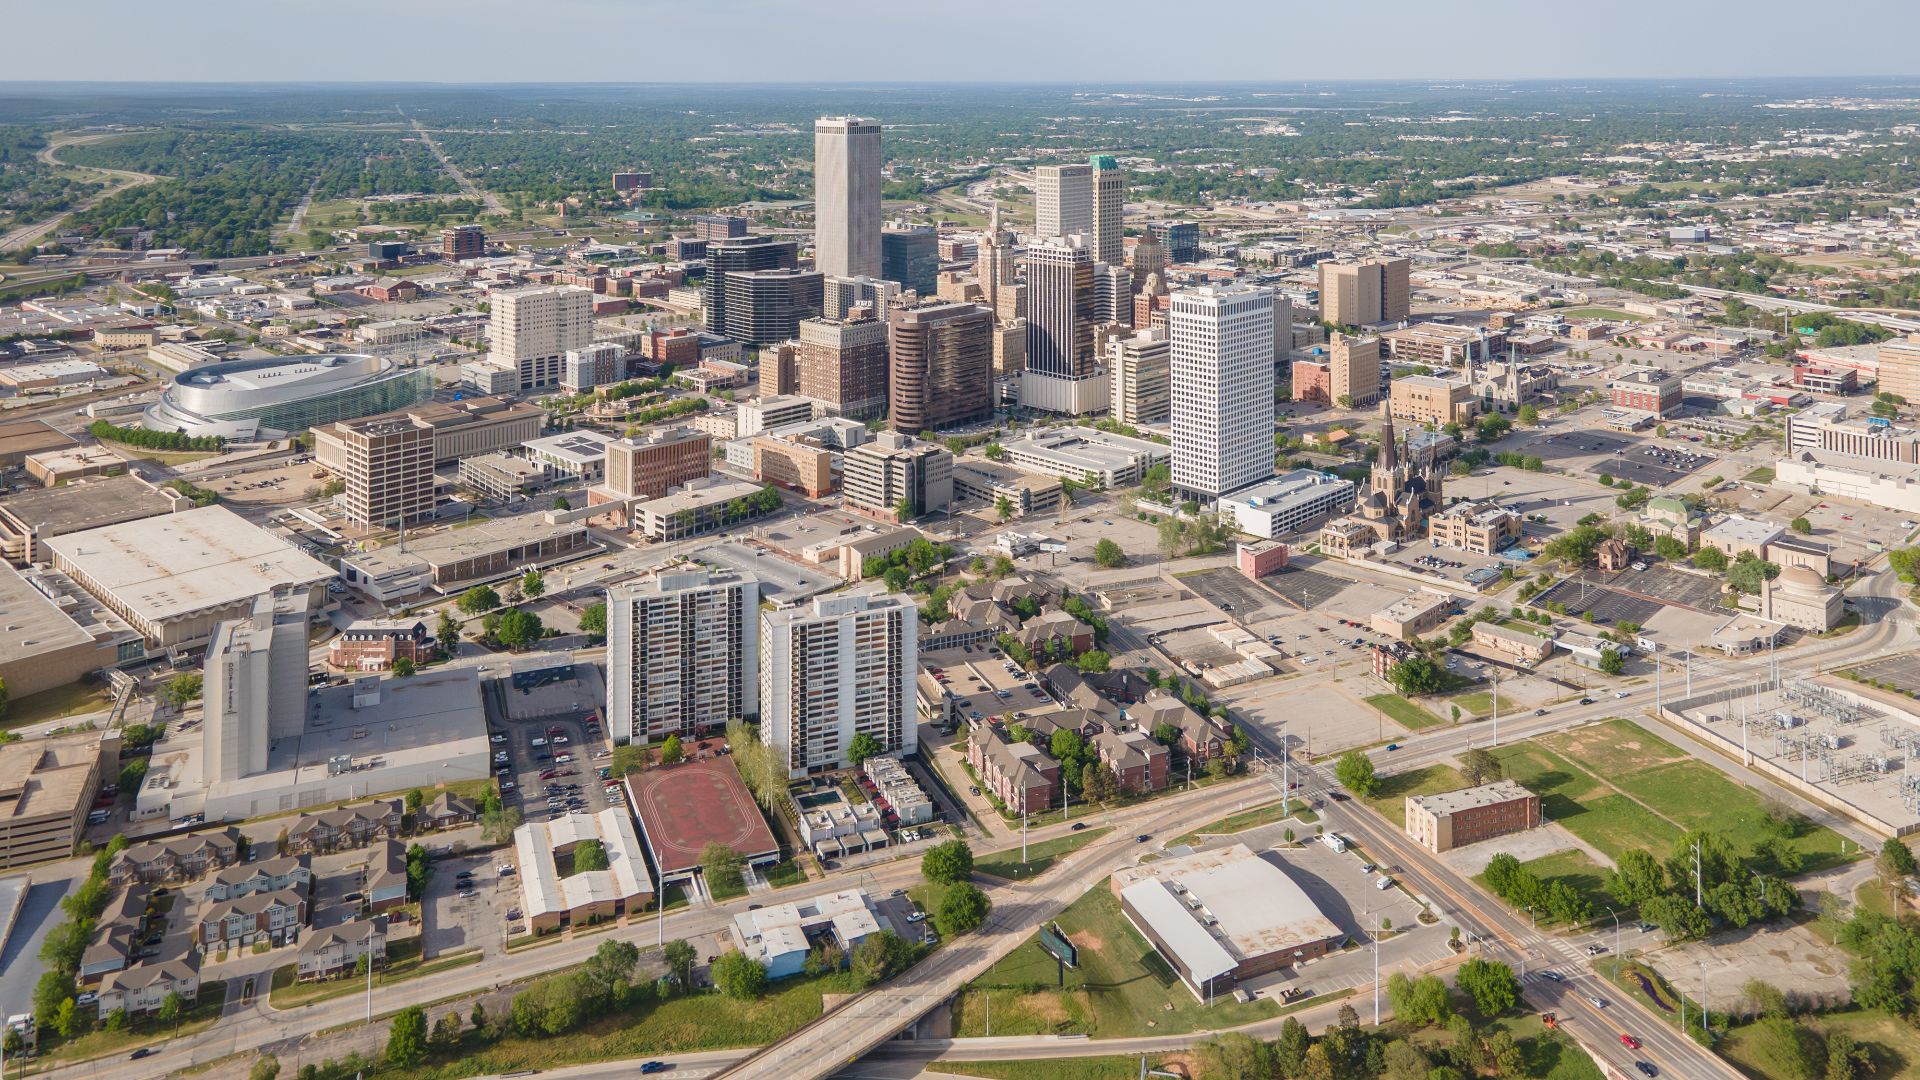 Nils Huenerfuerst, Wikimedia Commons
7: Kentucky
Jobs at automation/AI risk: High (auto/parts)
Manufacturing share of jobs: ~13%
Bachelor’s+ adults: 27.0%
AI job demand/readiness: Moderate; hubbed in Louisville/Lexington
Auto-heavy economy heightens AI risk.
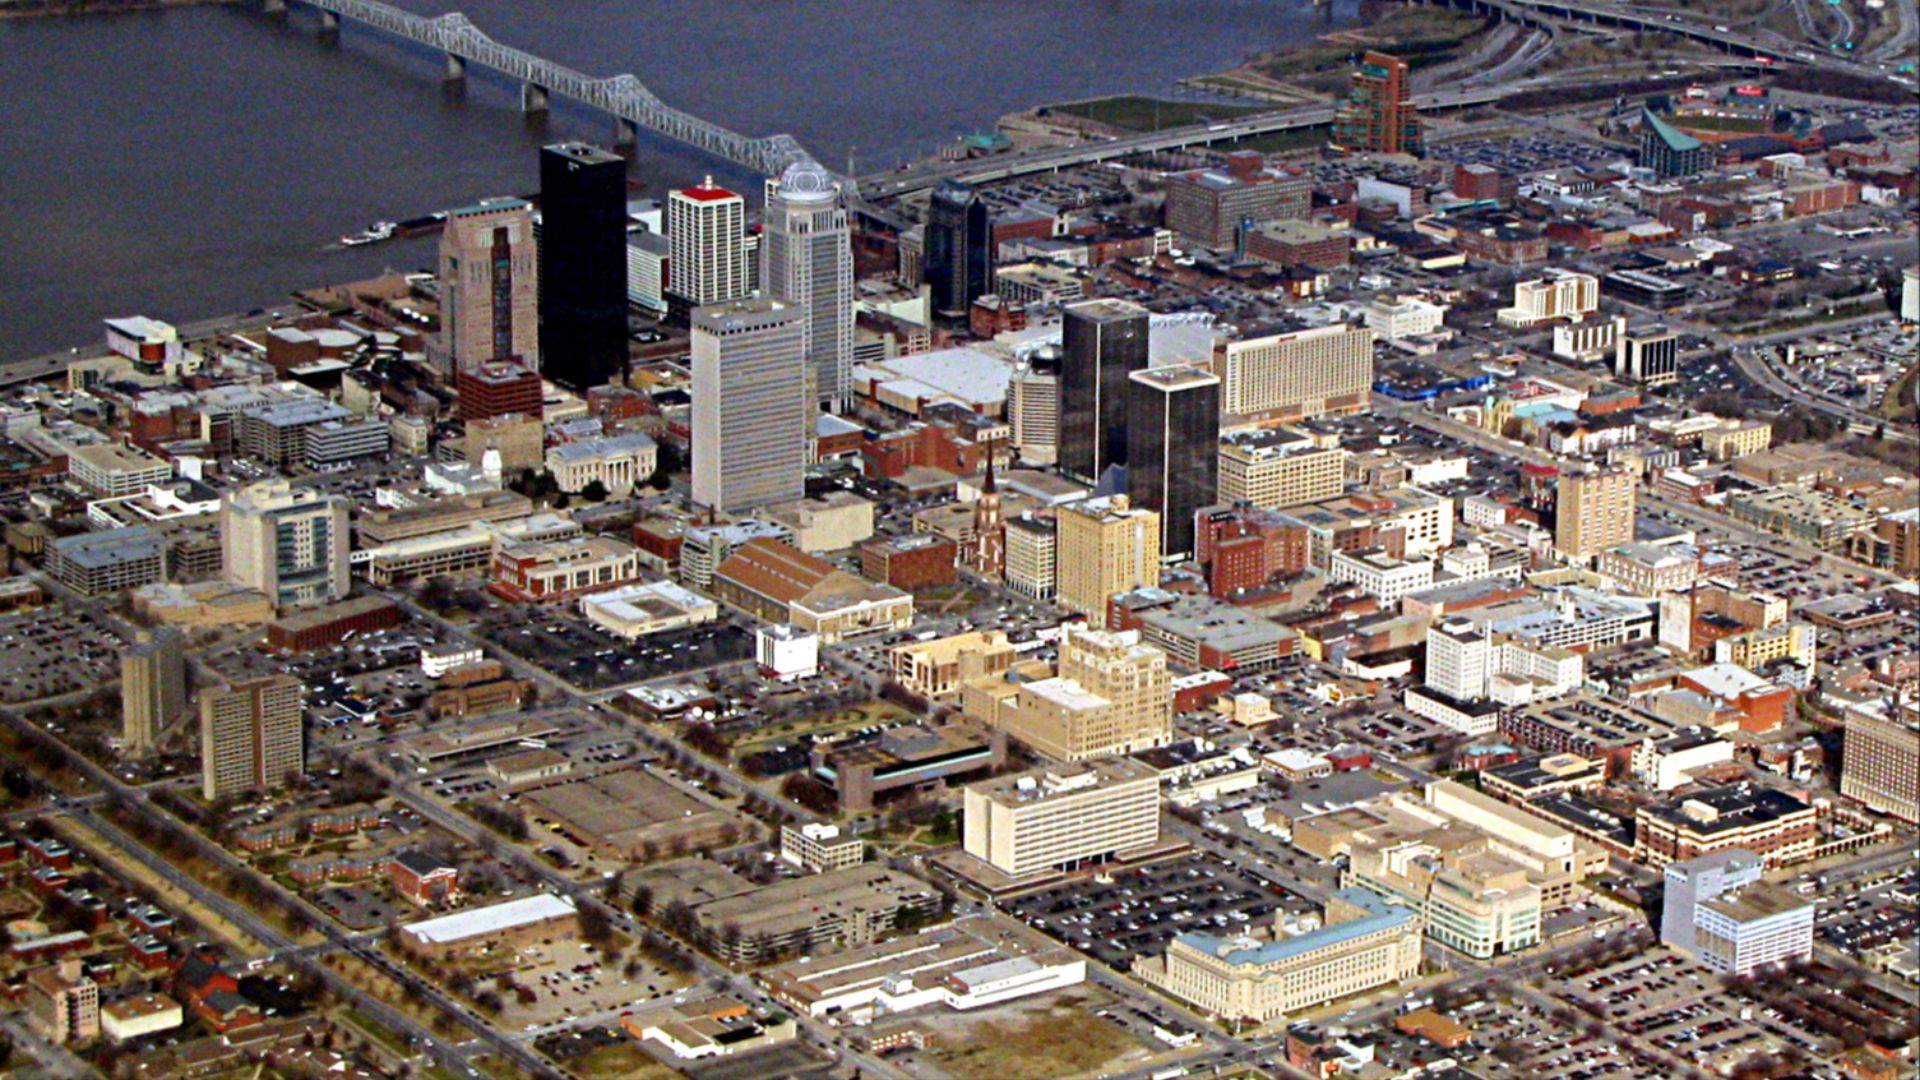 Ken Lund from Reno, Nevada, USA, Wikimedia Commons
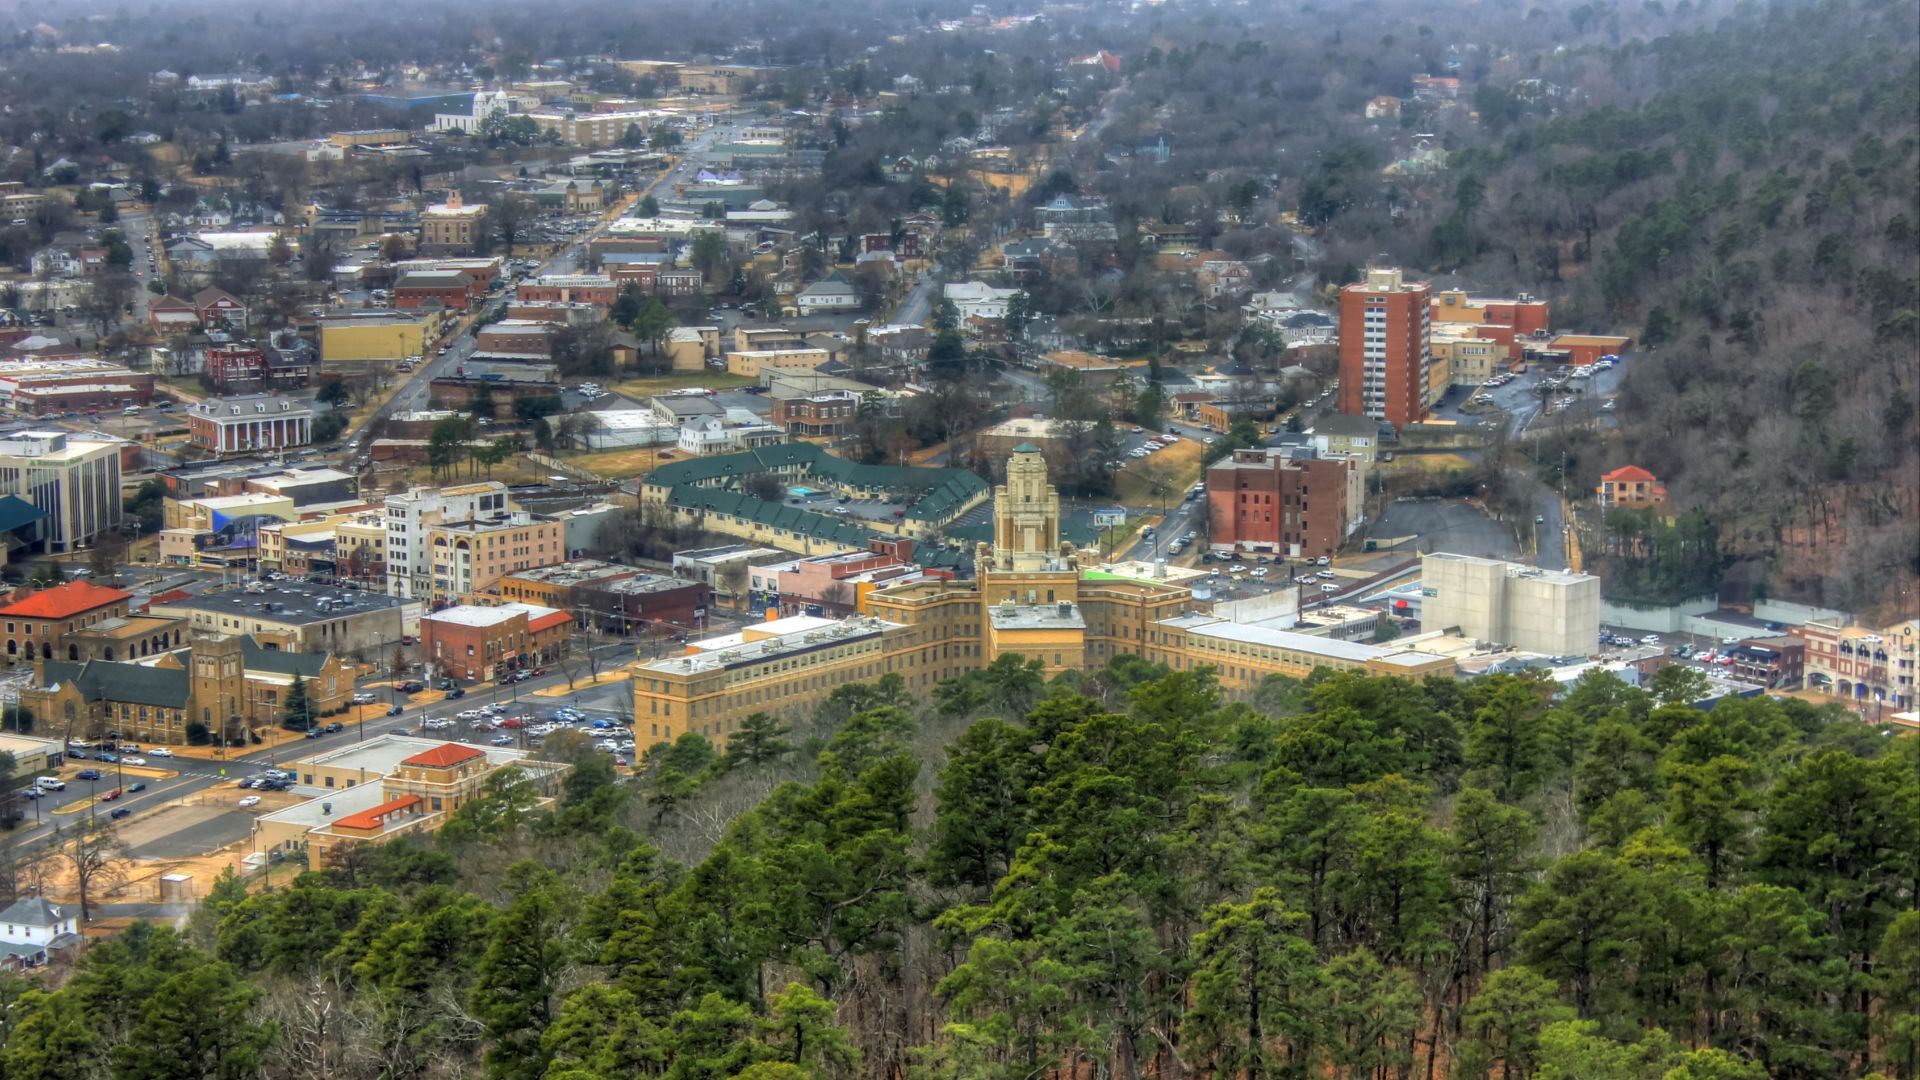
6: Arkansas
Jobs at automation/AI risk: High
Manufacturing share of jobs: ~9%
Bachelor’s+ adults: 25.1%
AI job demand/readiness: Modest outside NWA corridor
Retail and logistics jobs face early AI substitution.
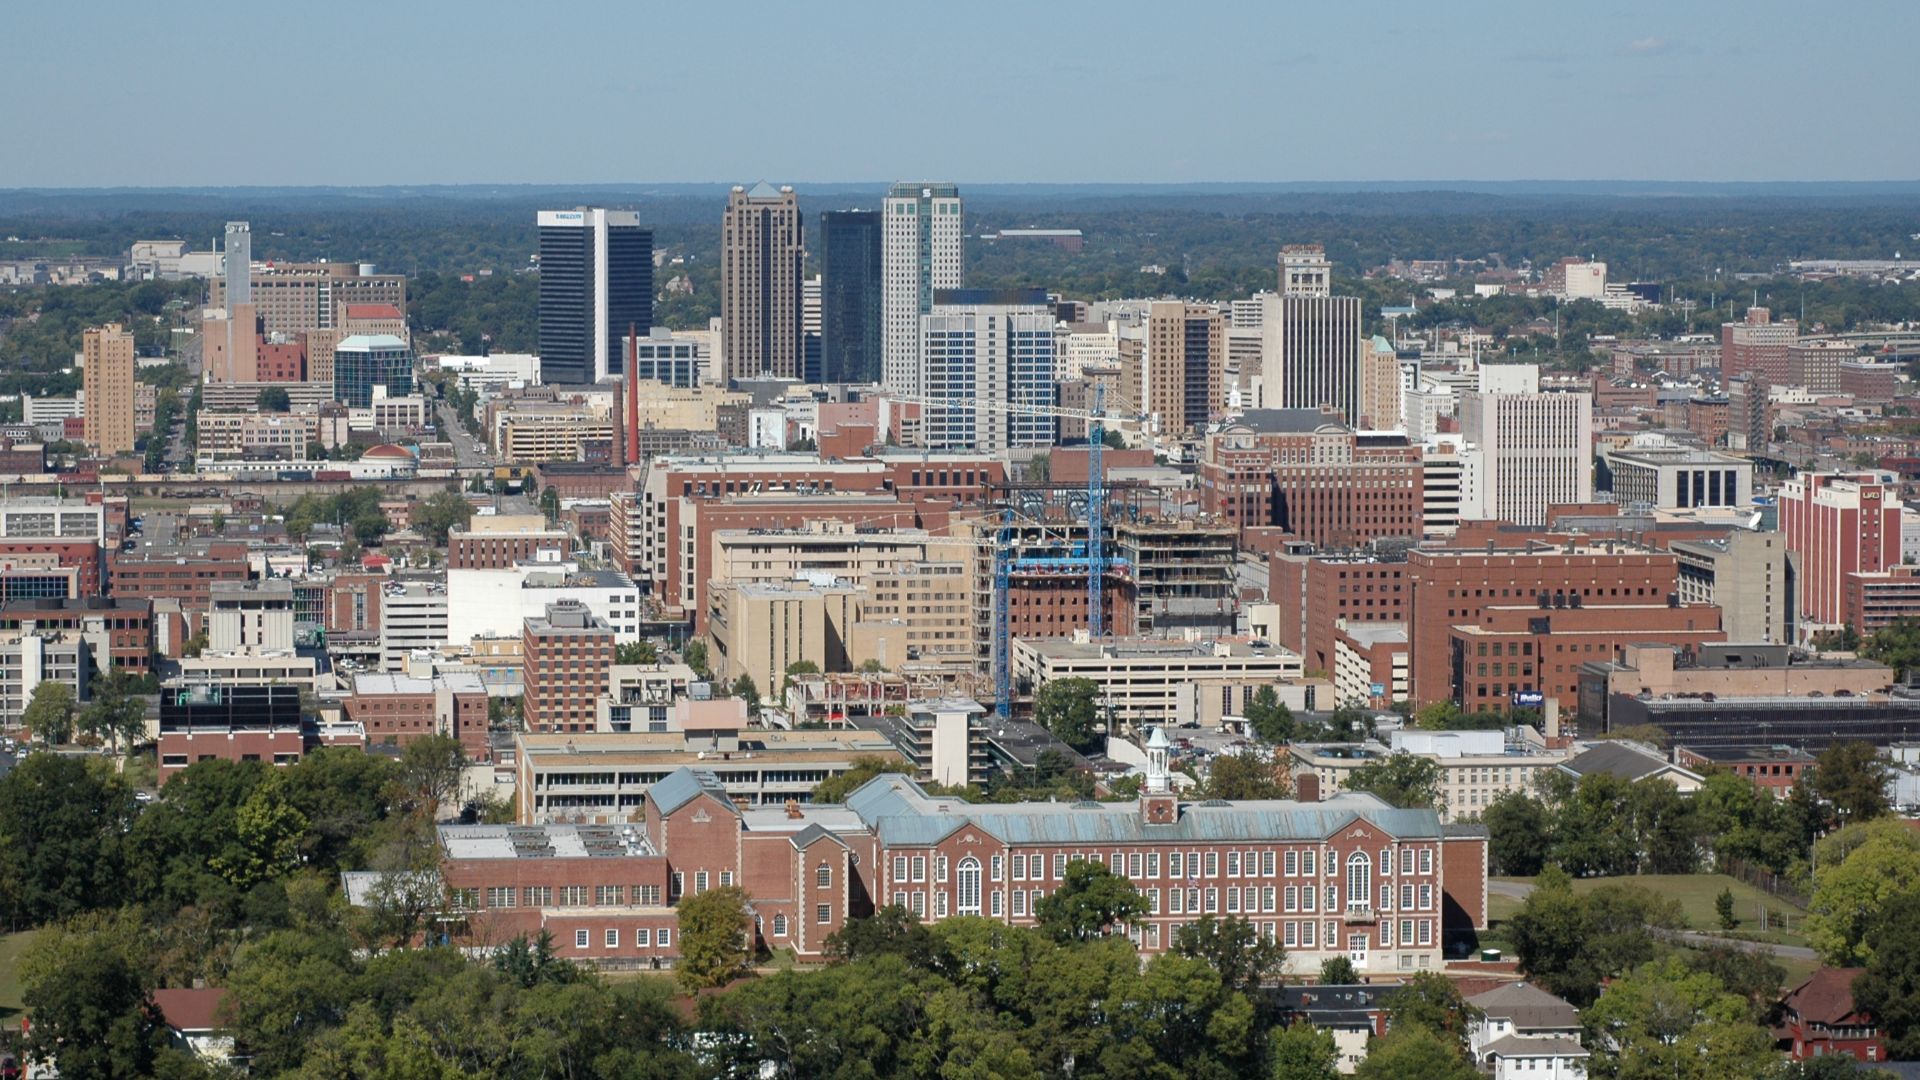
5: Alabama
Jobs at automation/AI risk: Just under 55%
Manufacturing share of jobs: ~13%
Bachelor’s+ adults: 27.8%
AI job demand/readiness: Uneven outside major metros
Auto corridors and routine work leave Alabama vulnerable.
4: Louisiana
Jobs at automation/AI risk: ~56%
Manufacturing share of jobs: ~8%
Bachelor’s+ adults: 26.6%
AI job demand/readiness: Modest
Energy and clerical sectors combine for dual AI exposure.
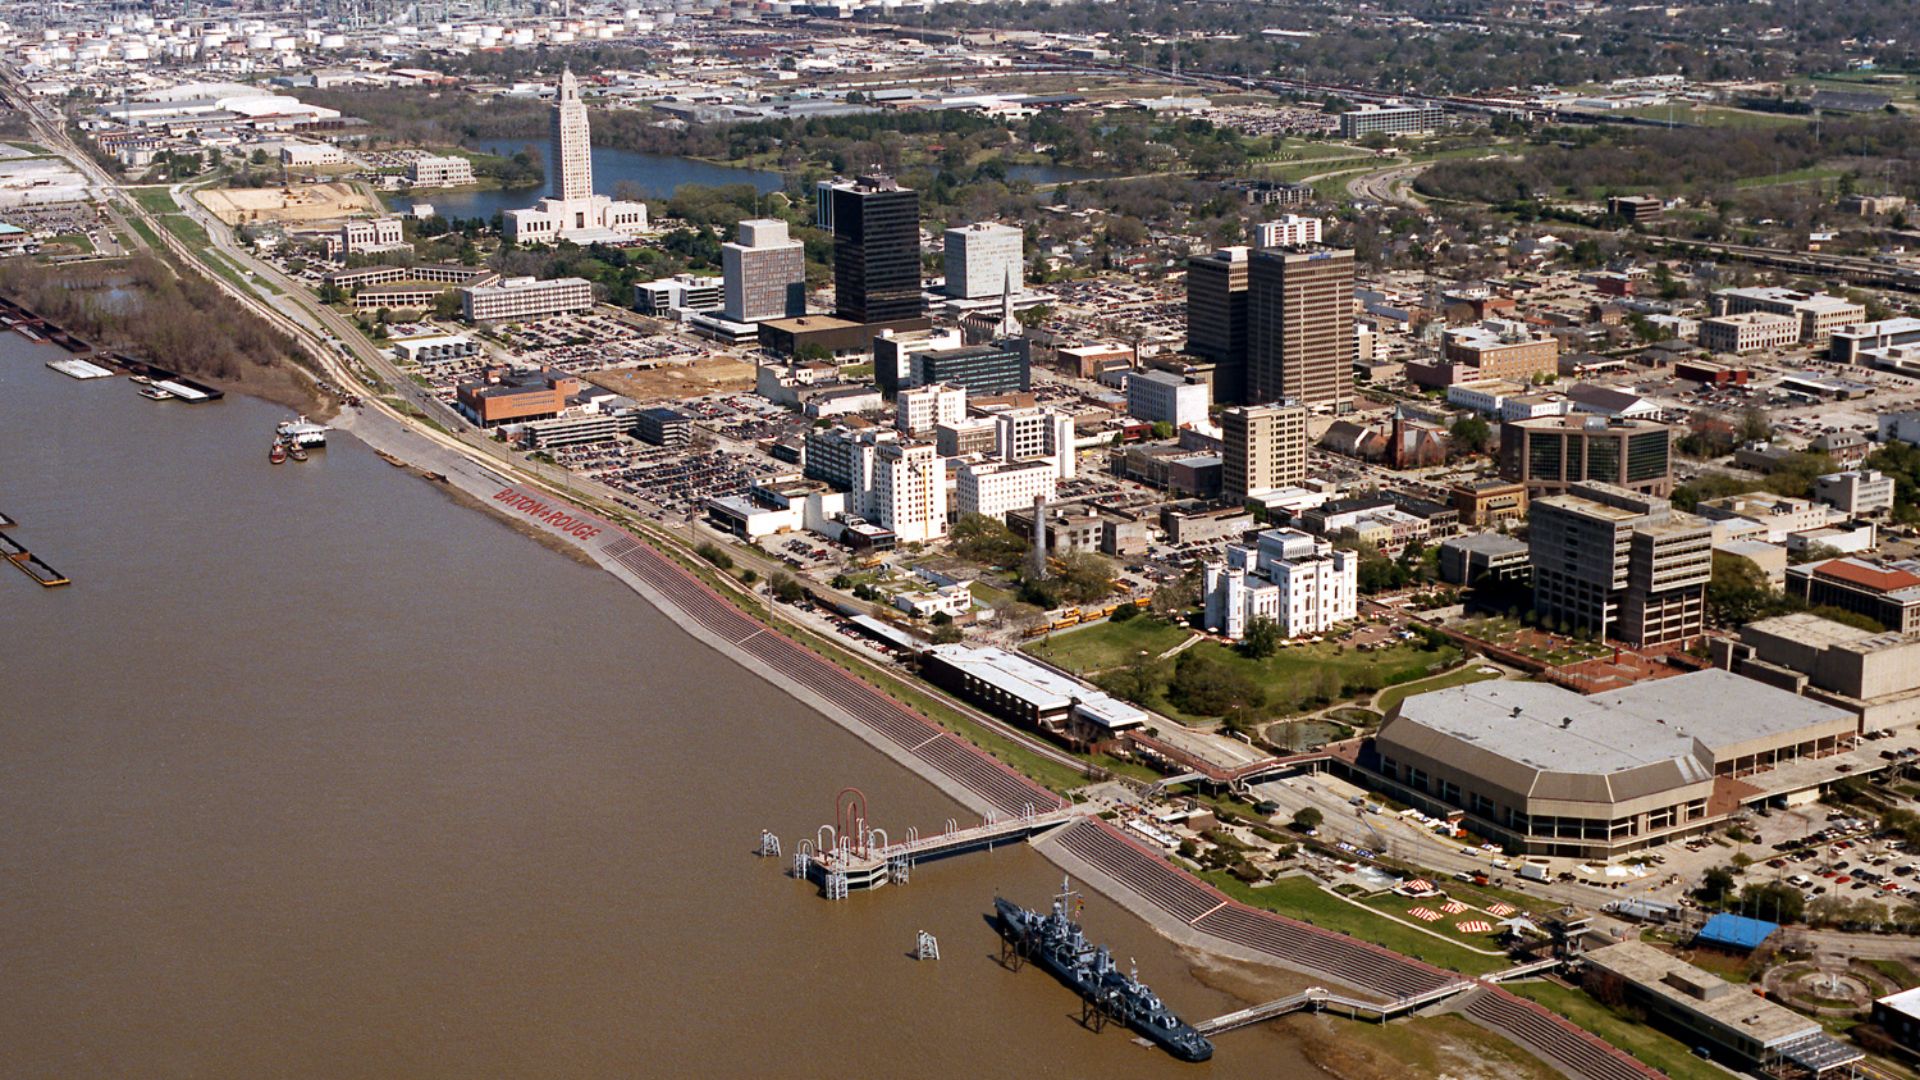 Michael Maples, U.S. Army Corps of Engineers, Wikimedia Commons
3: West Virginia
Jobs at automation/AI risk: High
Manufacturing share of jobs: ~6%
Bachelor’s+ adults: 23.3%
AI job demand/readiness: Very low
Low education levels and narrow industries heighten risk.
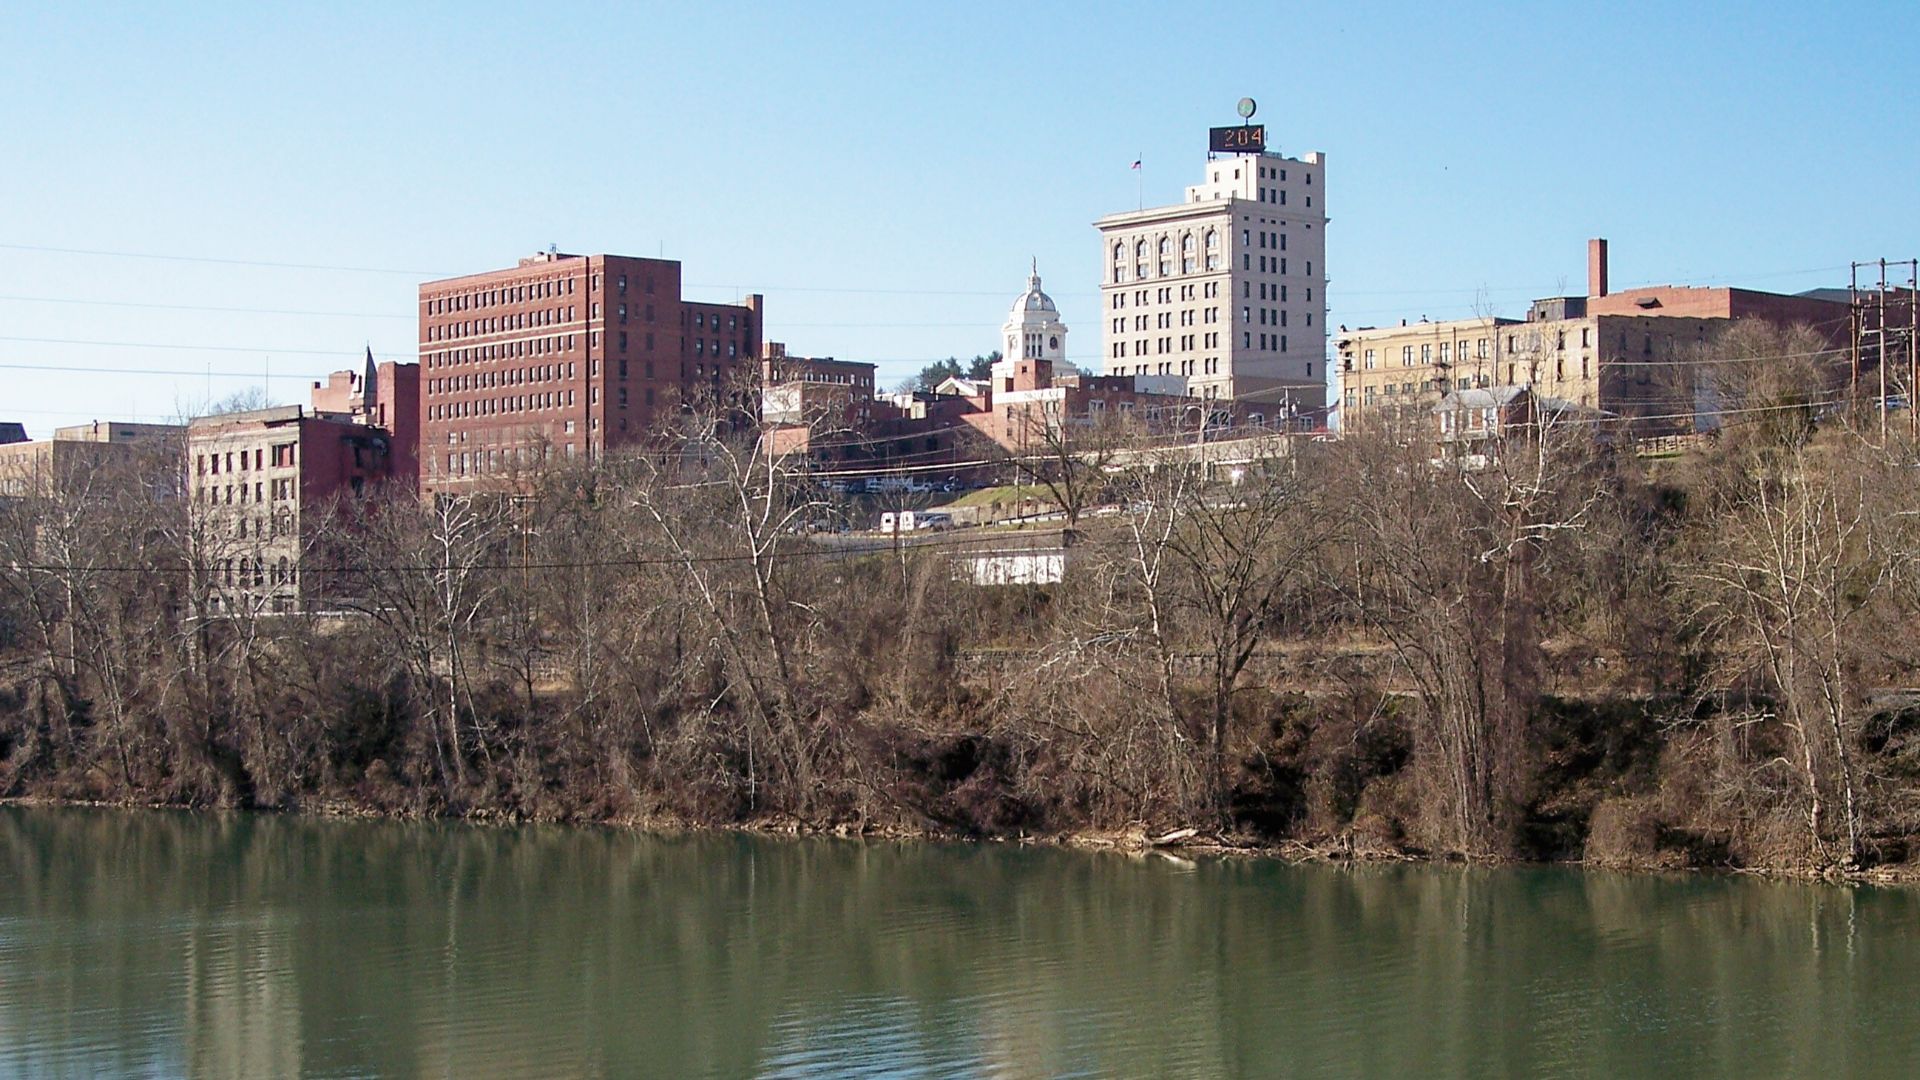 Tim Kiser (w:User:Malepheasant), Wikimedia Commons
2: Mississippi
Jobs at automation/AI risk: Just over 55%
Manufacturing share of jobs: ~7%
Bachelor’s+ adults: 24.2%
AI job demand/readiness: Low
Low degree attainment and high-risk jobs combine dangerously.
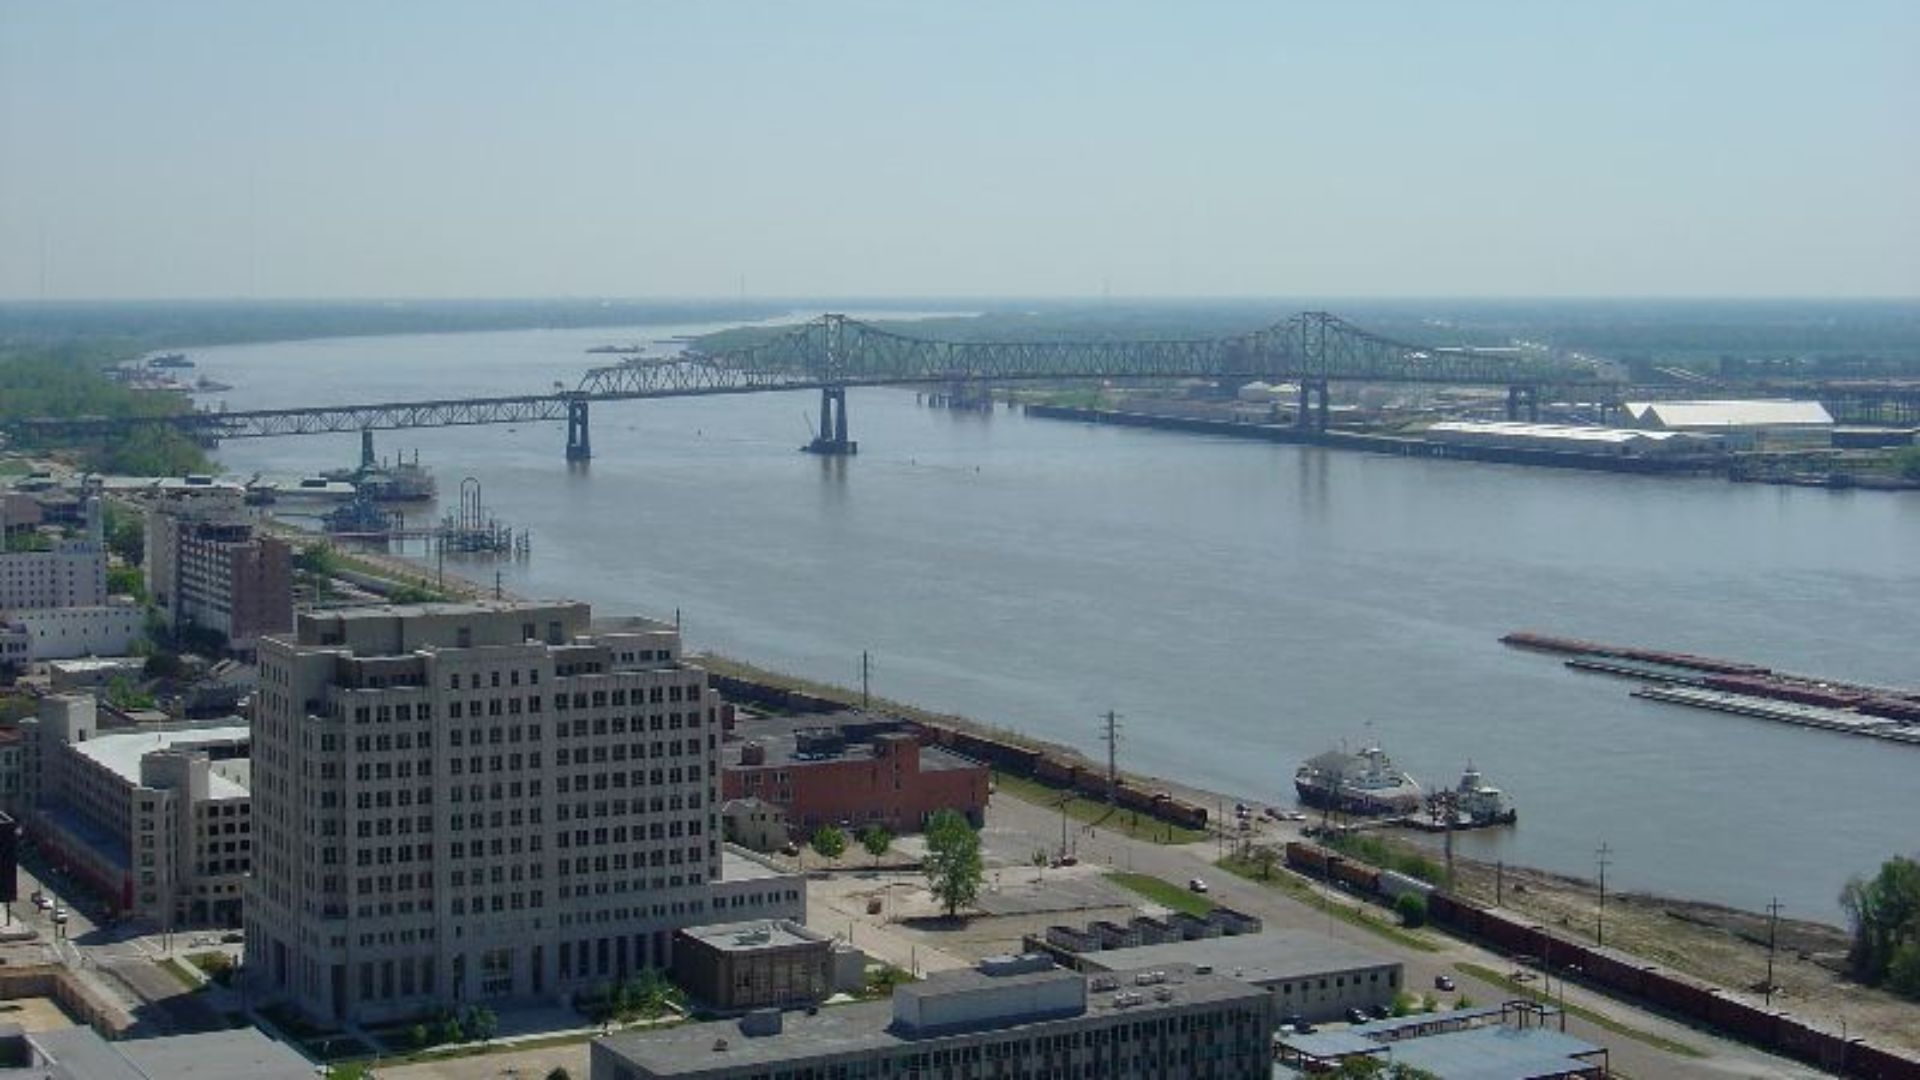
1: Nevada
Jobs at automation/AI risk: 59.16% (nearly 3 in 5 jobs)
Manufacturing share of jobs: ~4%
Bachelor’s+ adults: 27.4%
AI job demand/readiness: Moderate, centered in Reno/Las Vegas
Tourism and service jobs dominate, making Nevada the most exposed.
 Lasvegaslover, Wikimedia Commons
You Might Also Like:
The Most Dangerous Selfie Spots In The World
Ranking The States With The Worst Natural Disasters—According To Data
The States With The Worst Roads—Ranked According To Data (And Drivers)