
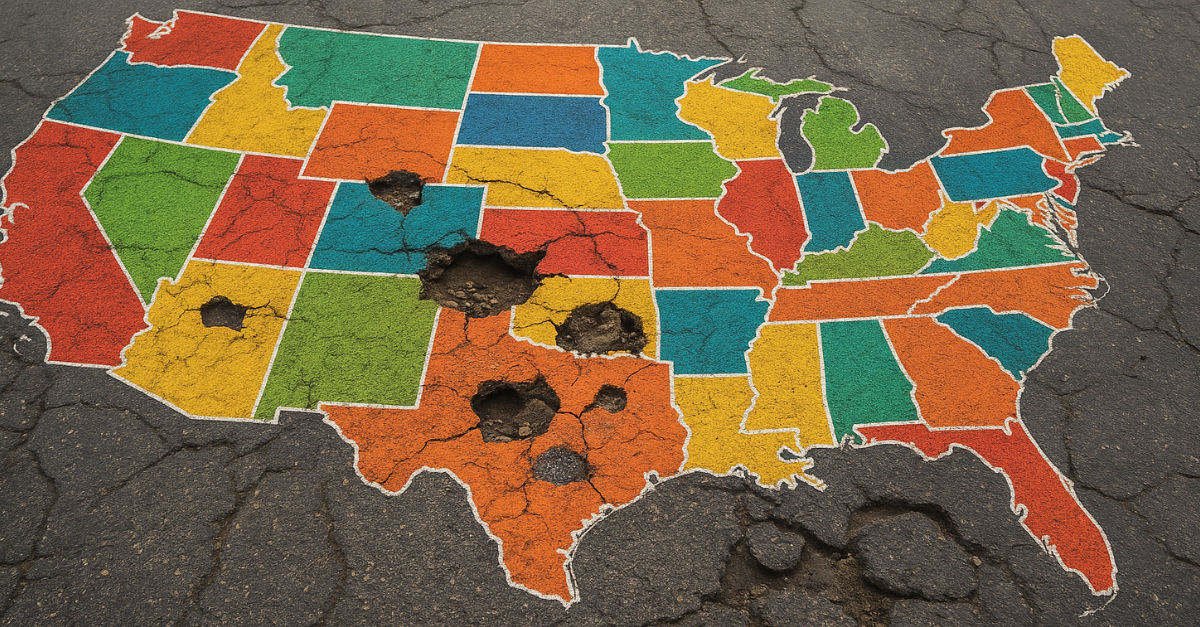
Potholed Paradise: Ranking America's Road Woes
From scenic highways to suspension-testing potholes, not all roads are created equal.
We ranked all 50 U.S. states (and Washington D.C.) based on road quality, spending, driver satisfaction, bridge safety, and commute efficiency—giving each state an overall score based on weighted data.
Data comes from federal and state transportation agencies, construction reports, and driver surveys—so you’re not just hearing it from the experts, but from the folks dodging the potholes, too.
Get ready to see how your state stacks up! Starting with the best (we saved the worst for last in this case).

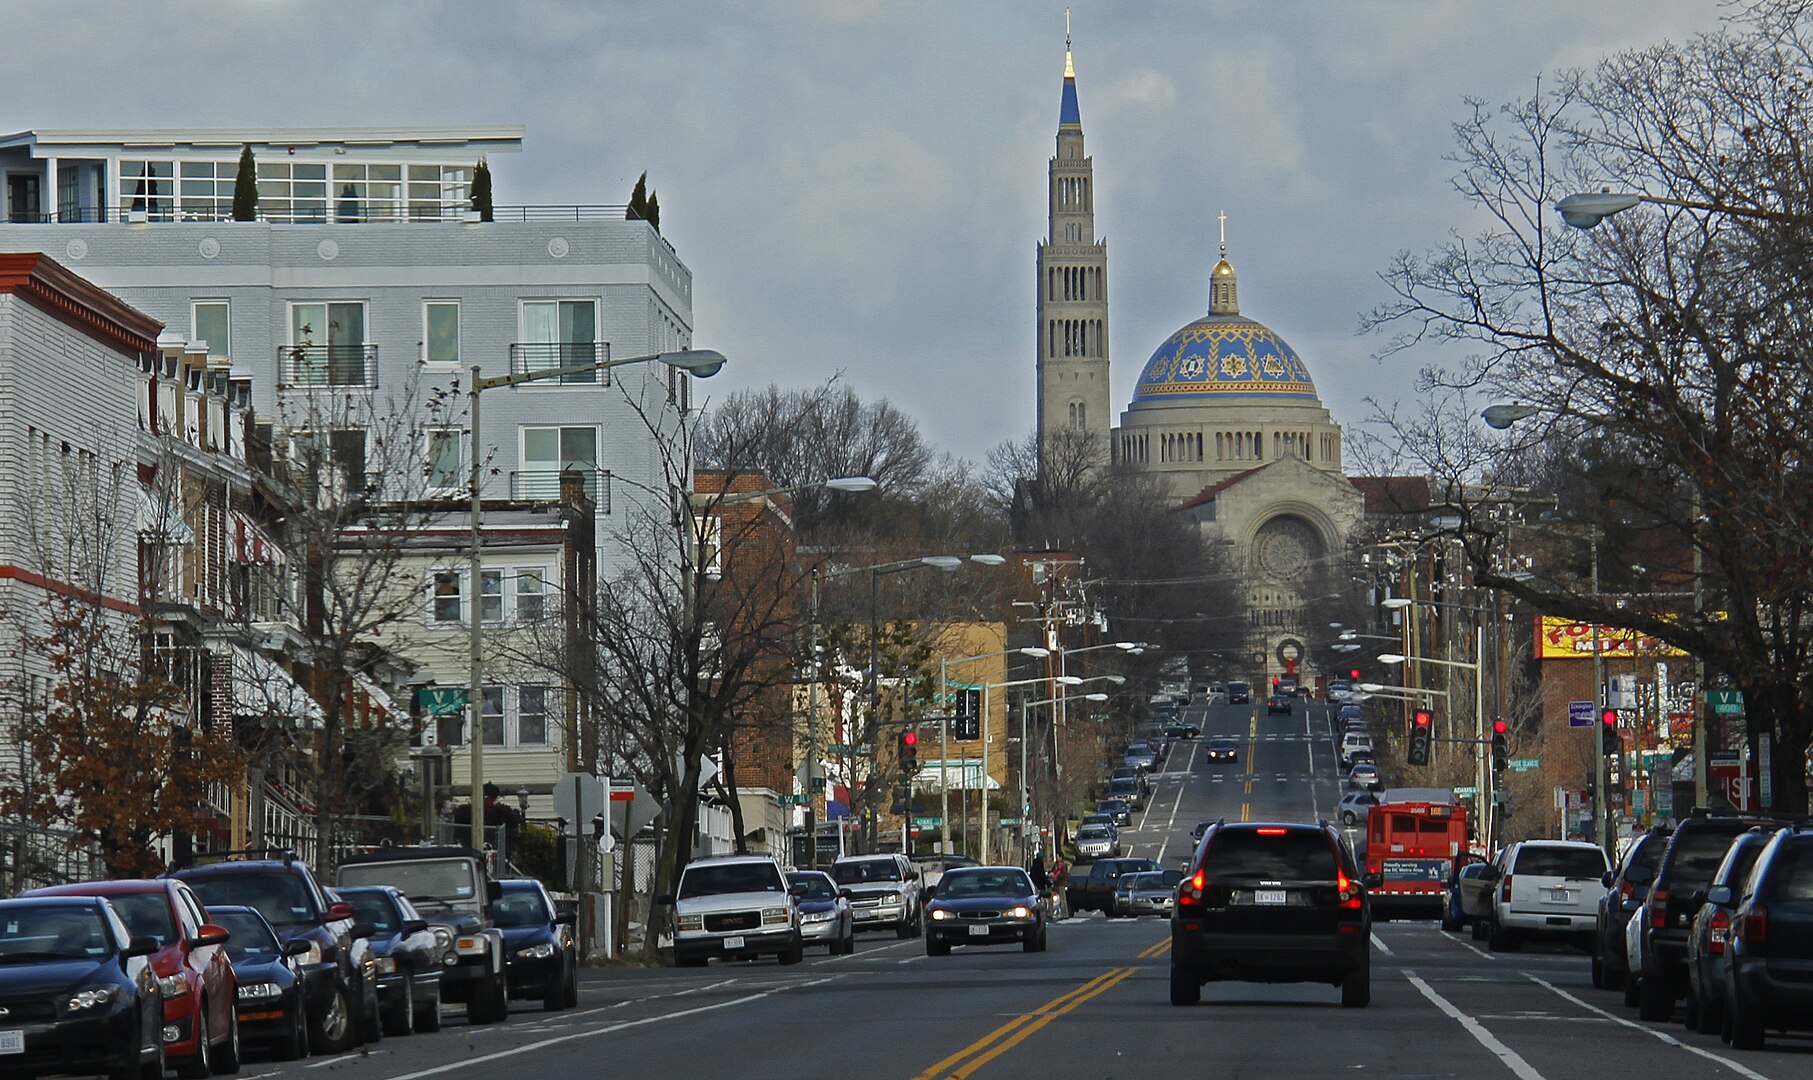
1: Washington D.C.
Overall score: 0.888
Percent of roads in poor condition: 6%
Annual spending per mile: $80,774
Driver satisfaction rating: 8.0/10
Bridge safety score: 92/100
Average commute delay: 4.1 minutes

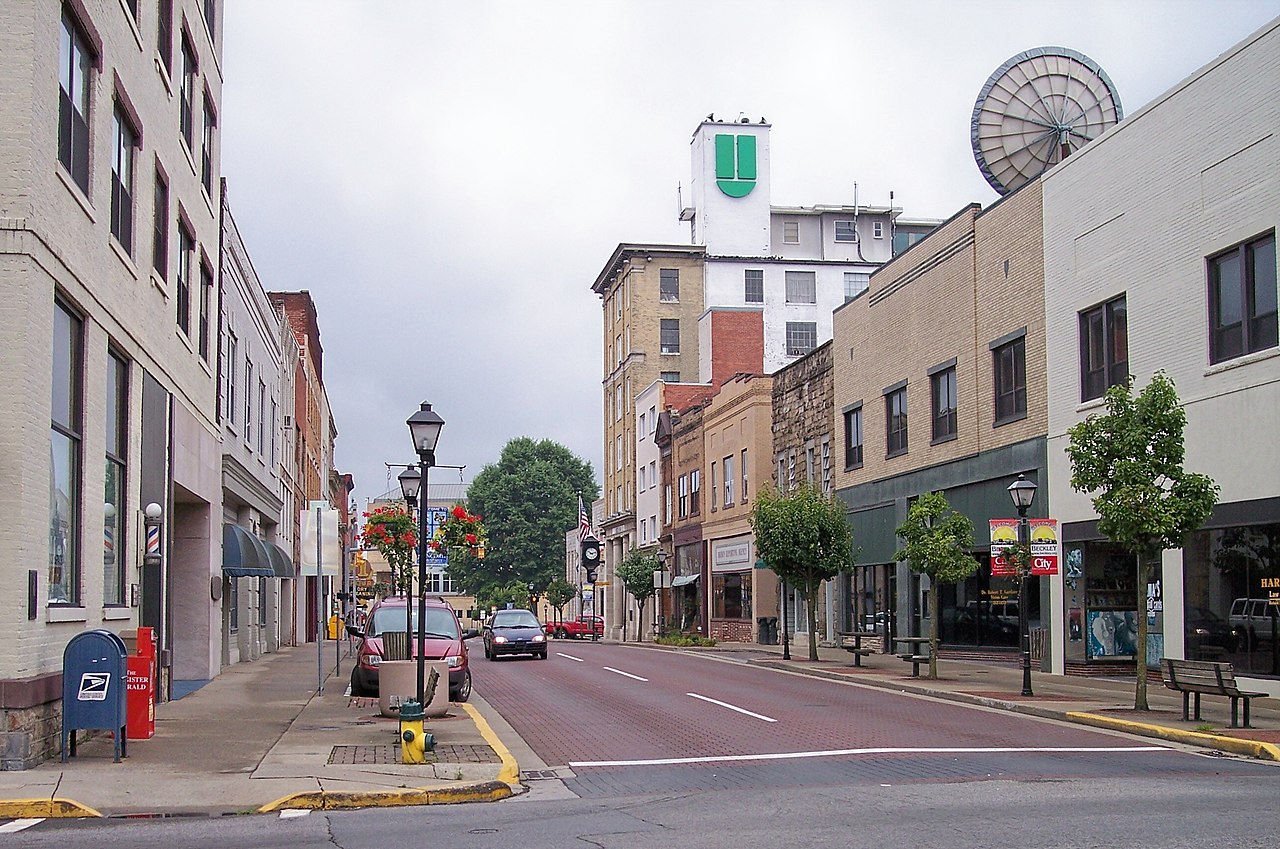
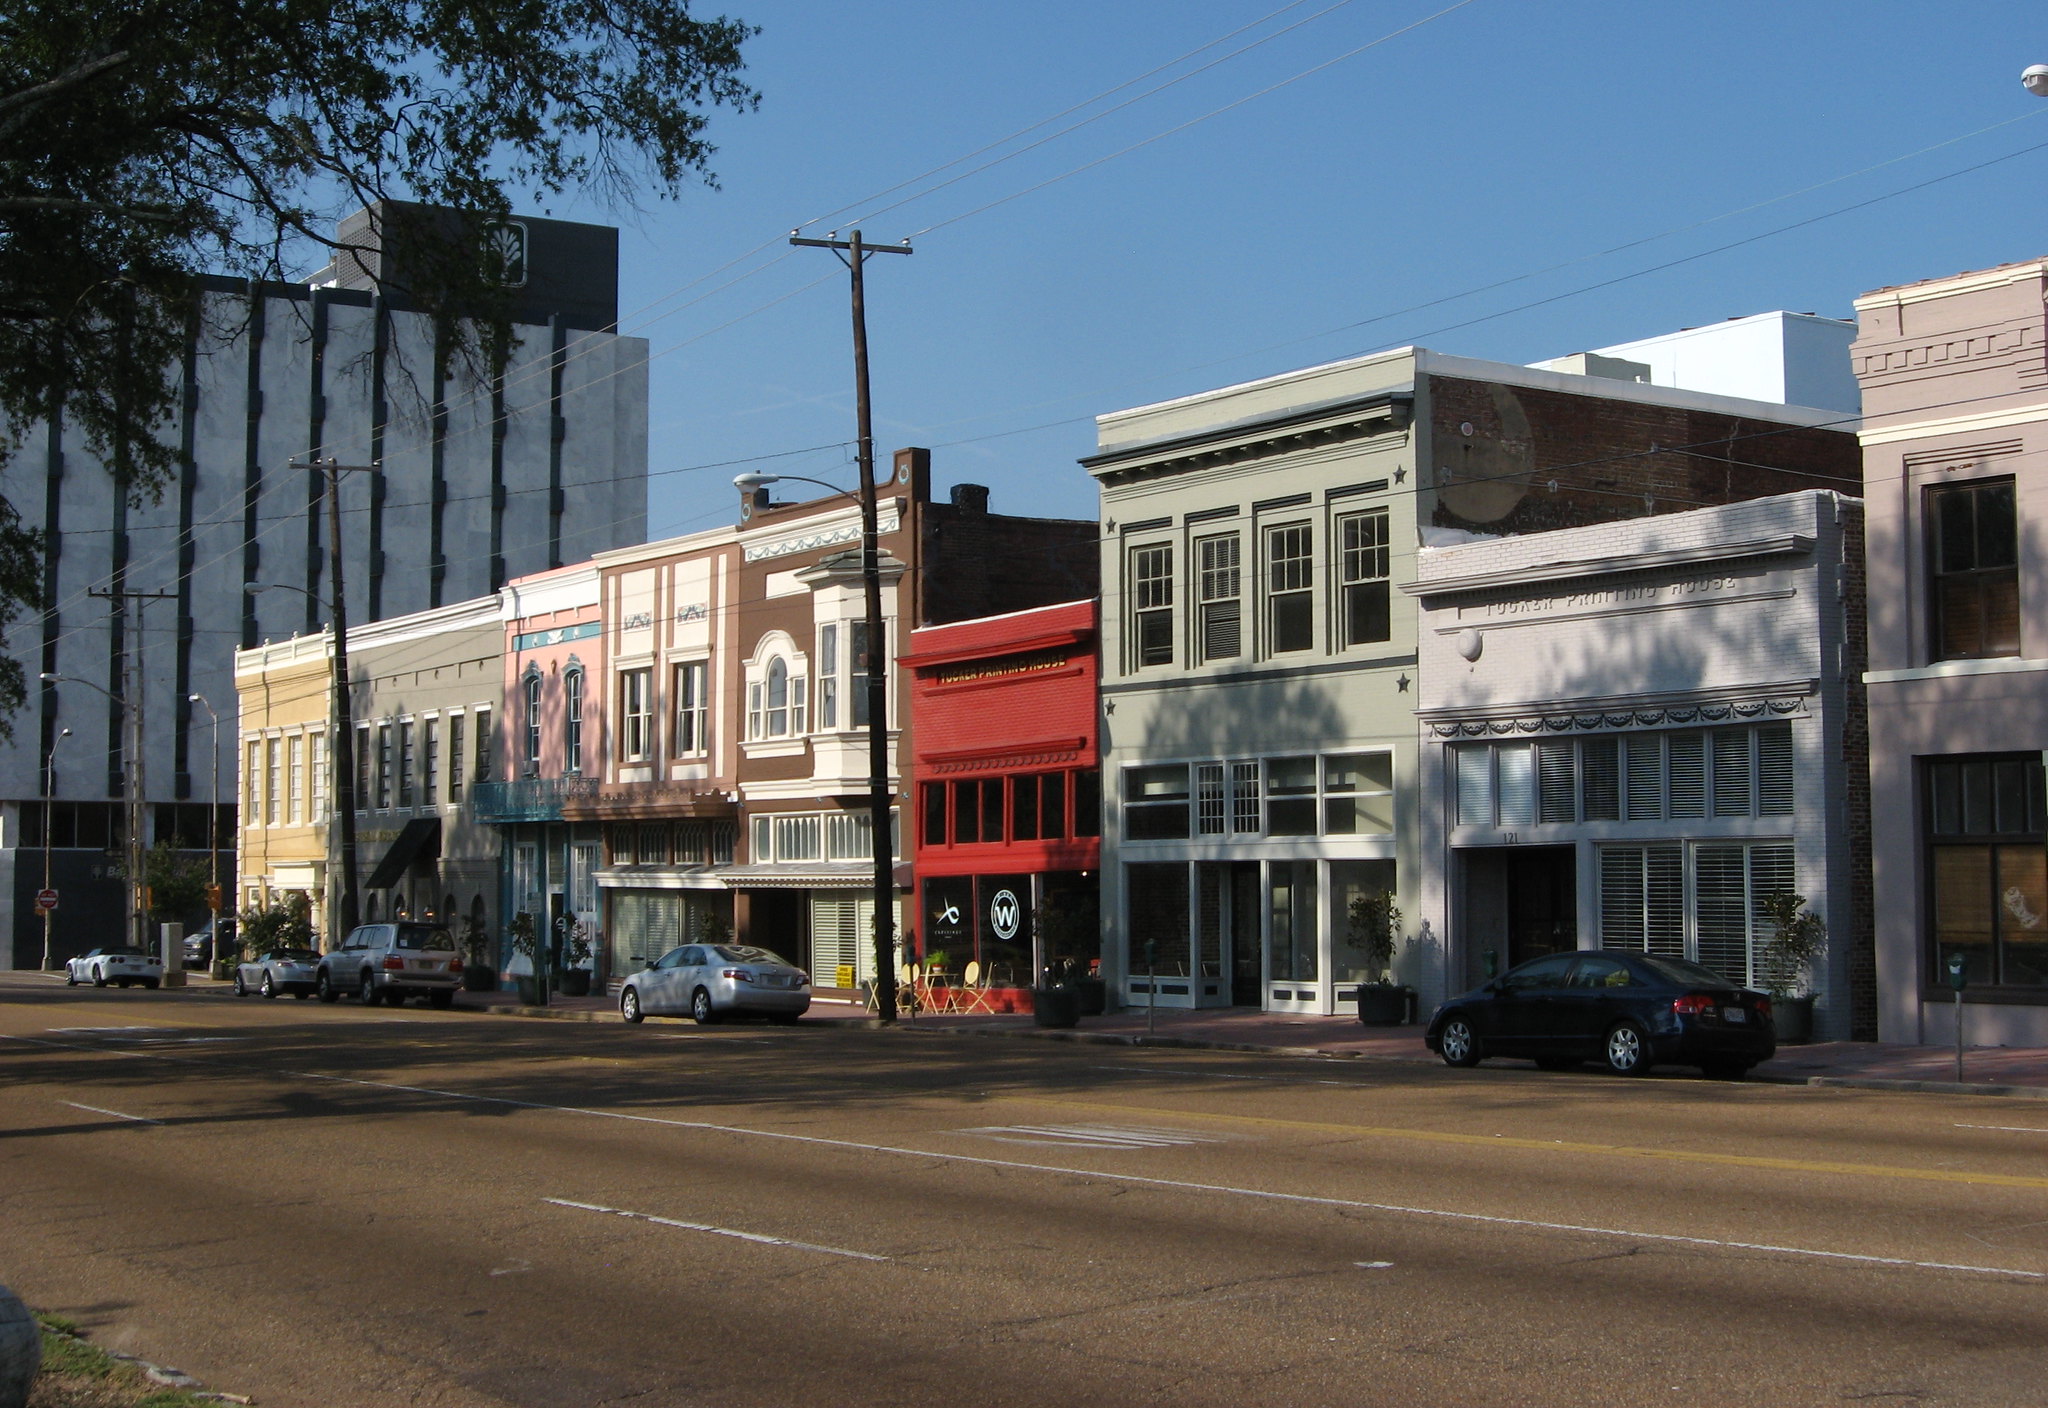
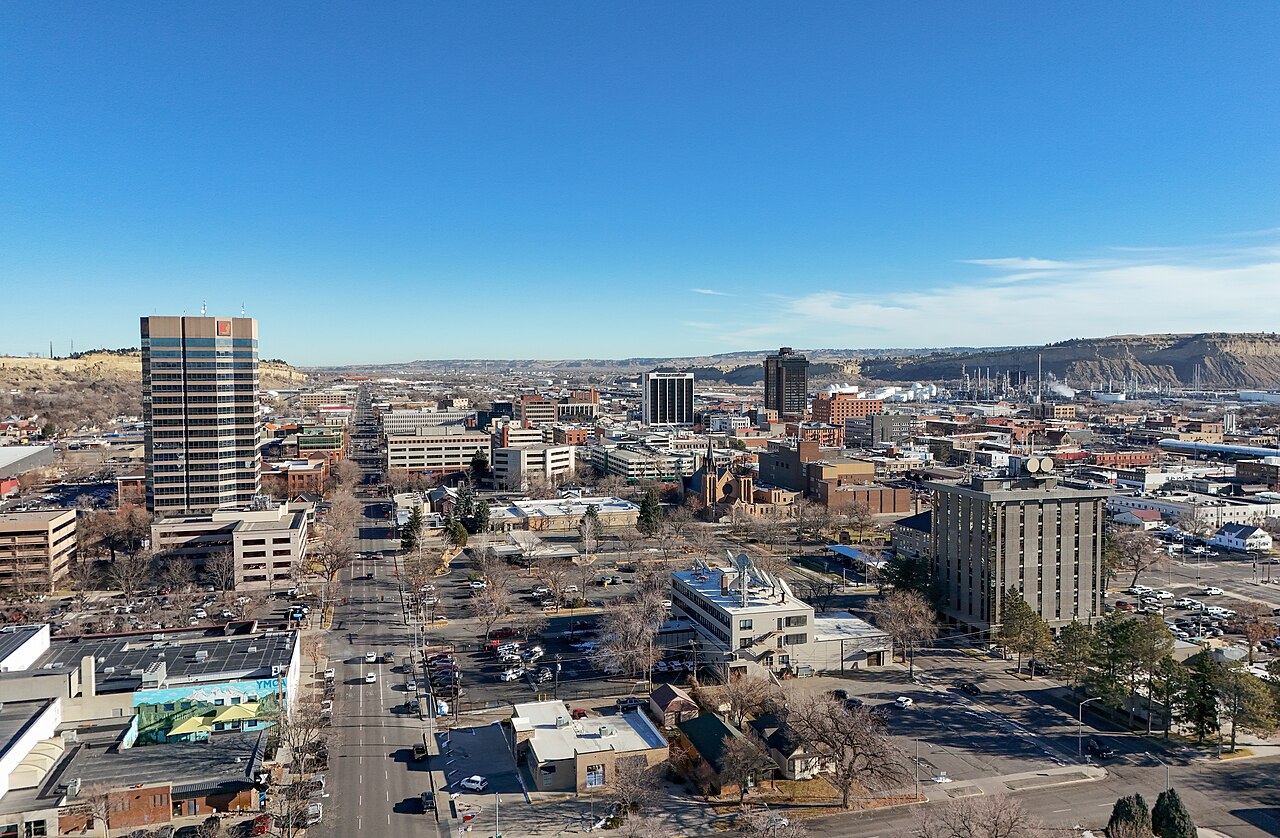
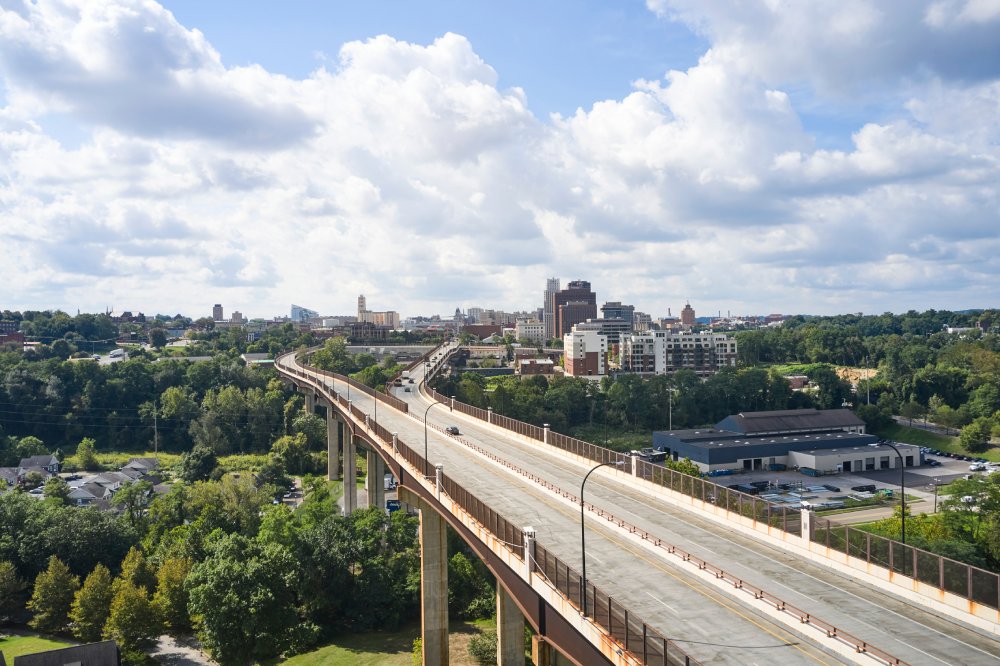
2: West Virginia
Overall score: 0.809
Percent of roads in poor condition: 13%
Annual spending per mile: $89,216
Driver satisfaction rating: 5.0/10
Bridge safety score: 65/100
Average commute delay: 5.6 minutes
 Tim Kiser (Malepheasant), CC BY-SA 3.0, Wikimedia Commons
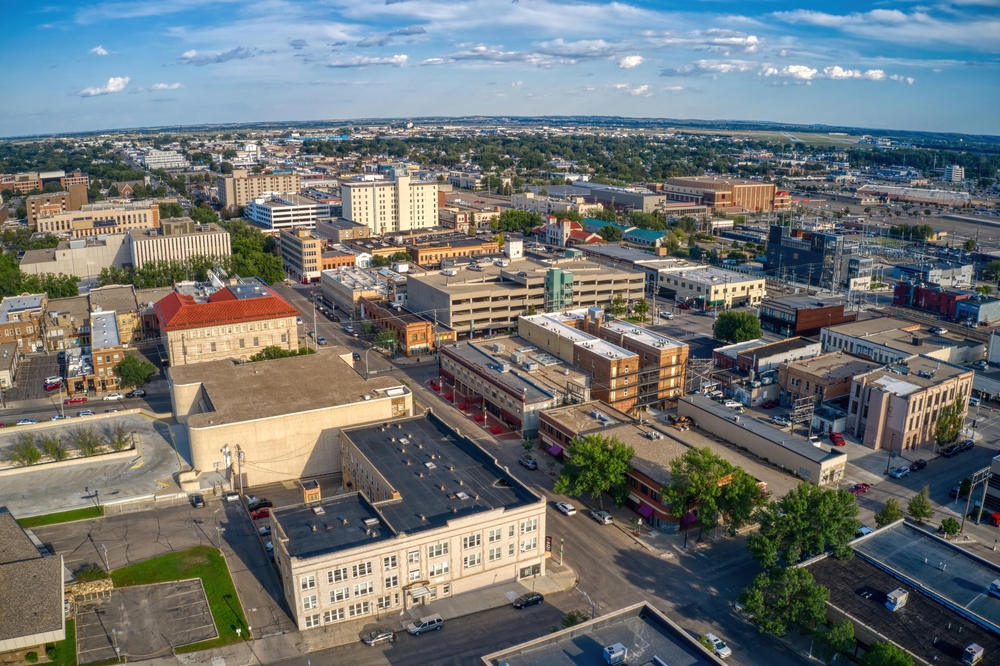
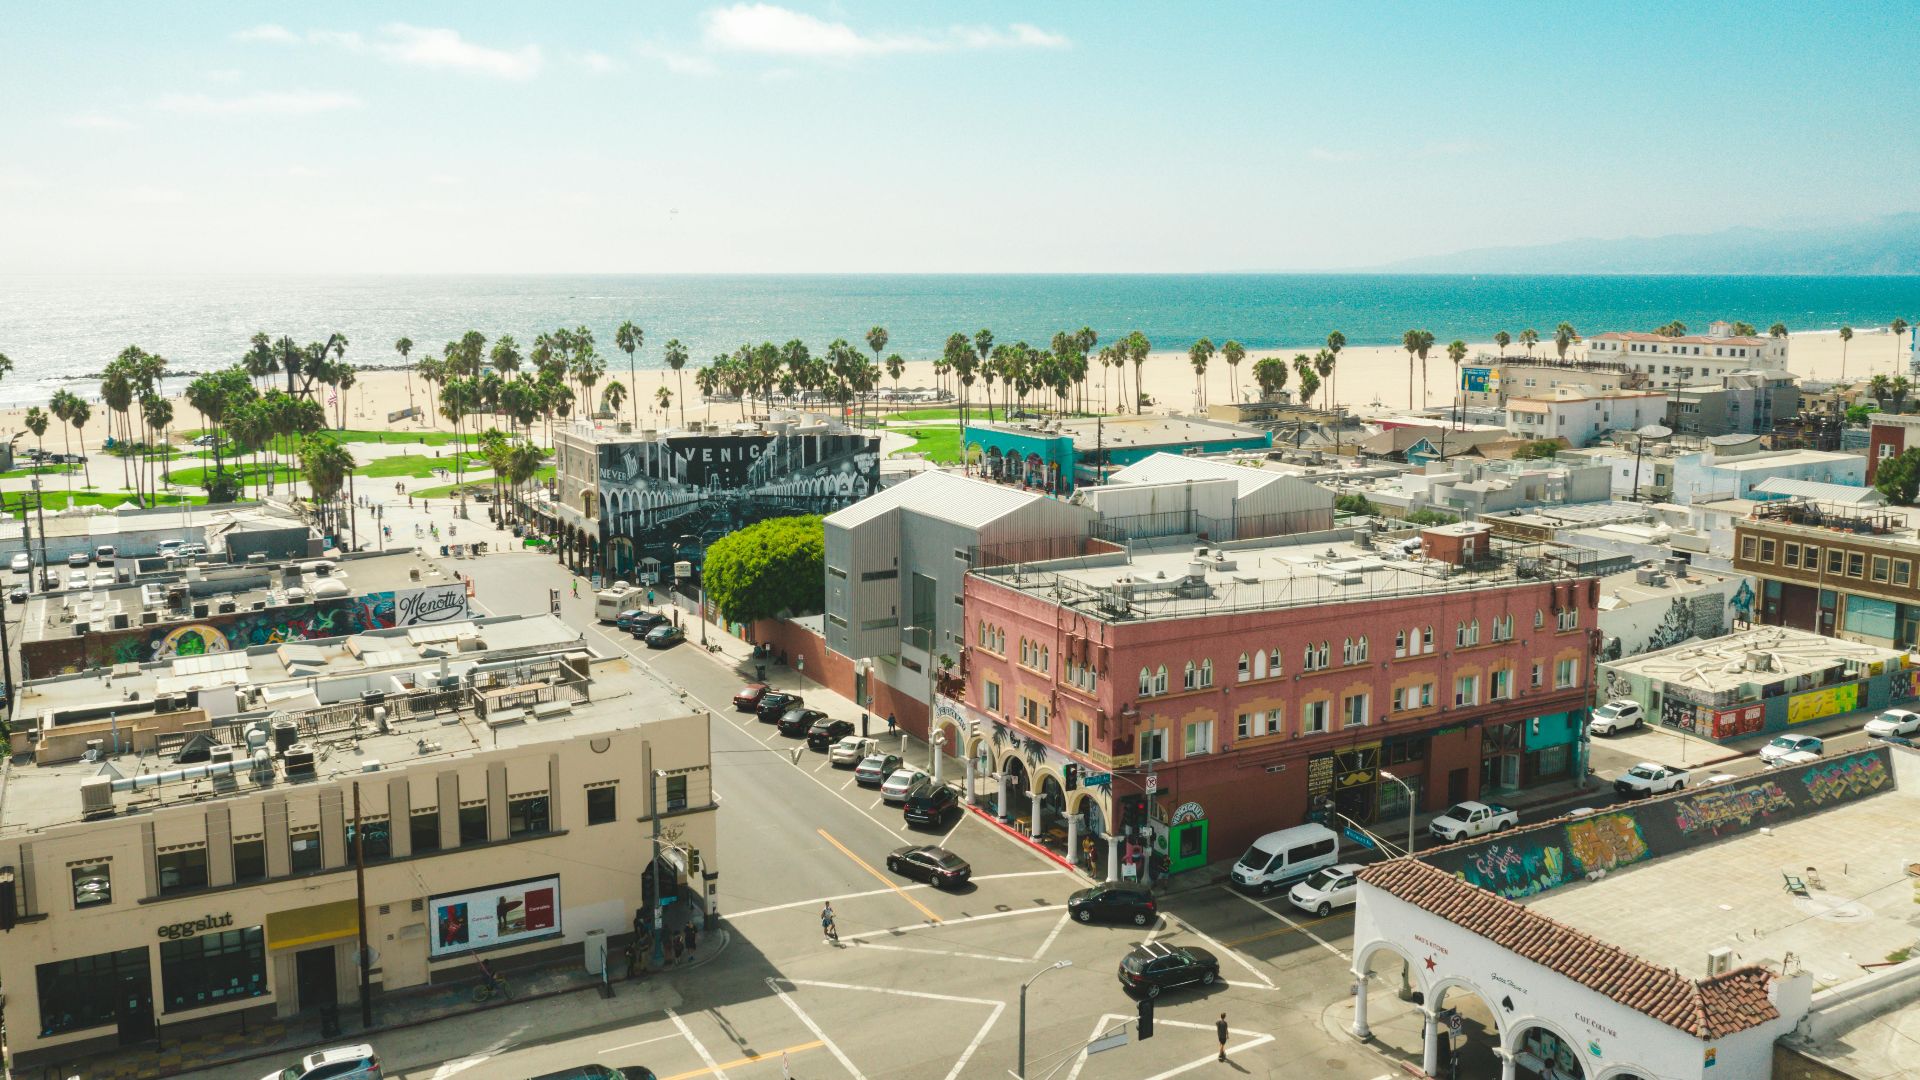
3: Washington
Overall score: 0.782
Percent of roads in poor condition: 28%
Annual spending per mile: $83,573
Driver satisfaction rating: 7.0/10
Bridge safety score: 87/100
Average commute delay: 6.8 minutes
 David, CC BY 2.0, Wikimedia Commons
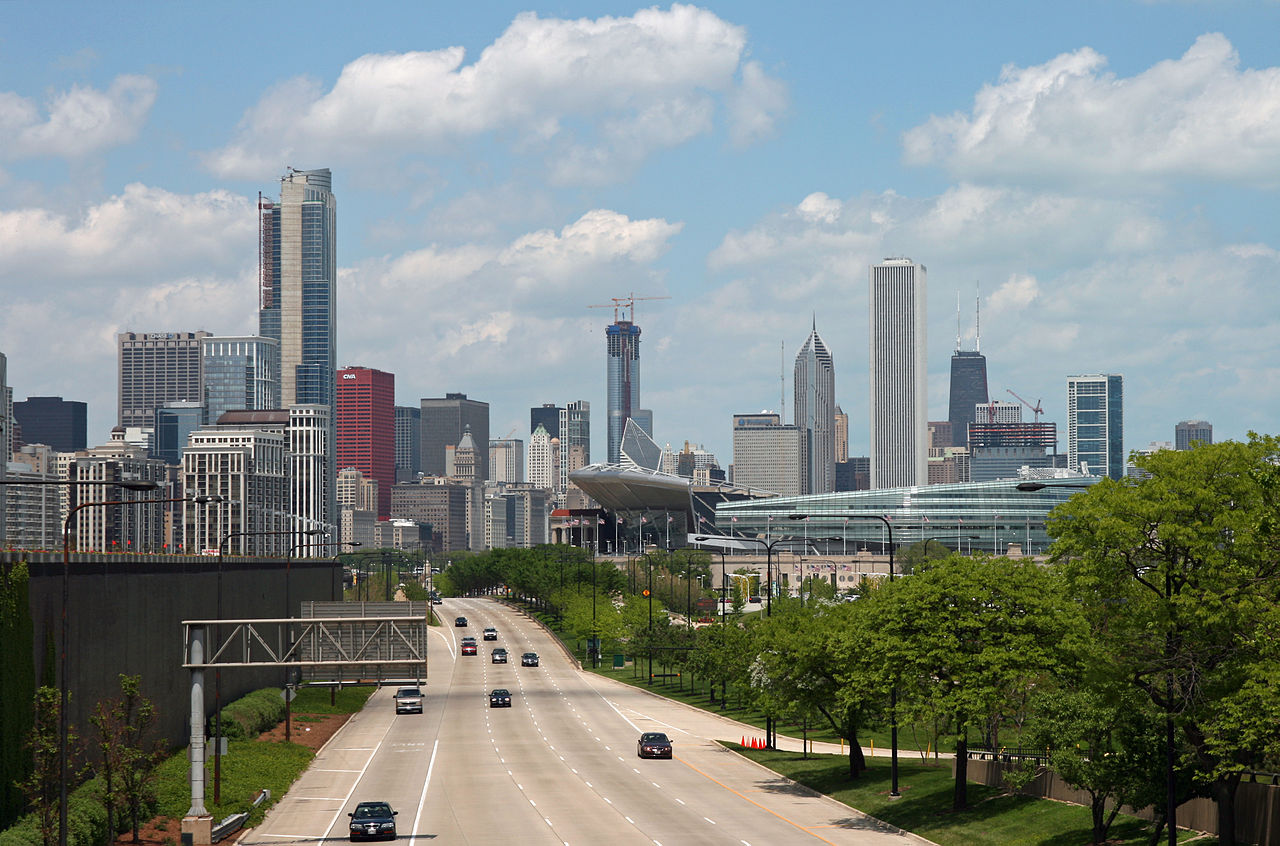
4: New York
Overall score: 0.777
Percent of roads in poor condition: 22%
Annual spending per mile: $79,099
Driver satisfaction rating: 6.8/10
Bridge safety score: 86/100
Average commute delay: 6.6 minutes

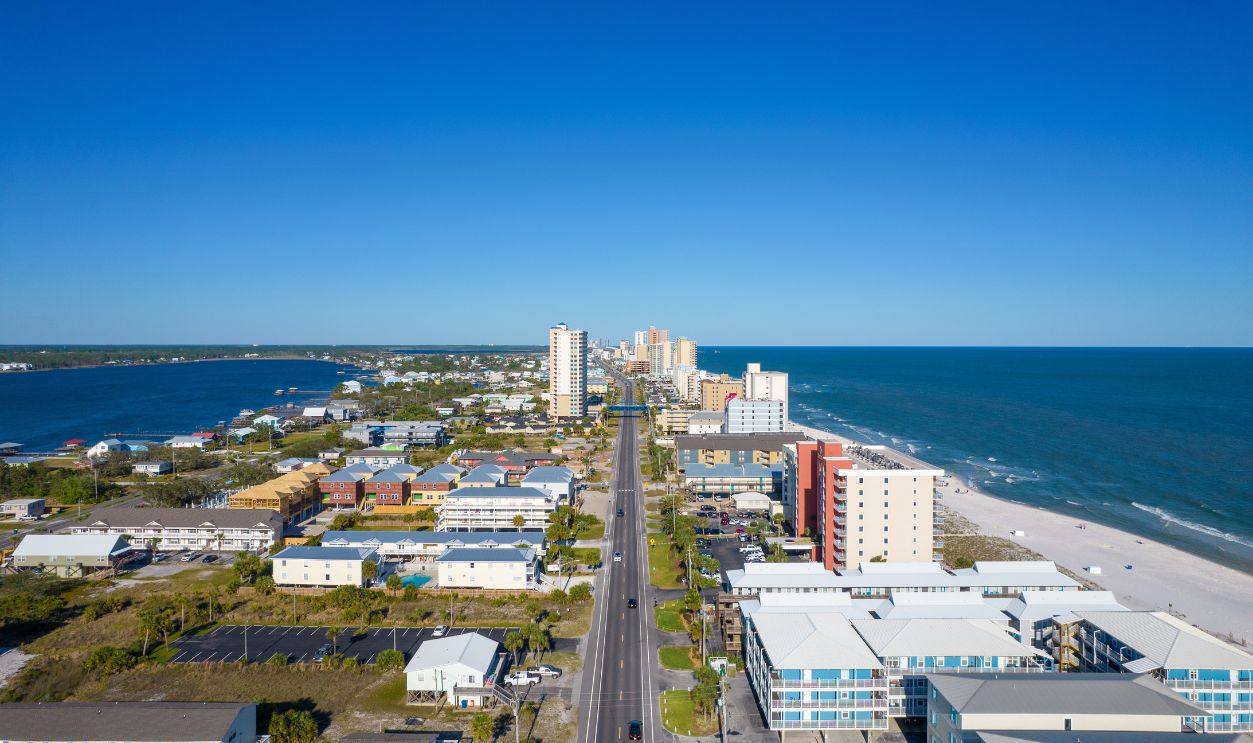
5: Louisiana
Overall score: 0.760
Percent of roads in poor condition: 18%
Annual spending per mile: $78,044
Driver satisfaction rating: 6.1/10
Bridge safety score: 58/100
Average commute delay: 4.1 minutes
 Spatms, CC BY-SA 4.0, Wikimedia Commons
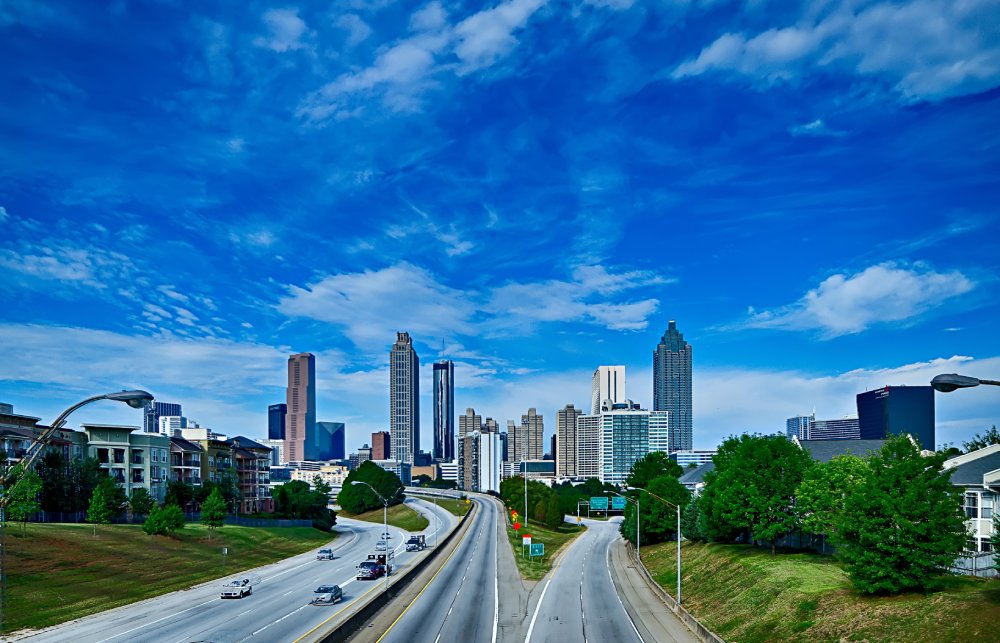
6: Georgia
Overall score: 0.760
Percent of roads in poor condition: 12%
Annual spending per mile: $80,994
Driver satisfaction rating: 7.6/10
Bridge safety score: 81/100
Average commute delay: 17.4 minutes
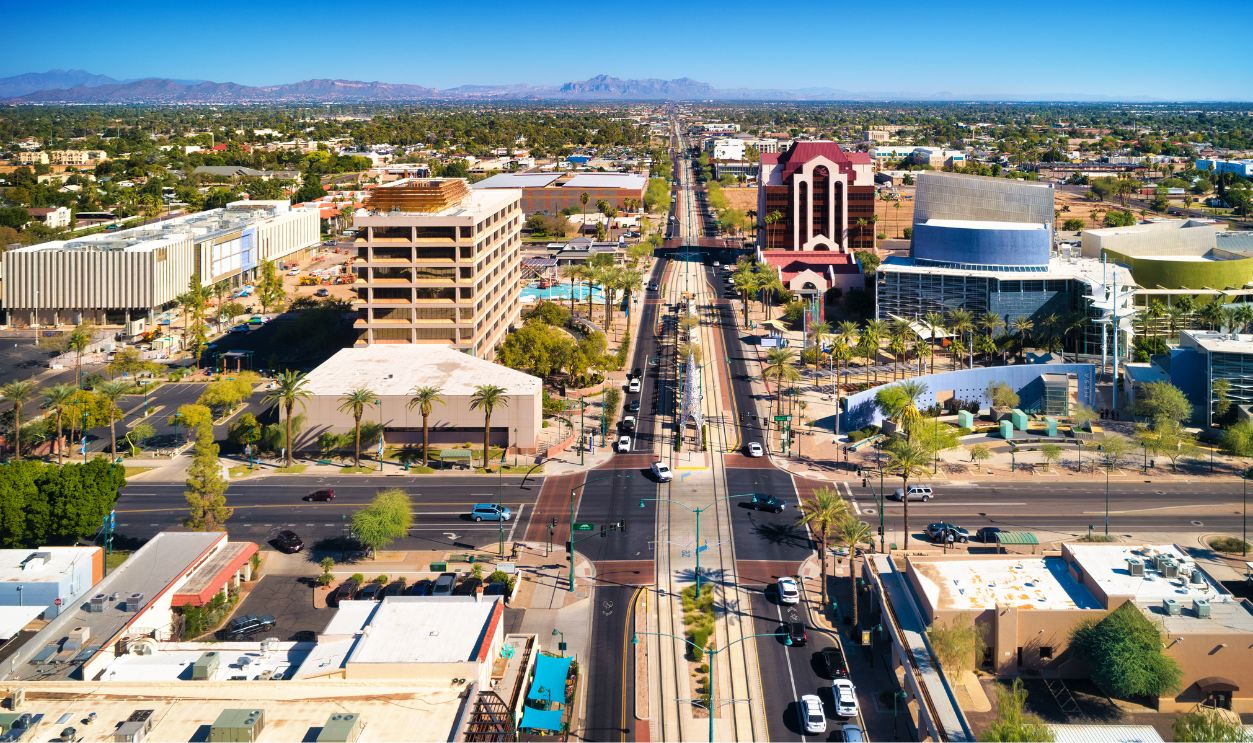
7: Arizona
Overall score: 0.753
Percent of roads in poor condition: 28%
Annual spending per mile: $85,758
Driver satisfaction rating: 5.7/10
Bridge safety score: 69/100
Average commute delay: 6.2 minutes
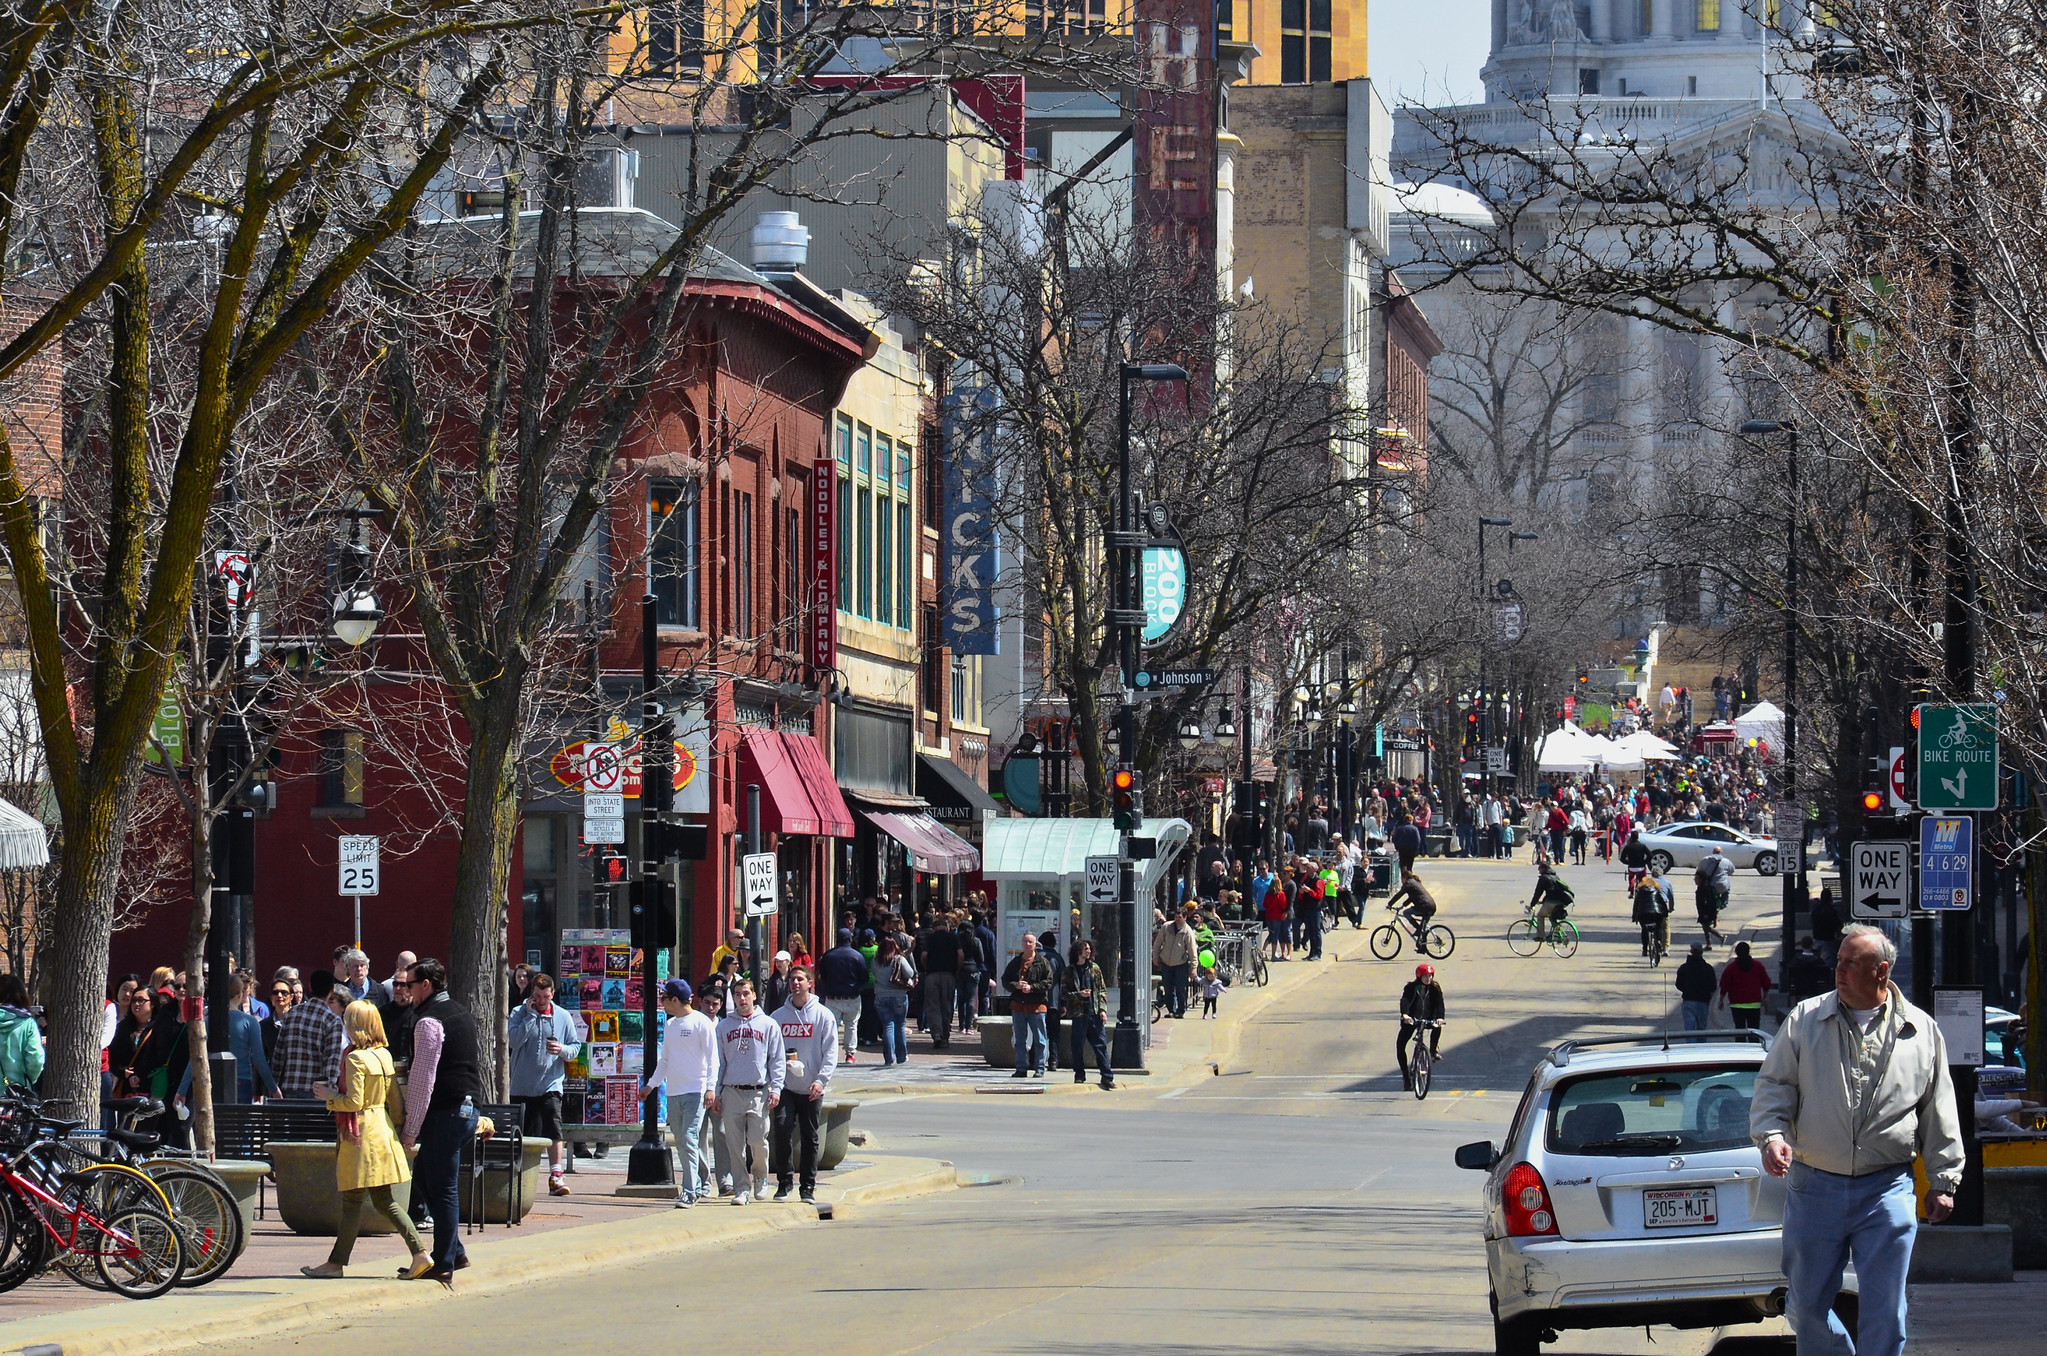
8: Wisconsin
Overall score: 0.727
Percent of roads in poor condition: 26%
Annual spending per mile: $80,757
Driver satisfaction rating: 5.2/10
Bridge safety score: 98/100
Average commute delay: 10.2 minutes
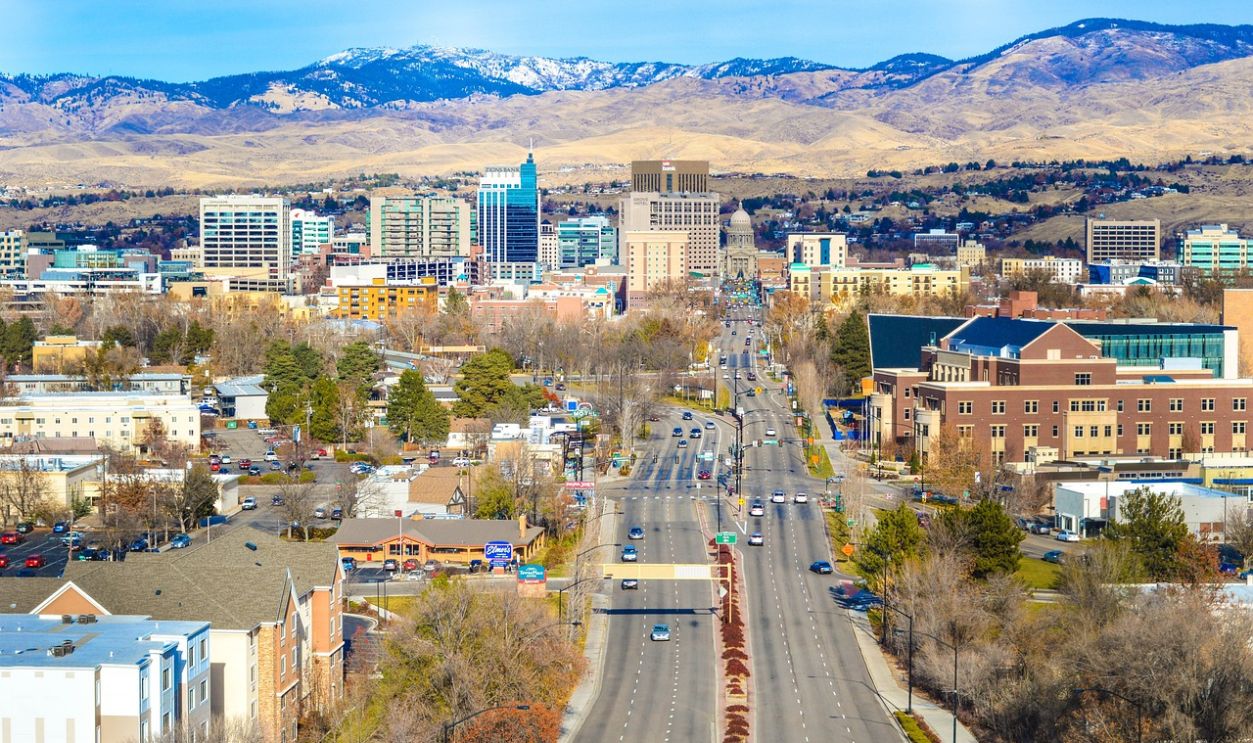
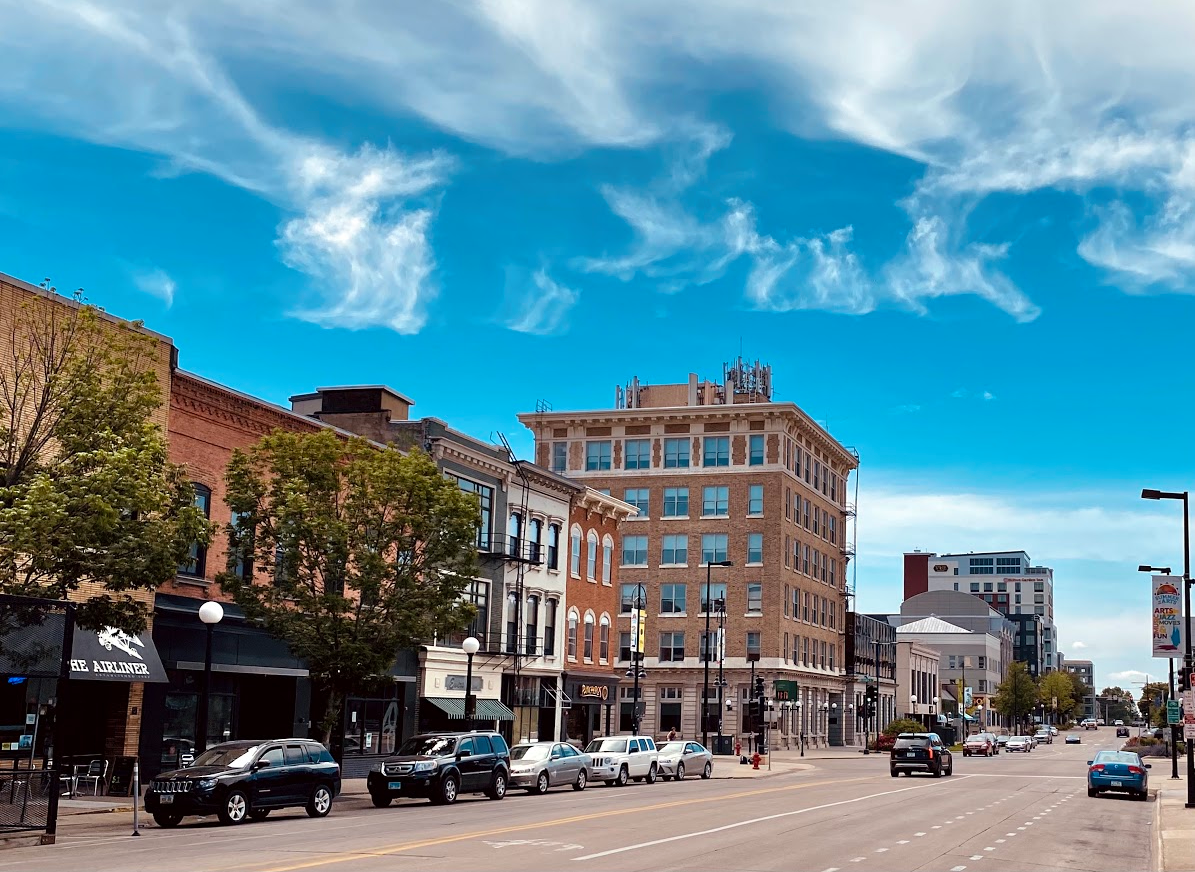
9: Idaho
Overall score: 0.721
Percent of roads in poor condition: 43%
Annual spending per mile: $75,920
Driver satisfaction rating: 8.2/10
Bridge safety score: 95/100
Average commute delay: 7.0 minutes
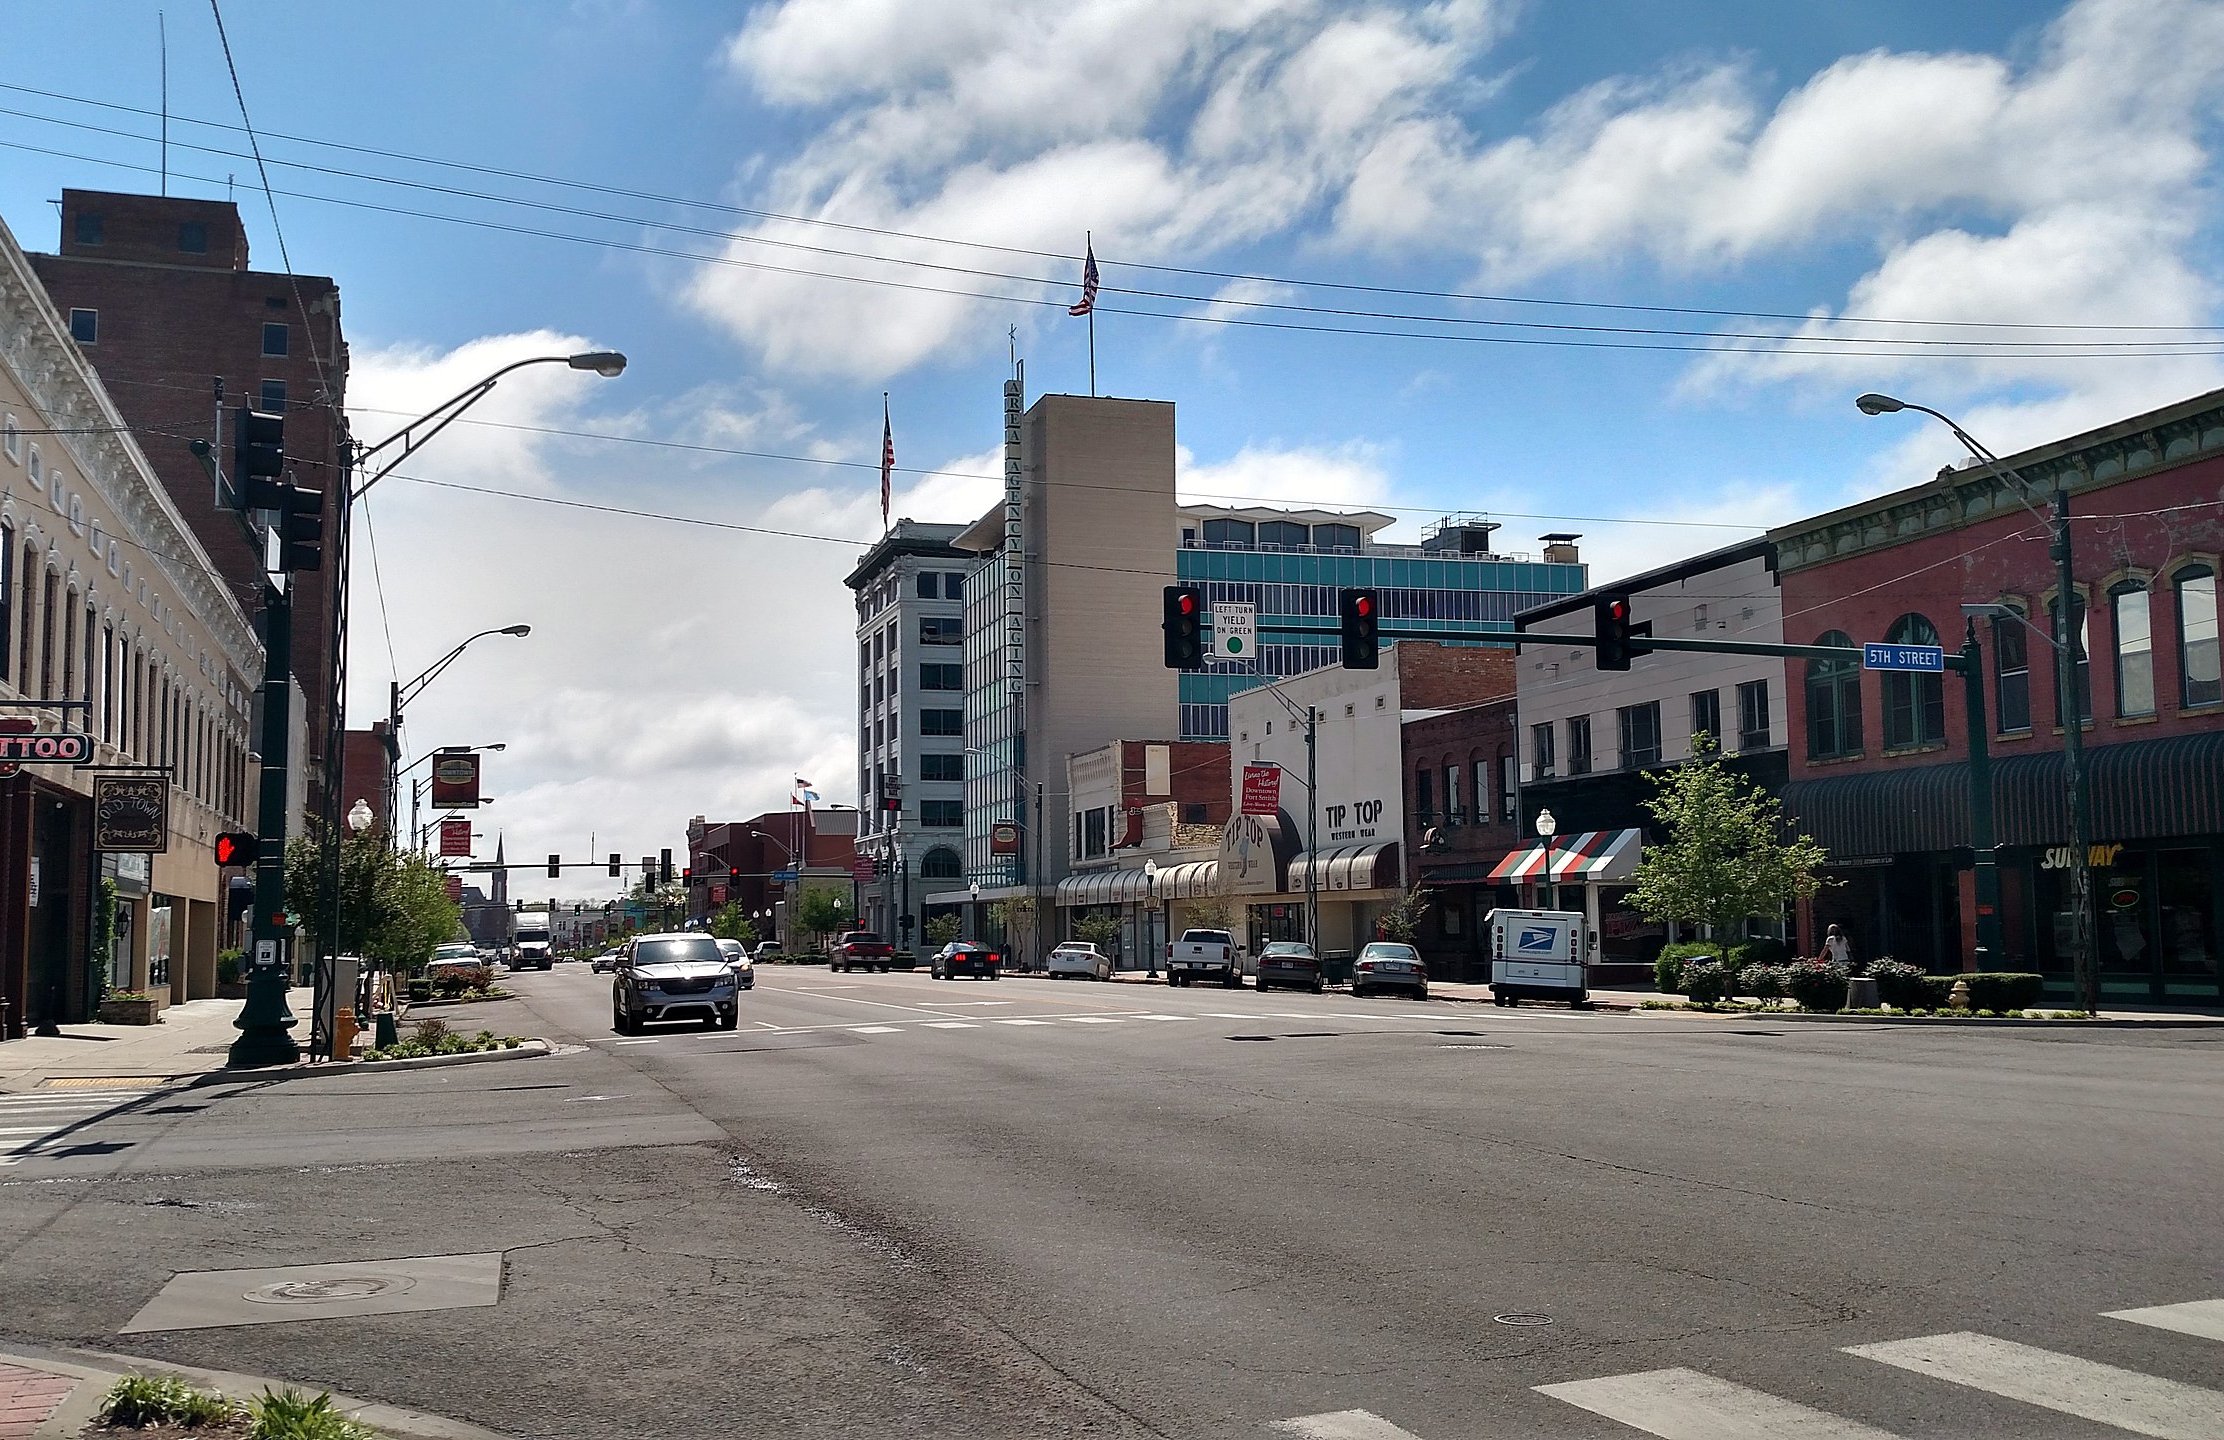
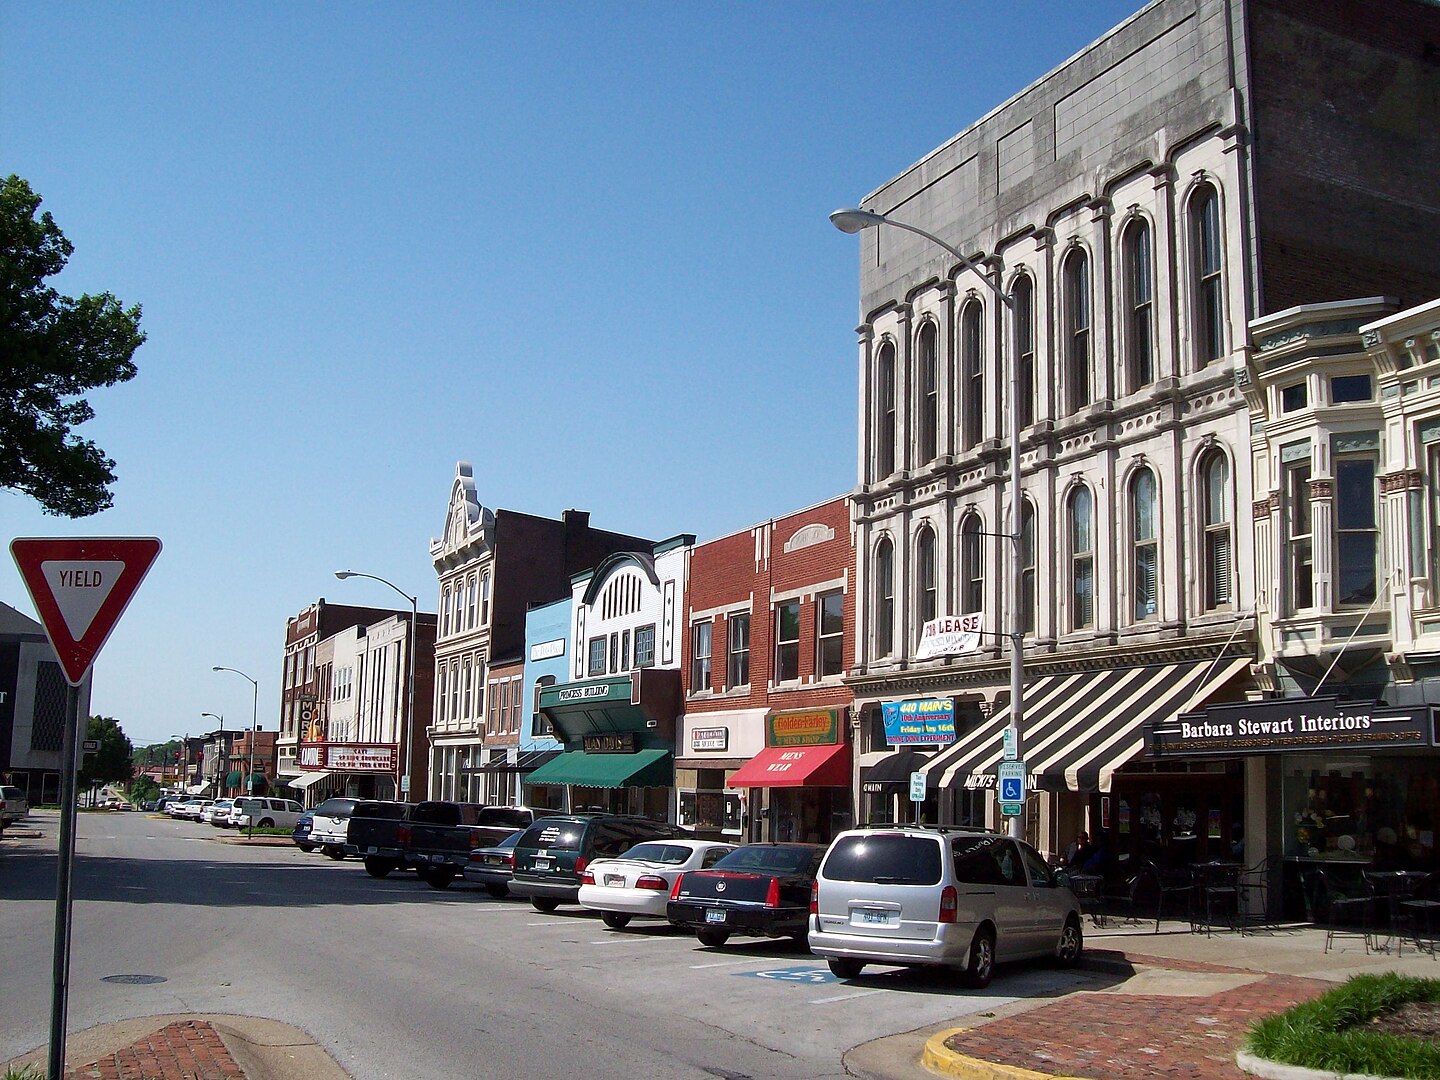
10: Arkansas
Overall score: 0.721
Percent of roads in poor condition: 6%
Annual spending per mile: $77,065
Driver satisfaction rating: 5.1/10
Bridge safety score: 95/100
Average commute delay: 18.0 minutes
 Brandonrush, CC BY-SA 4.0, Wikimedia Commons
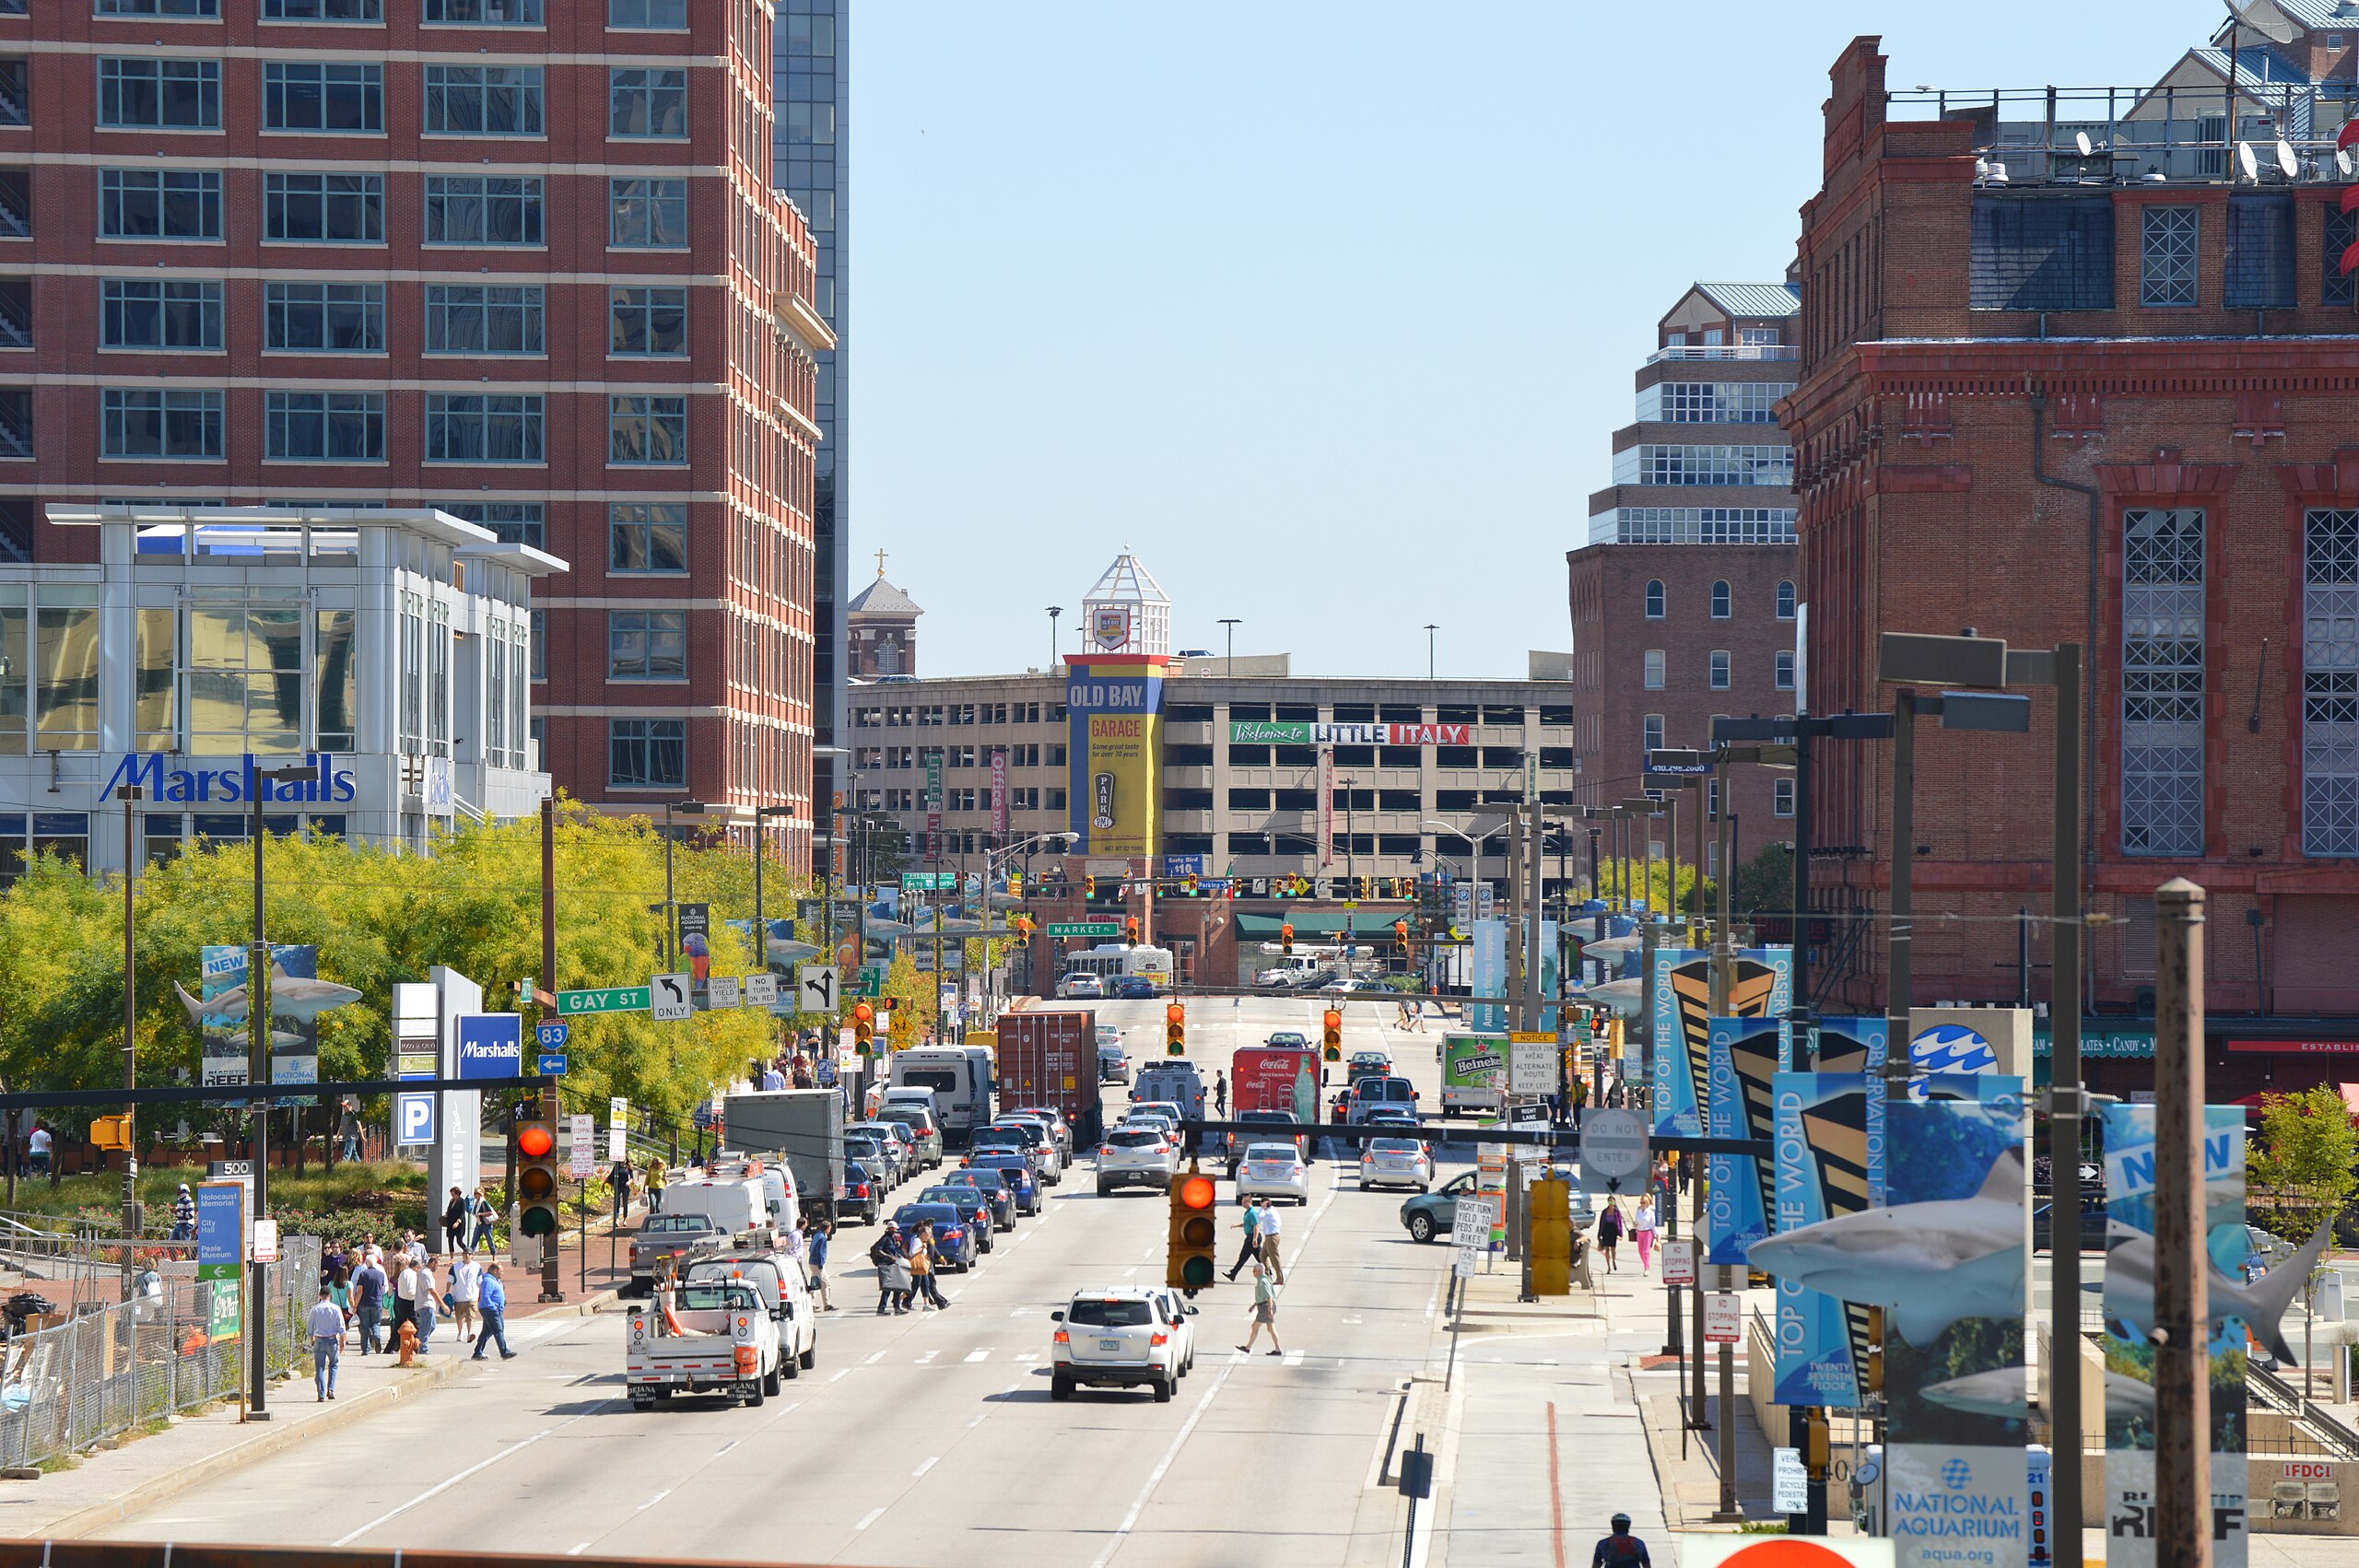
11: Maryland
Overall score: 0.712
Percent of roads in poor condition: 30%
Annual spending per mile: $88,984
Driver satisfaction rating: 5.9/10
Bridge safety score: 71/100
Average commute delay: 14.6 minutes
 Kimberlyshorter, CC BY-SA 4.0, Wikimedia Commons
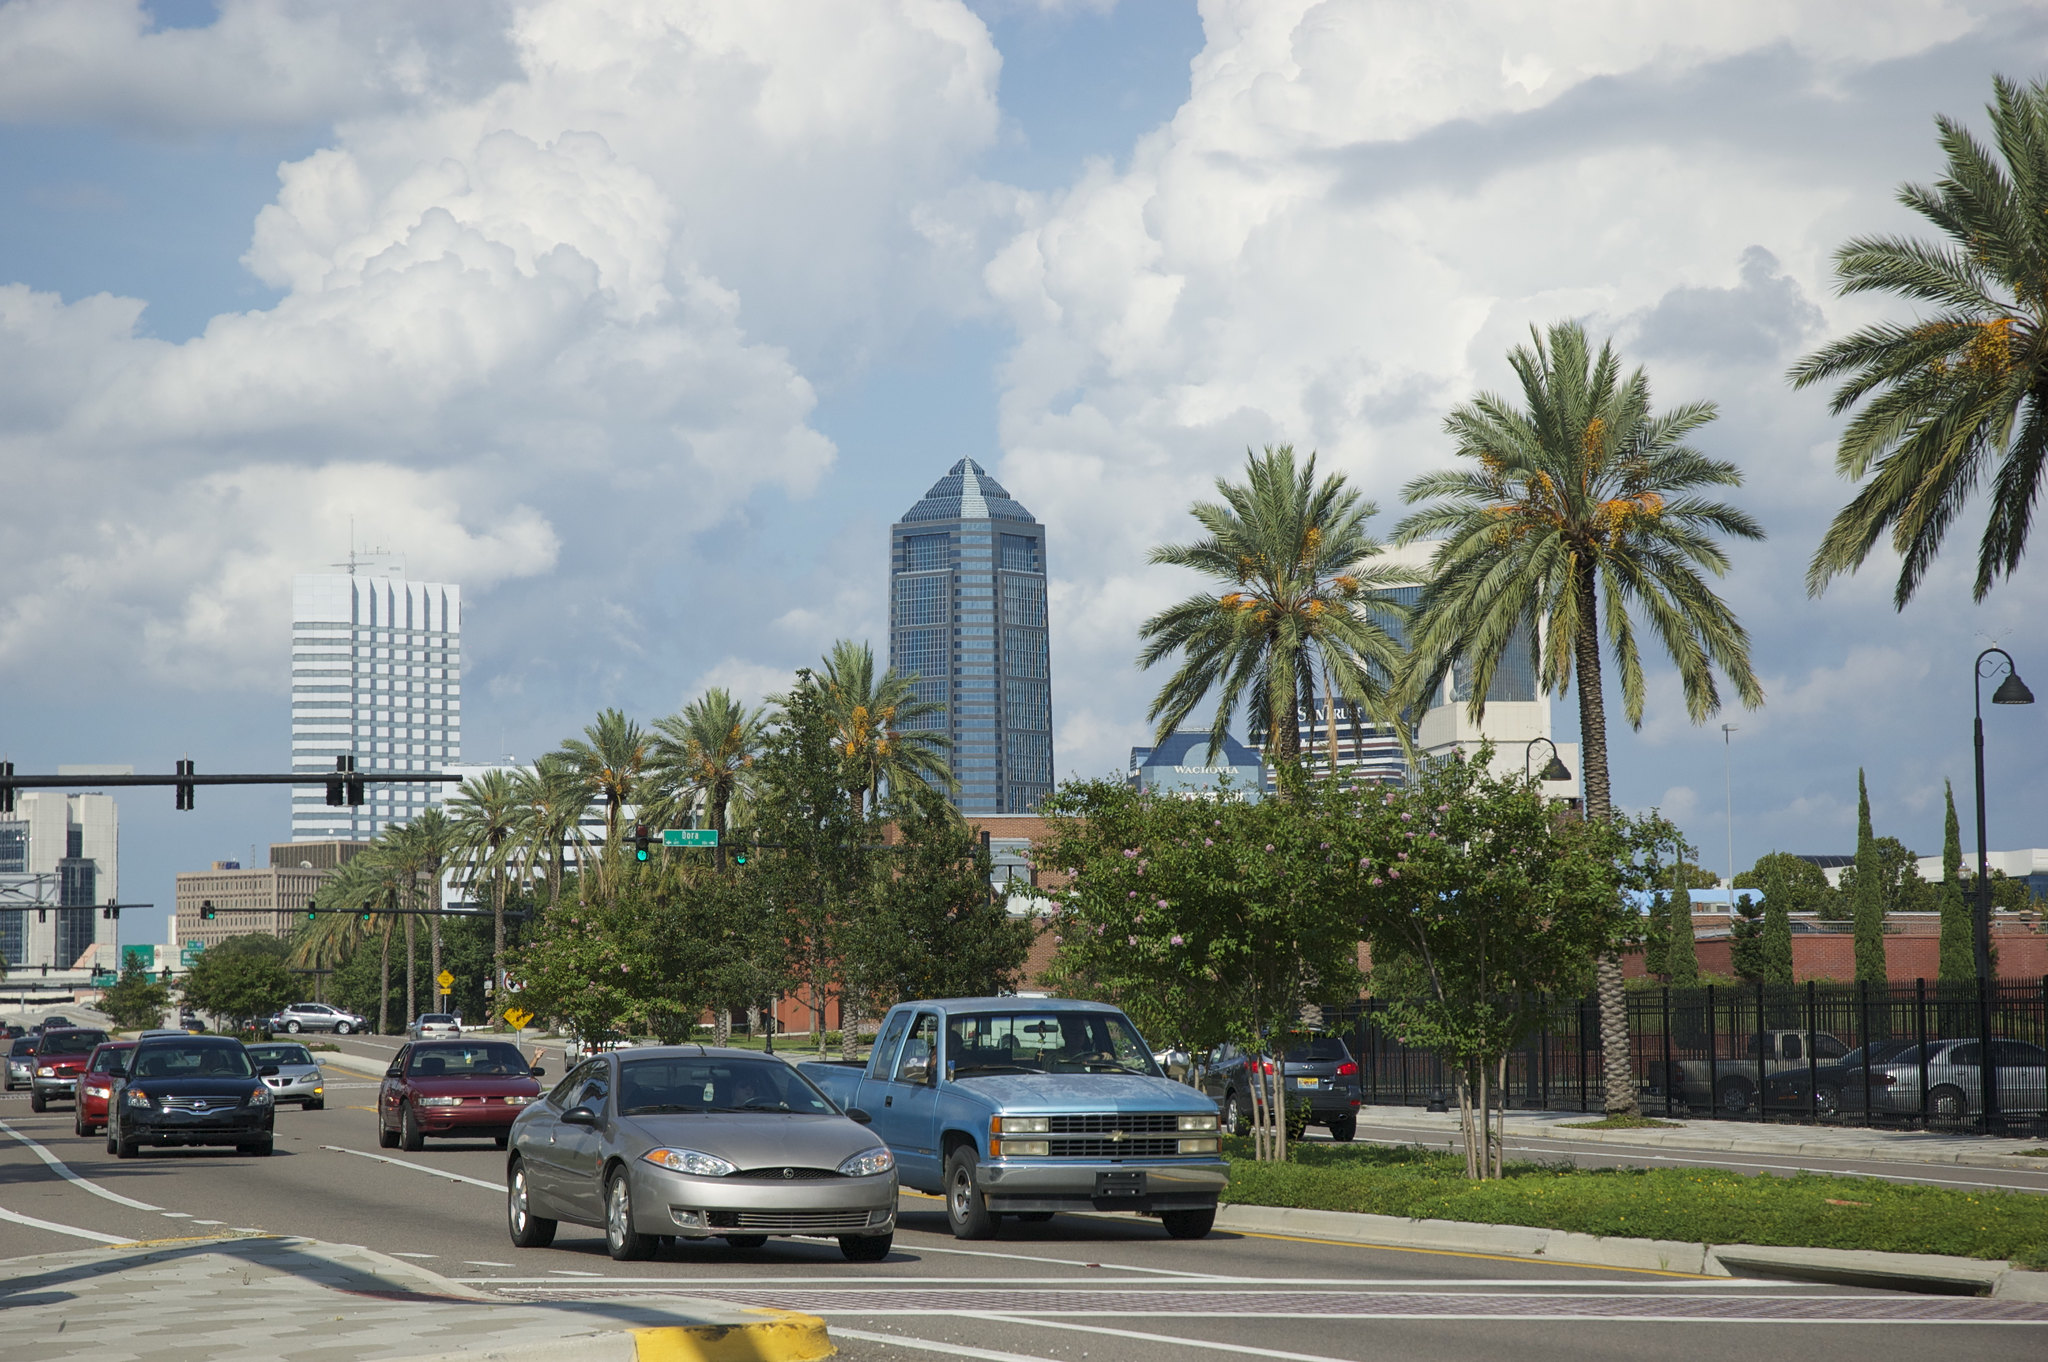
12: Florida
Overall score: 0.704
Percent of roads in poor condition: 47%
Annual spending per mile: $84,974
Driver satisfaction rating: 7.2/10
Bridge safety score: 55/100
Average commute delay: 5.4 minutes
13: Indiana
Overall score: 0.699
Percent of roads in poor condition: 15%
Annual spending per mile: $63,939
Driver satisfaction rating: 6.0/10
Bridge safety score: 62/100
Average commute delay: 4.3 minutes
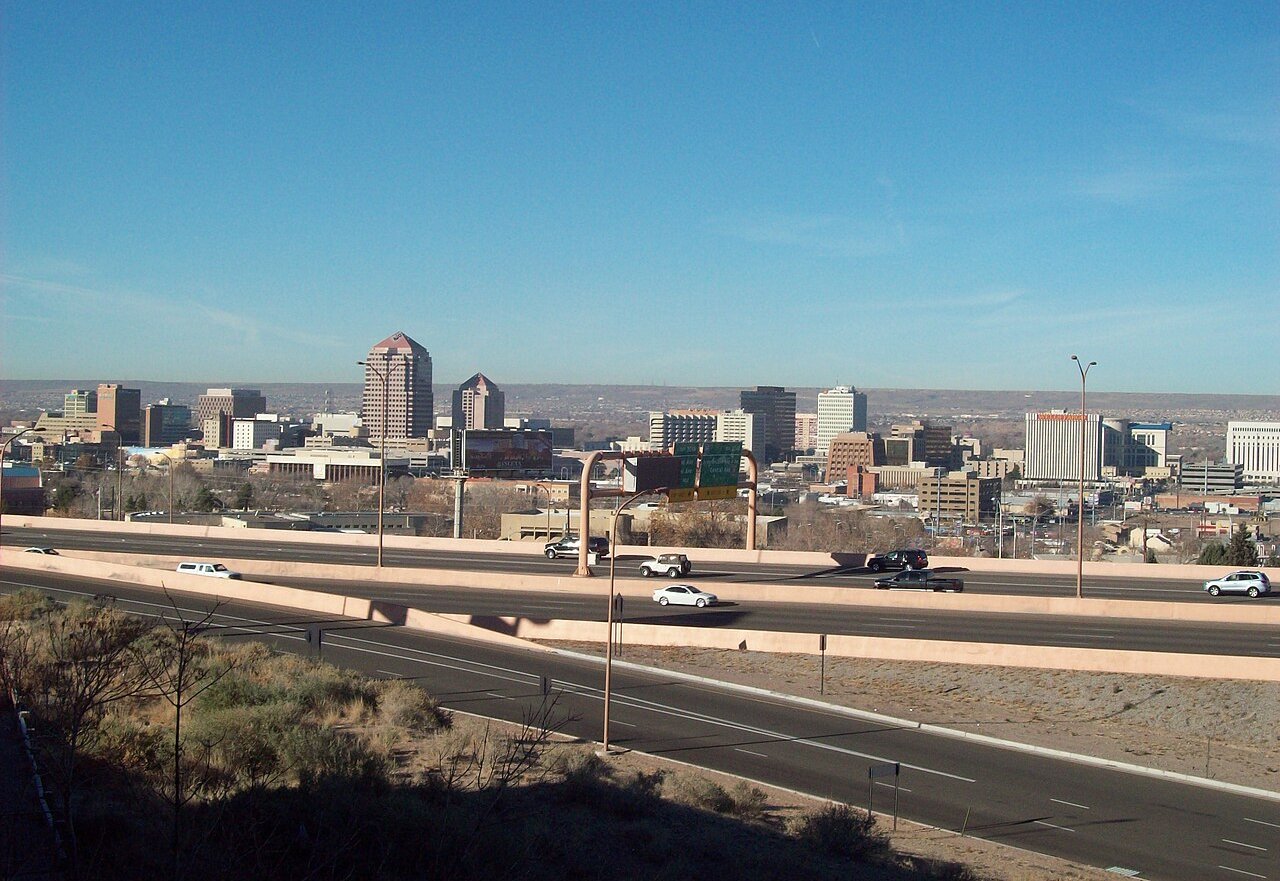
14: New Mexico
Overall score: 0.697
Percent of roads in poor condition: 29%
Annual spending per mile: $80,397
Driver satisfaction rating: 4.9/10
Bridge safety score: 71/100
Average commute delay: 7.9 minutes
 Sahmeditor, CC BY-SA 3.0, Wikimedia Commons
15: Texas
Overall score: 0.695
Percent of roads in poor condition: 23%
Annual spending per mile: $66,531
Driver satisfaction rating: 6.9/10
Bridge safety score: 57/100
Average commute delay: 4.7 minutes

16: Minnesota
Overall score: 0.689
Percent of roads in poor condition: 33%
Annual spending per mile: $88,555
Driver satisfaction rating: 4.1/10
Bridge safety score: 93/100
Average commute delay: 14.1 minutes
 AlexiusHoratius, CC BY-SA 3.0, Wikimedia Commons
17: Kansas
Overall score: 0.679
Percent of roads in poor condition: 31%
Annual spending per mile: $65,851
Driver satisfaction rating: 8.0/10
Bridge safety score: 56/100
Average commute delay: 5.5 minutes
 Quintin Soloviev, CC BY 4.0, Wikimedia Commons
18: North Dakota
Overall score: 0.672
Percent of roads in poor condition: 16%
Annual spending per mile: $72,606
Driver satisfaction rating: 7.2/10
Bridge safety score: 56/100
Average commute delay: 17.1 minutes
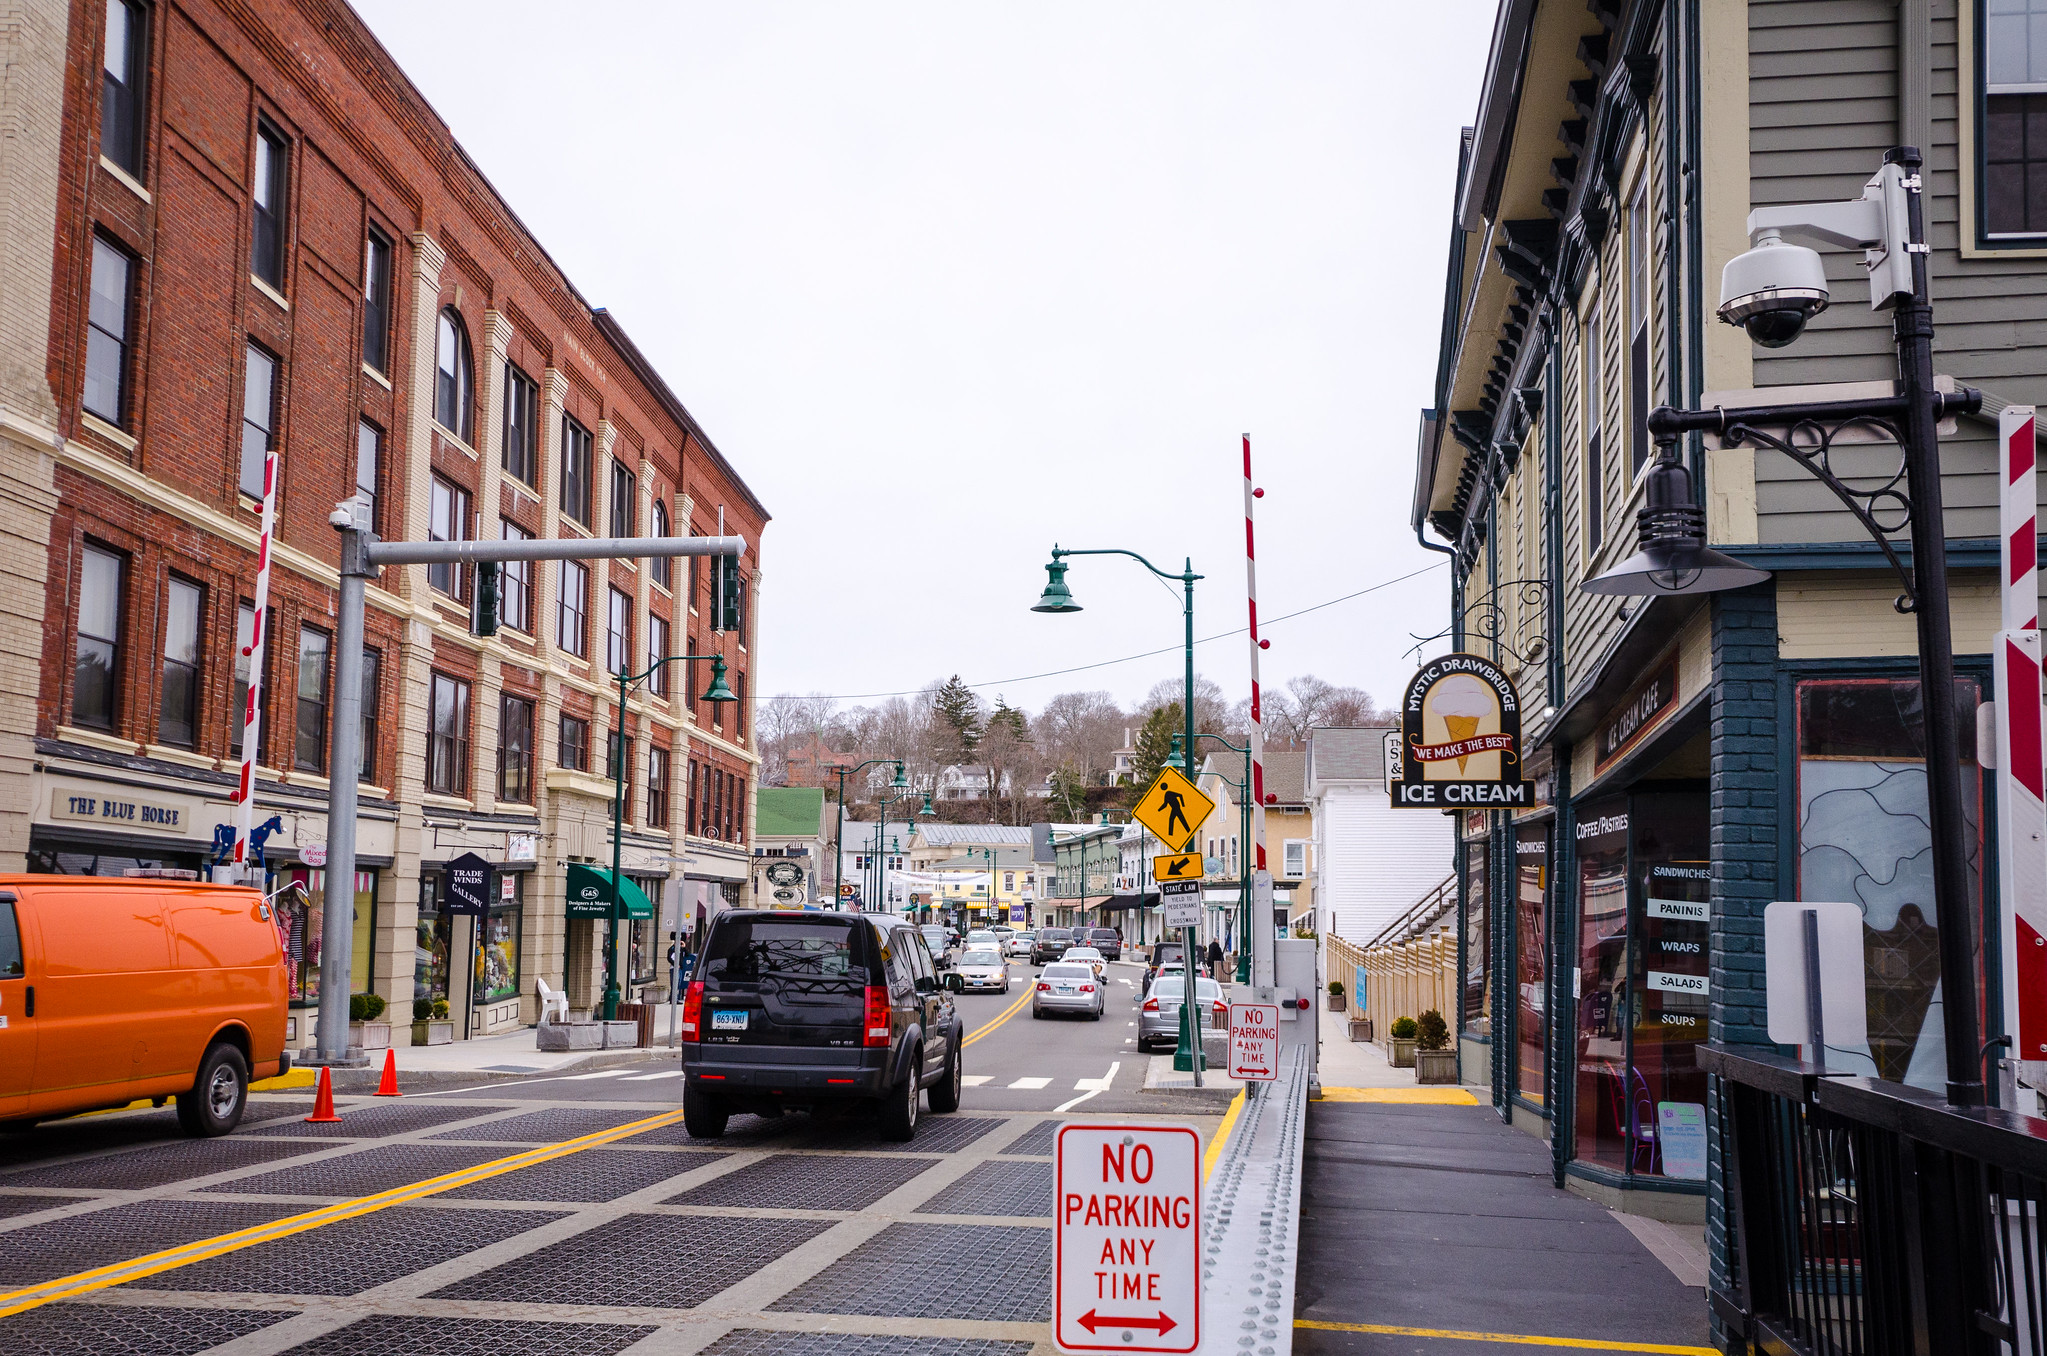
19: Massachusetts
Overall score: 0.663
Percent of roads in poor condition: 29%
Annual spending per mile: $79,976
Driver satisfaction rating: 4.5/10
Bridge safety score: 86/100
Average commute delay: 13.7 minutes

20: Mississippi
Overall score: 0.655
Percent of roads in poor condition: 20%
Annual spending per mile: $64,276
Driver satisfaction rating: 7.1/10
Bridge safety score: 77/100
Average commute delay: 14.1 minutes
21: Alabama
Overall score: 0.649
Percent of roads in poor condition: 7%
Annual spending per mile: $53,417
Driver satisfaction rating: 6.7/10
Bridge safety score: 96/100
Average commute delay: 15.1 minutes
22: Pennsylvania
Overall score: 0.649
Percent of roads in poor condition: 19%
Annual spending per mile: $63,247
Driver satisfaction rating: 4.6/10
Bridge safety score: 91/100
Average commute delay: 9.4 minutes
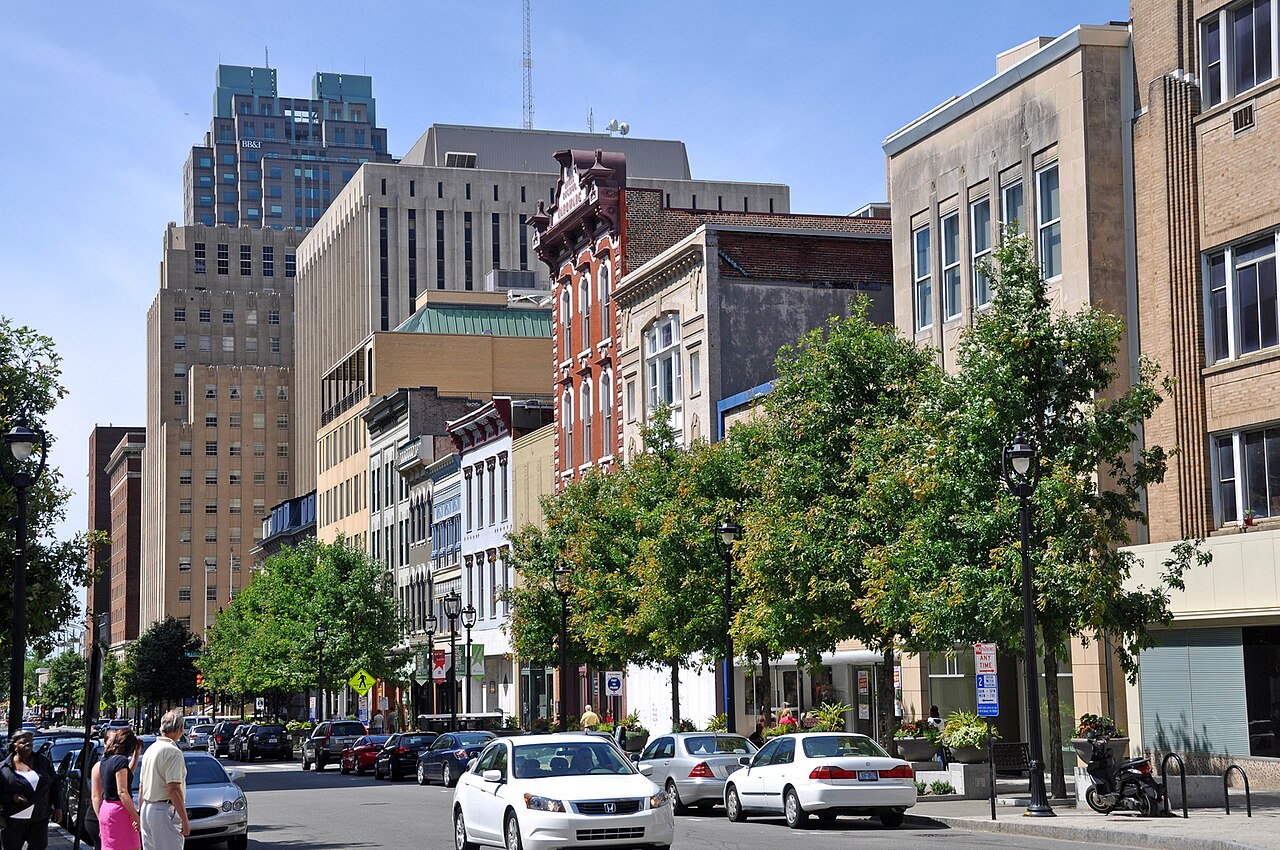
23: Kentucky
Overall score: 0.640
Percent of roads in poor condition: 25%
Annual spending per mile: $66,557
Driver satisfaction rating: 5.2/10
Bridge safety score: 66/100
Average commute delay: 8.1 minutes
 OPMaster, CC BY-SA 3.0, Wikimedia Commons
24: California
Overall score: 0.639
Percent of roads in poor condition: 43%
Annual spending per mile: $61,243
Driver satisfaction rating: 8.0/10
Bridge safety score: 80/100
Average commute delay: 5.3 minutes
25: Connecticut
Overall score: 0.637
Percent of roads in poor condition: 13%
Annual spending per mile: $52,185
Driver satisfaction rating: 7.1/10
Bridge safety score: 98/100
Average commute delay: 14.3 minutes
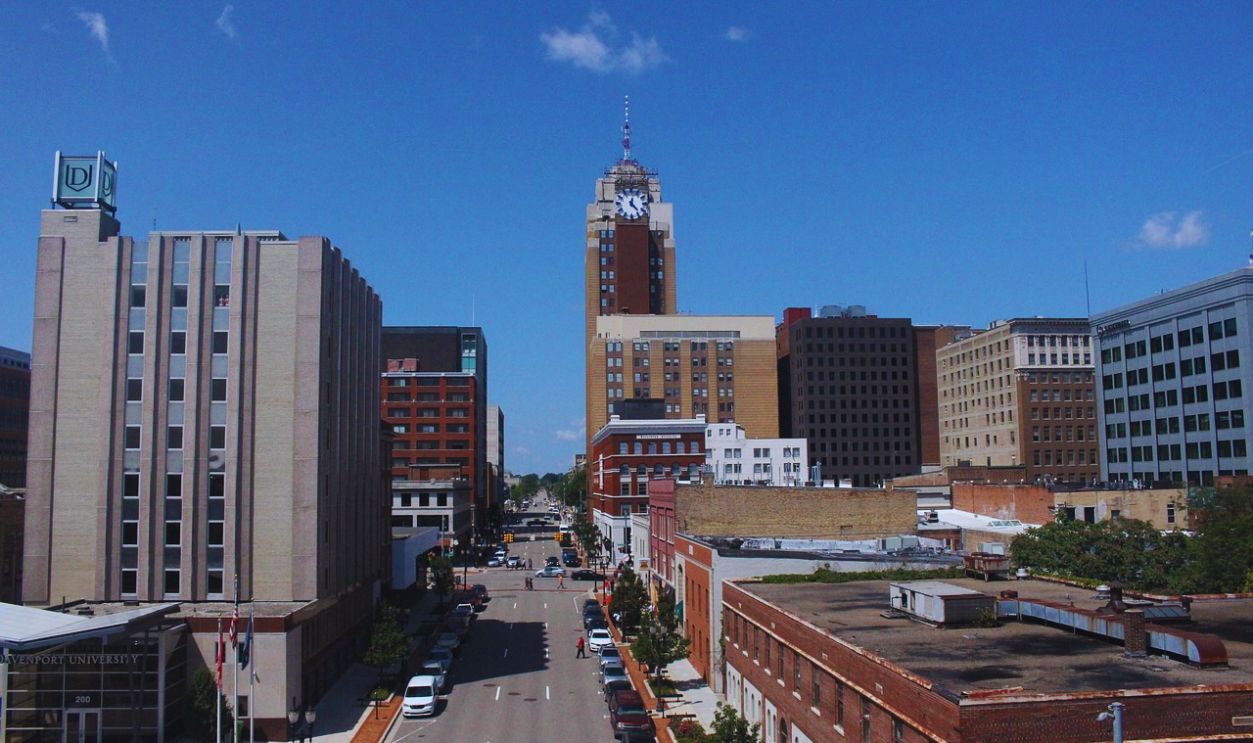
26: Michigan
Overall score: 0.606
Percent of roads in poor condition: 7%
Annual spending per mile: $48,529
Driver satisfaction rating: 6.4/10
Bridge safety score: 87/100
Average commute delay: 15.6 minutes
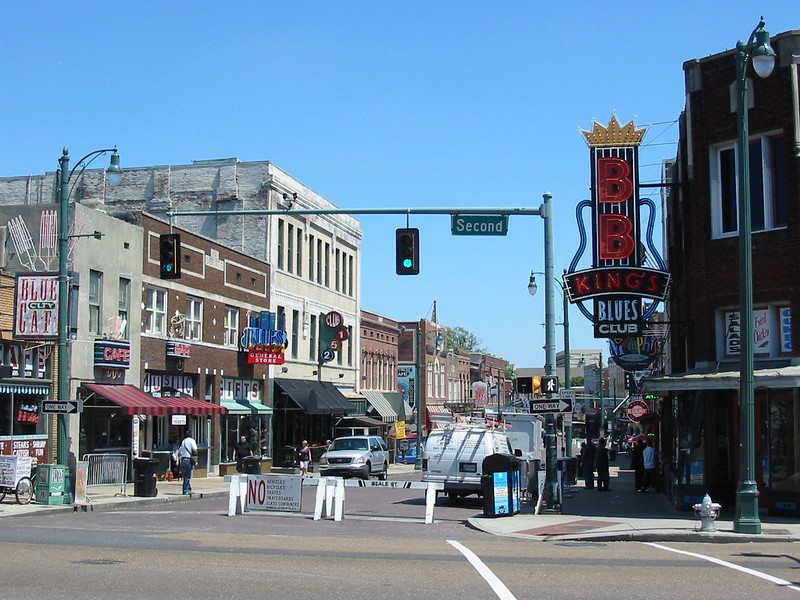
27: Tennessee
Overall score: 0.603
Percent of roads in poor condition: 25%
Annual spending per mile: $54,541
Driver satisfaction rating: 6.7/10
Bridge safety score: 67/100
Average commute delay: 9.1 minutes
28: Illinois
Overall score: 0.600
Percent of roads in poor condition: 11%
Annual spending per mile: $49,268
Driver satisfaction rating: 8.2/10
Bridge safety score: 73/100
Average commute delay: 18.2 minutes
 Bert Kaufmann, CC BY 2.0, Wikimedia Commons
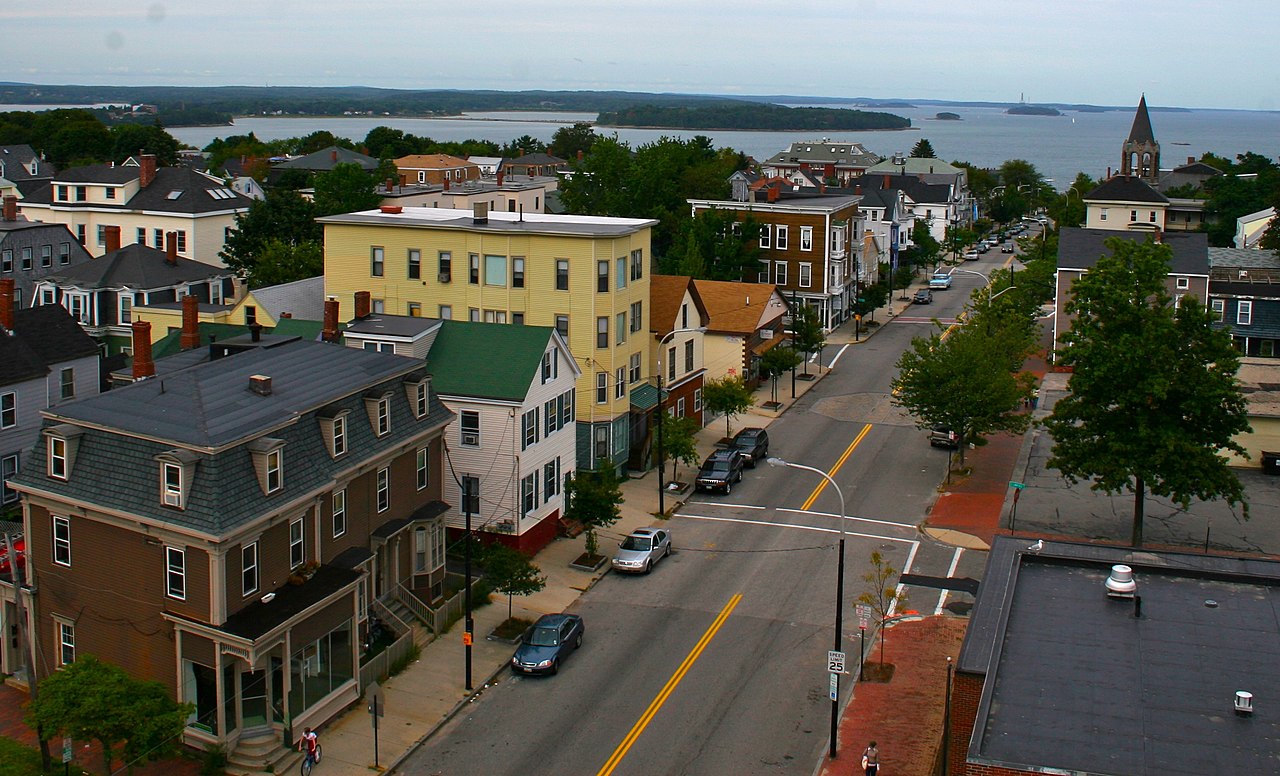
29: Maine
Overall score: 0.598
Percent of roads in poor condition: 37%
Annual spending per mile: $73,763
Driver satisfaction rating: 4.2/10
Bridge safety score: 93/100
Average commute delay: 14.6 minutes
 Jeffrey B. Ferland, CC BY-SA 2.5, Wikimedia Commons
30: Utah
Overall score: 0.598
Percent of roads in poor condition: 19%
Annual spending per mile: $57,159
Driver satisfaction rating: 4.9/10
Bridge safety score: 87/100
Average commute delay: 12.6 minutes

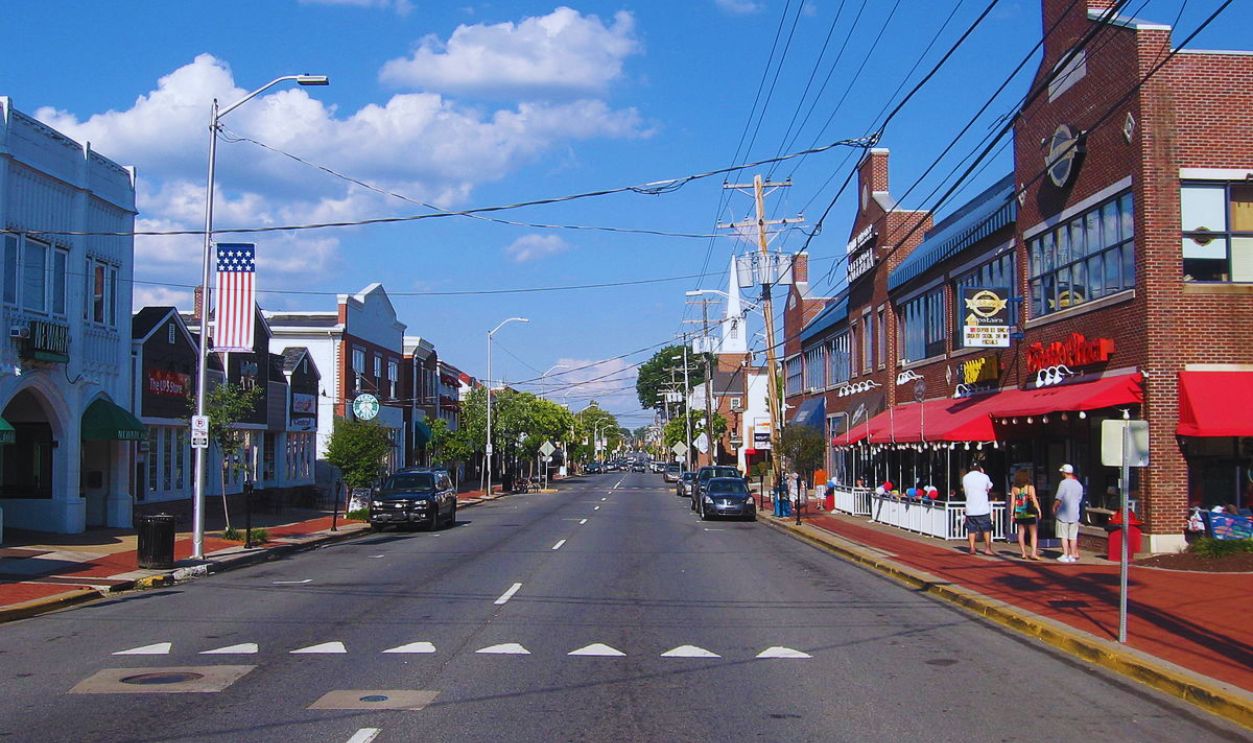
31: Delaware
Overall score: 0.590
Percent of roads in poor condition: 34%
Annual spending per mile: $45,675
Driver satisfaction rating: 7.8/10
Bridge safety score: 86/100
Average commute delay: 5.8 minutes
 PookieFugglestein, CC0, Wikimedia Commons
32: Oklahoma
Overall score: 0.588
Percent of roads in poor condition: 48%
Annual spending per mile: $64,300
Driver satisfaction rating: 6.7/10
Bridge safety score: 86/100
Average commute delay: 9.6 minutes
 Nicholas J. Klein, Adobe Stock
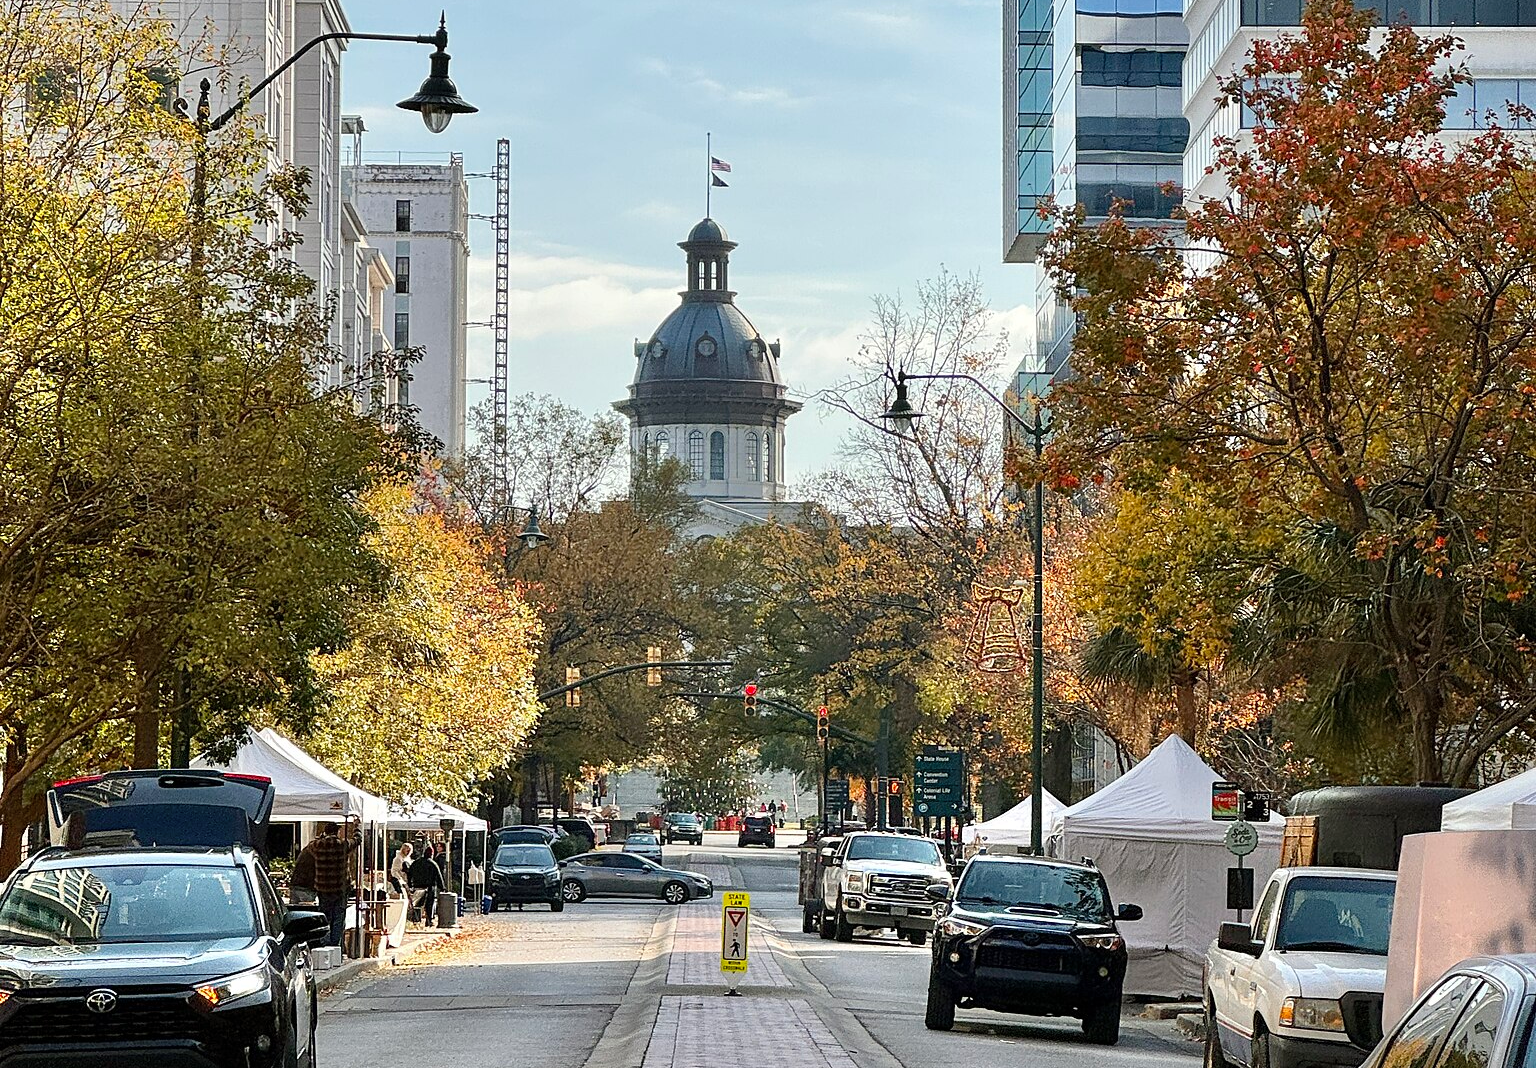
33: South Carolina
Overall score: 0.586
Percent of roads in poor condition: 6%
Annual spending per mile: $49,692
Driver satisfaction rating: 6.5/10
Bridge safety score: 78/100
Average commute delay: 19.0 minutes
 w_lemay, CC BY-SA 2.0, Wikimedia Commons
34: Montana
Overall score: 0.584
Percent of roads in poor condition: 48%
Annual spending per mile: $69,127
Driver satisfaction rating: 6.0/10
Bridge safety score: 91/100
Average commute delay: 12.5 minutes
 Quintin Soloviev, CC BY 4.0, Wikimedia Commons
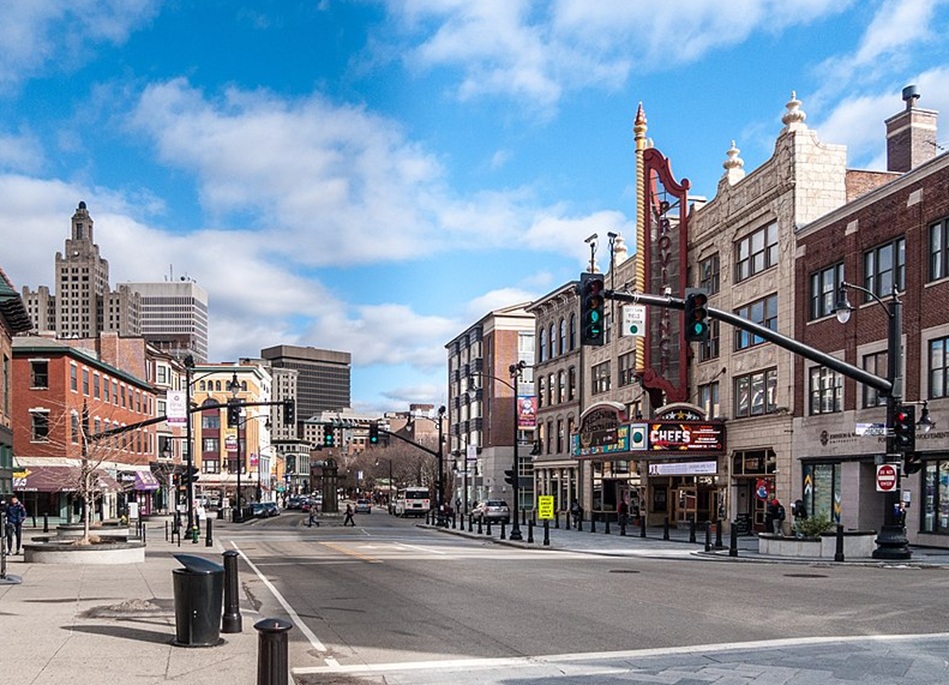
35: Rhode Island
Overall score: 0.577
Percent of roads in poor condition: 25%
Annual spending per mile: $61,271
Driver satisfaction rating: 6.7/10
Bridge safety score: 56/100
Average commute delay: 16.5 minutes
 Kenneth C. Zirkel, CC BY-SA 4.0, Wikimedia Commons
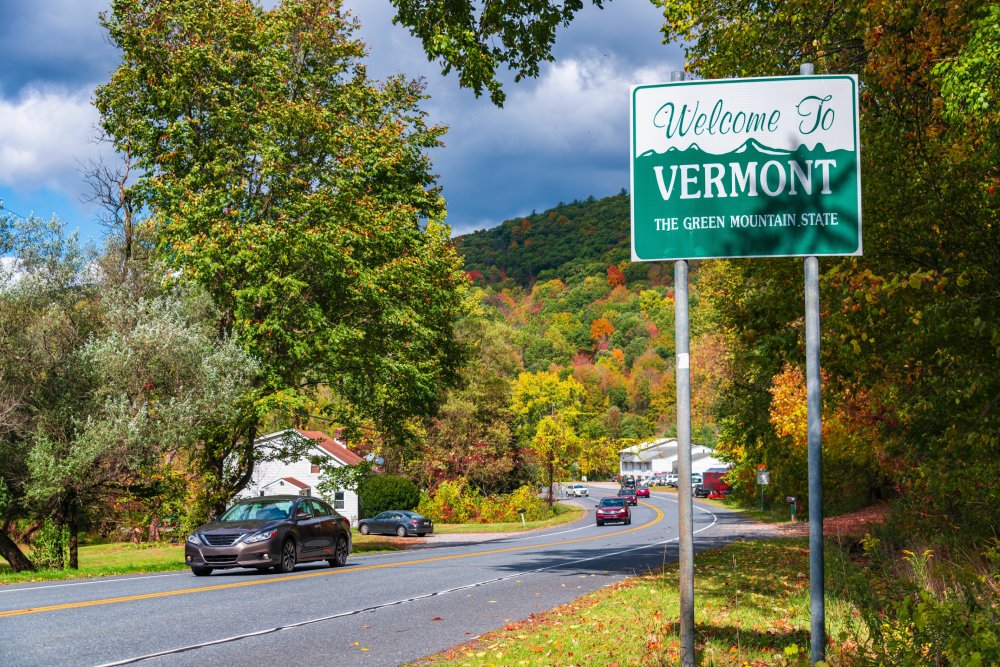
36: Vermont
Overall score: 0.577
Percent of roads in poor condition: 32%
Annual spending per mile: $64,253
Driver satisfaction rating: 6.5/10
Bridge safety score: 82/100
Average commute delay: 18.4 minutes
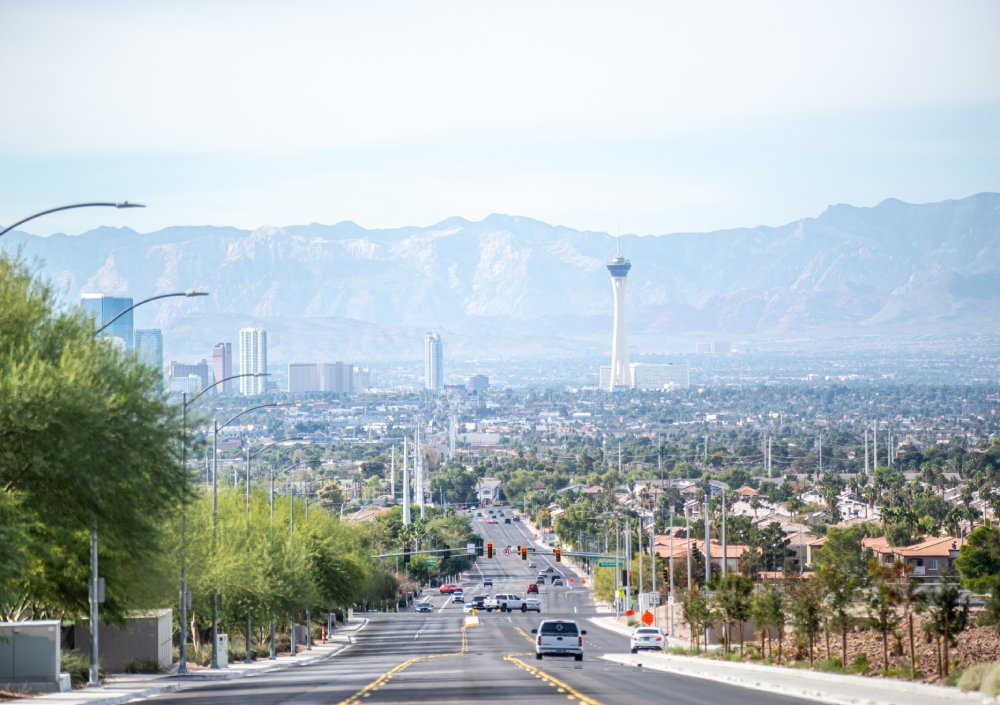
37: Nevada
Overall score: 0.565
Percent of roads in poor condition: 28%
Annual spending per mile: $59,457
Driver satisfaction rating: 4.4/10
Bridge safety score: 81/100
Average commute delay: 12.2 minutes
38: North Carolina
Overall score: 0.561
Percent of roads in poor condition: 15%
Annual spending per mile: $43,943
Driver satisfaction rating: 7.8/10
Bridge safety score: 60/100
Average commute delay: 14.8 minutes
 Bz3rk, CC BY-SA 3.0, Wikimedia Commons
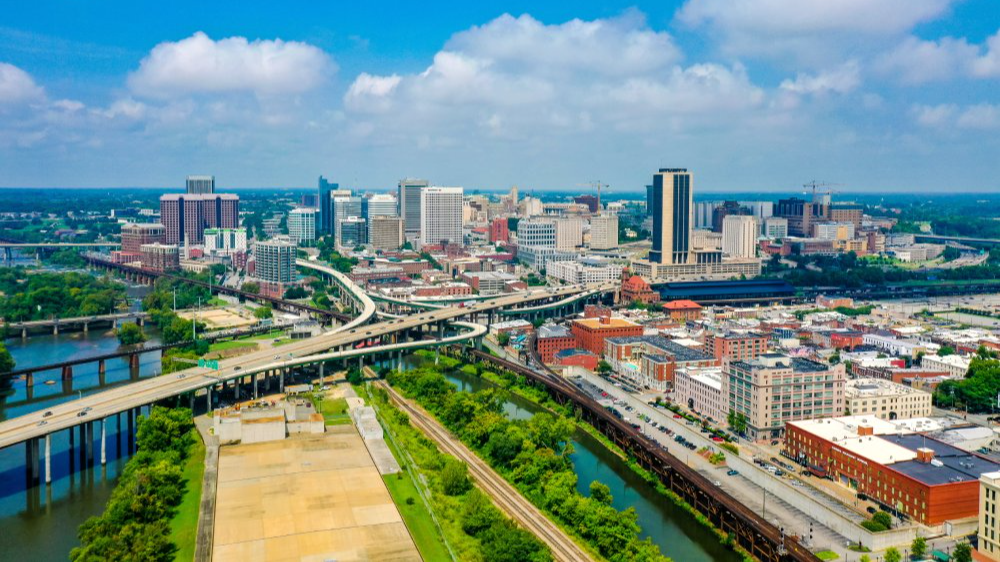
39: Virginia
Overall score: 0.555
Percent of roads in poor condition: 27%
Annual spending per mile: $41,585
Driver satisfaction rating: 8.1/10
Bridge safety score: 93/100
Average commute delay: 13.5 minutes
40: Wyoming
Overall score: 0.549
Percent of roads in poor condition: 24%
Annual spending per mile: $42,568
Driver satisfaction rating: 5.5/10
Bridge safety score: 78/100
Average commute delay: 6.6 minutes

41: New Hampshire
Overall score: 0.536
Percent of roads in poor condition: 43%
Annual spending per mile: $63,483
Driver satisfaction rating: 5.3/10
Bridge safety score: 79/100
Average commute delay: 14.1 minutes
 Mikespenard, Wikimedia Commons
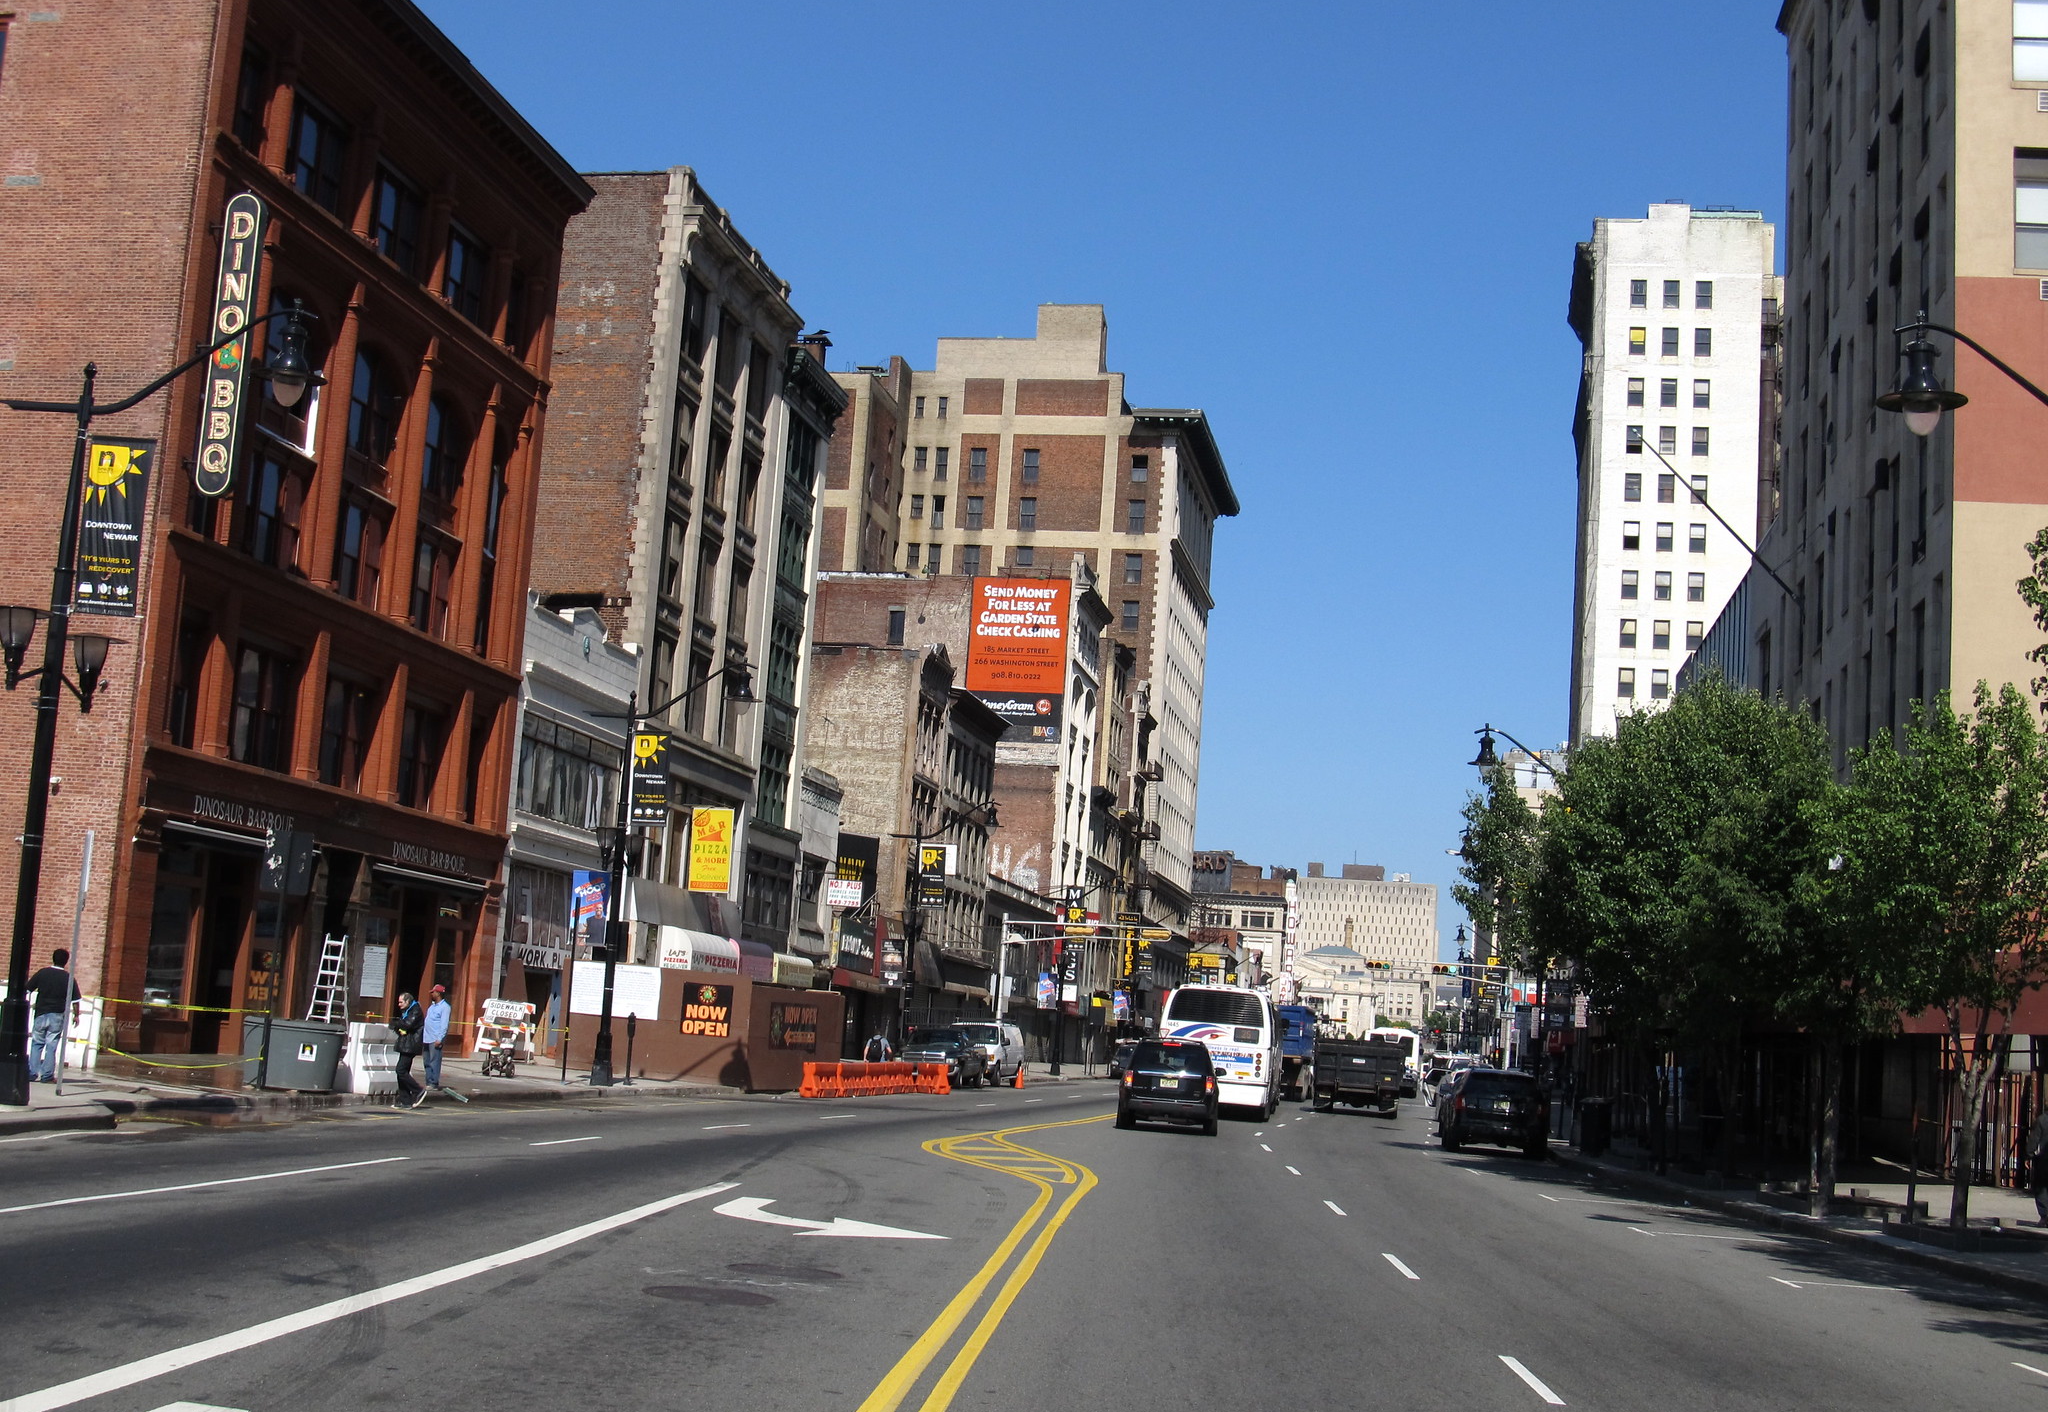
42: New Jersey
Overall score: 0.535
Percent of roads in poor condition: 8%
Annual spending per mile: $48,571
Driver satisfaction rating: 5.3/10
Bridge safety score: 60/100
Average commute delay: 18.4 minutes
43: Iowa
Overall score: 0.534
Percent of roads in poor condition: 48%
Annual spending per mile: $46,873
Driver satisfaction rating: 8.4/10
Bridge safety score: 86/100
Average commute delay: 9.5 minutes
 Stevat20, CC BY-SA 4.0, Wikimedia Commons
44: Oregon
Overall score: 0.517
Percent of roads in poor condition: 44%
Annual spending per mile: $51,653
Driver satisfaction rating: 7.0/10
Bridge safety score: 91/100
Average commute delay: 14.3 minutes

45: South Dakota
Overall score: 0.505
Percent of roads in poor condition: 26%
Annual spending per mile: $51,534
Driver satisfaction rating: 4.5/10
Bridge safety score: 57/100
Average commute delay: 12.9 minutes

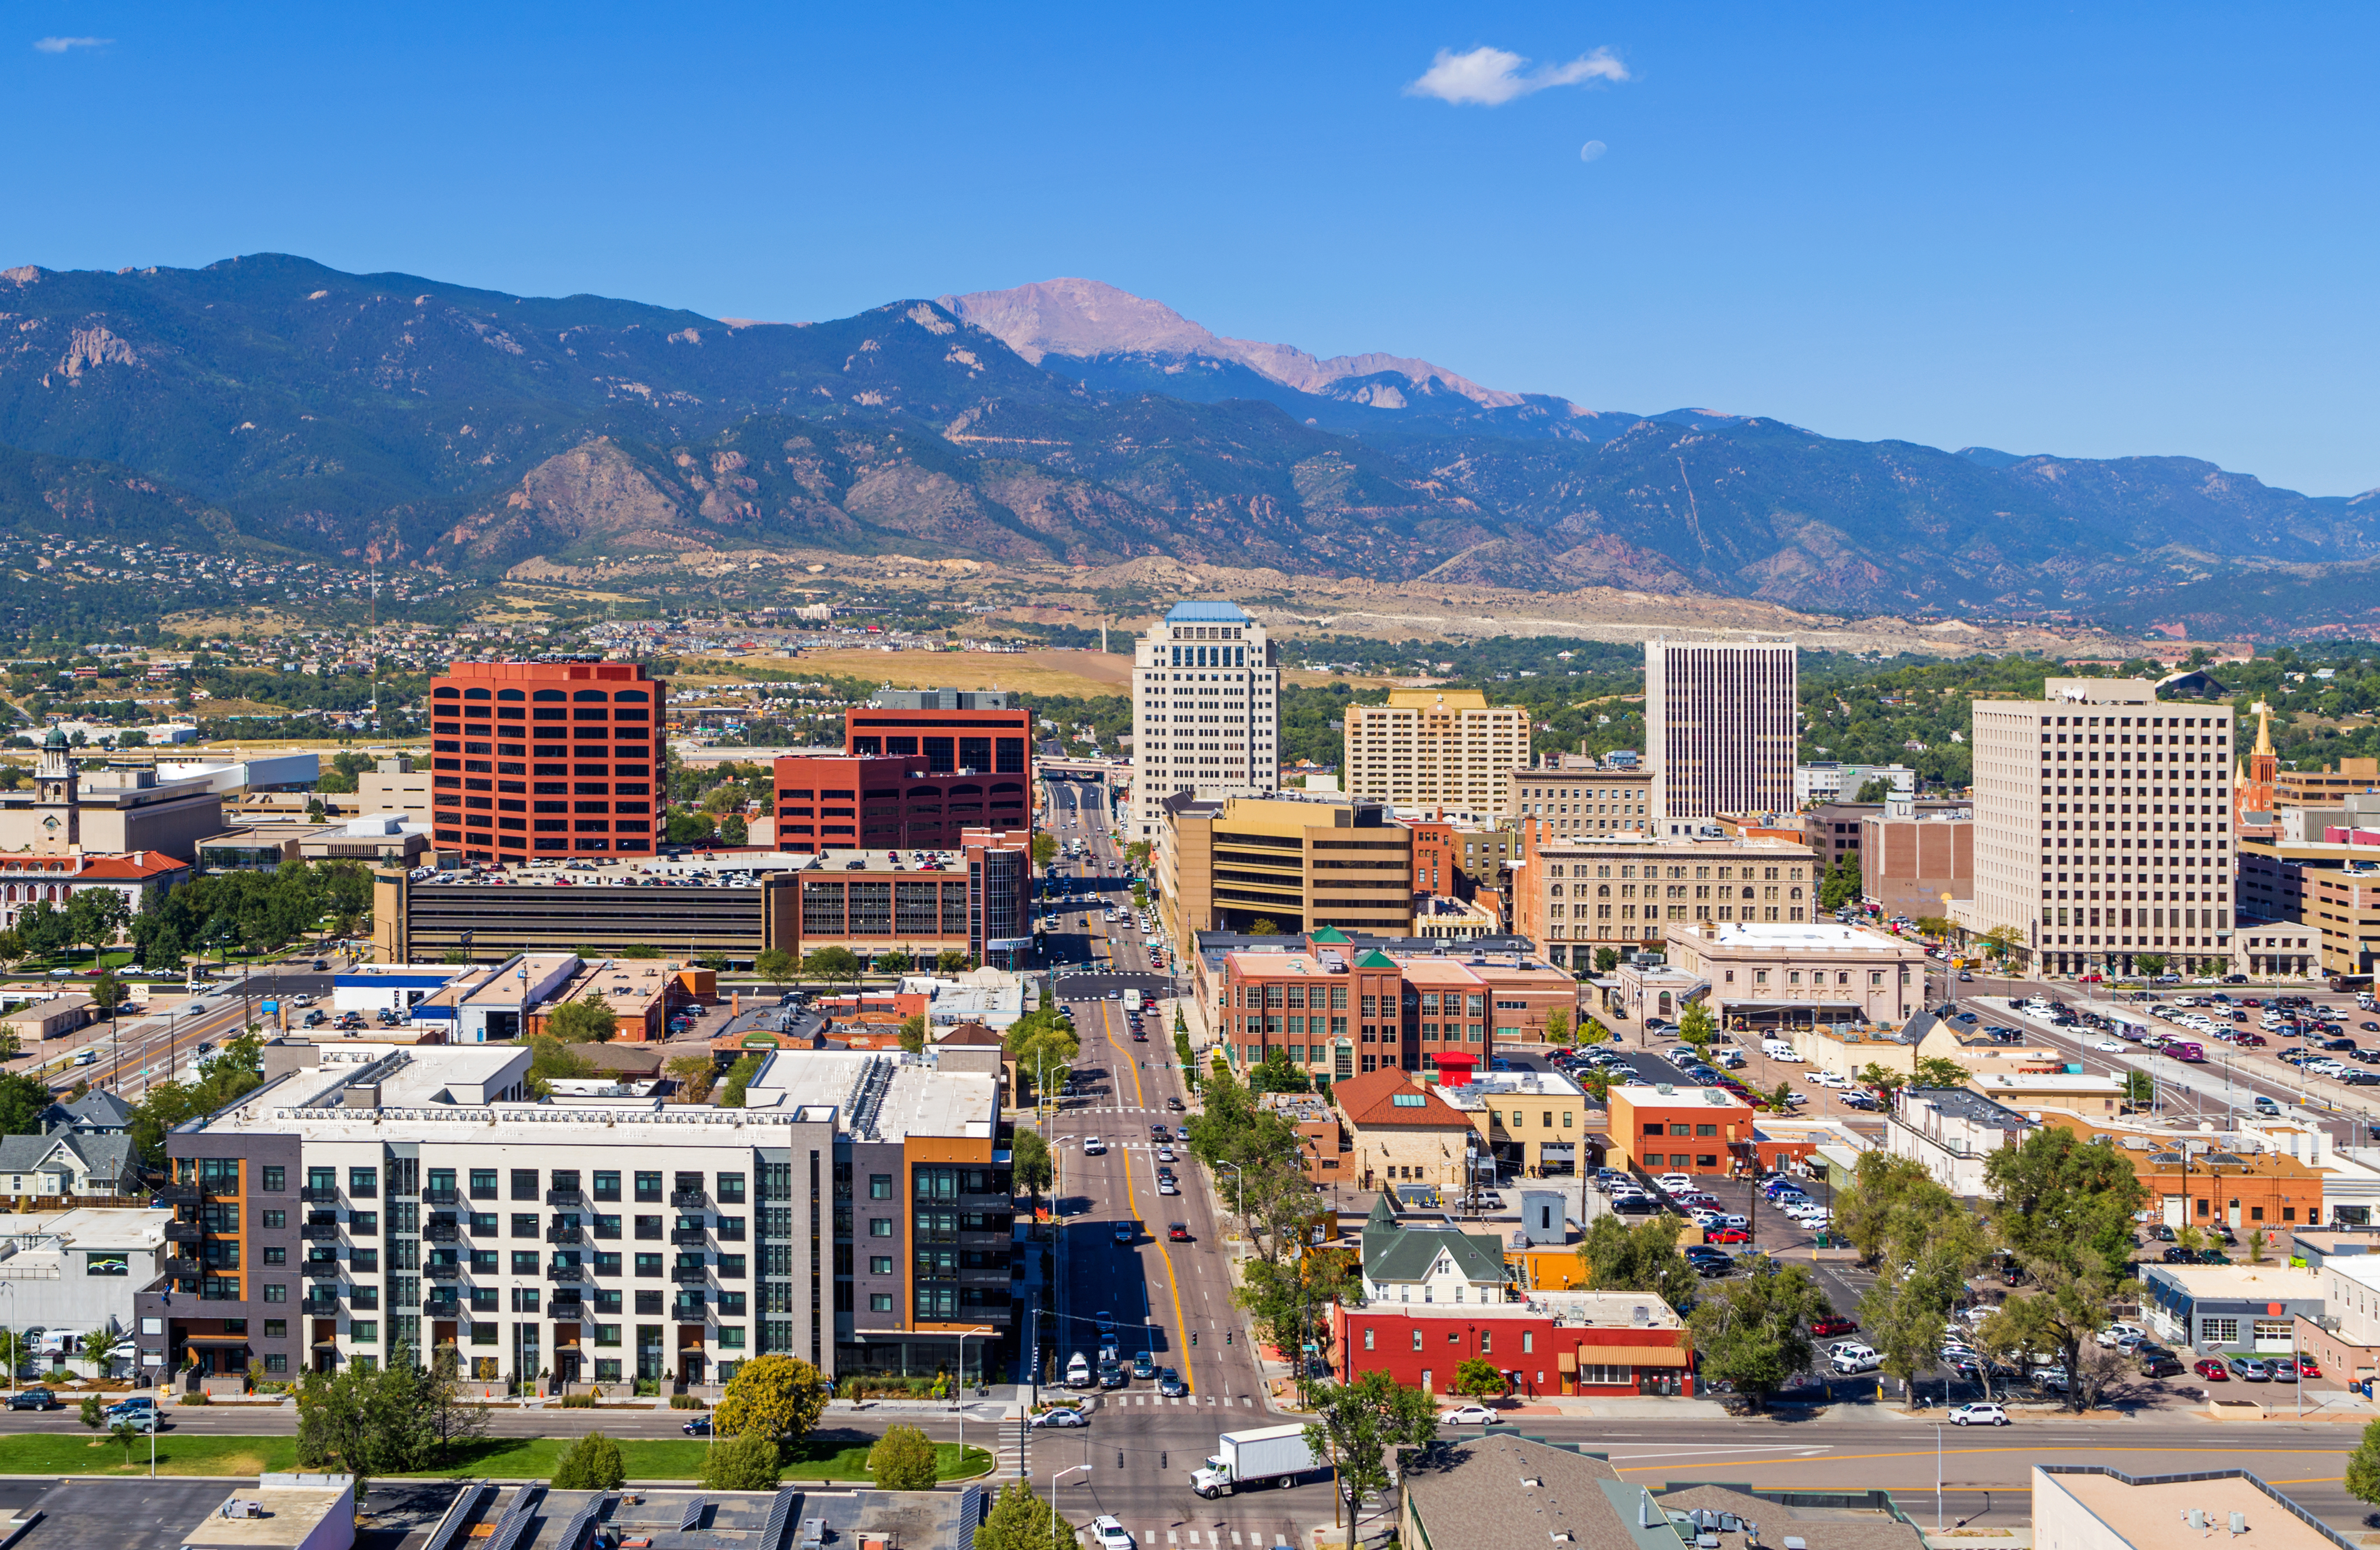
46: Colorado
Overall score: 0.468
Percent of roads in poor condition: 40%
Annual spending per mile: $41,021
Driver satisfaction rating: 5.7/10
Bridge safety score: 63/100
Average commute delay: 7.6 minutes
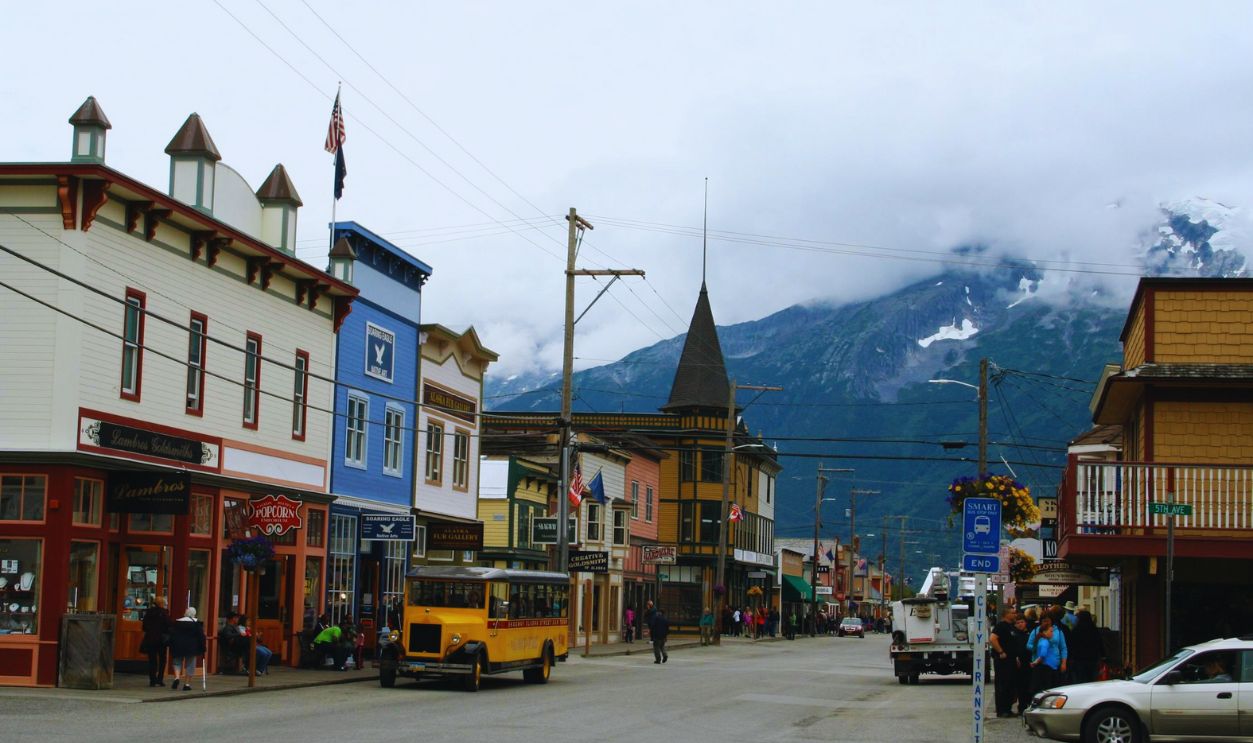
47: Alaska
Overall score: 0.451
Percent of roads in poor condition: 41%
Annual spending per mile: $57,262
Driver satisfaction rating: 4.9/10
Bridge safety score: 55/100
Average commute delay: 18.4 minutes
48: Hawaii
Overall score: 0.438
Percent of roads in poor condition: 32%
Annual spending per mile: $42,027
Driver satisfaction rating: 4.5/10
Bridge safety score: 59/100
Average commute delay: 12.8 minutes
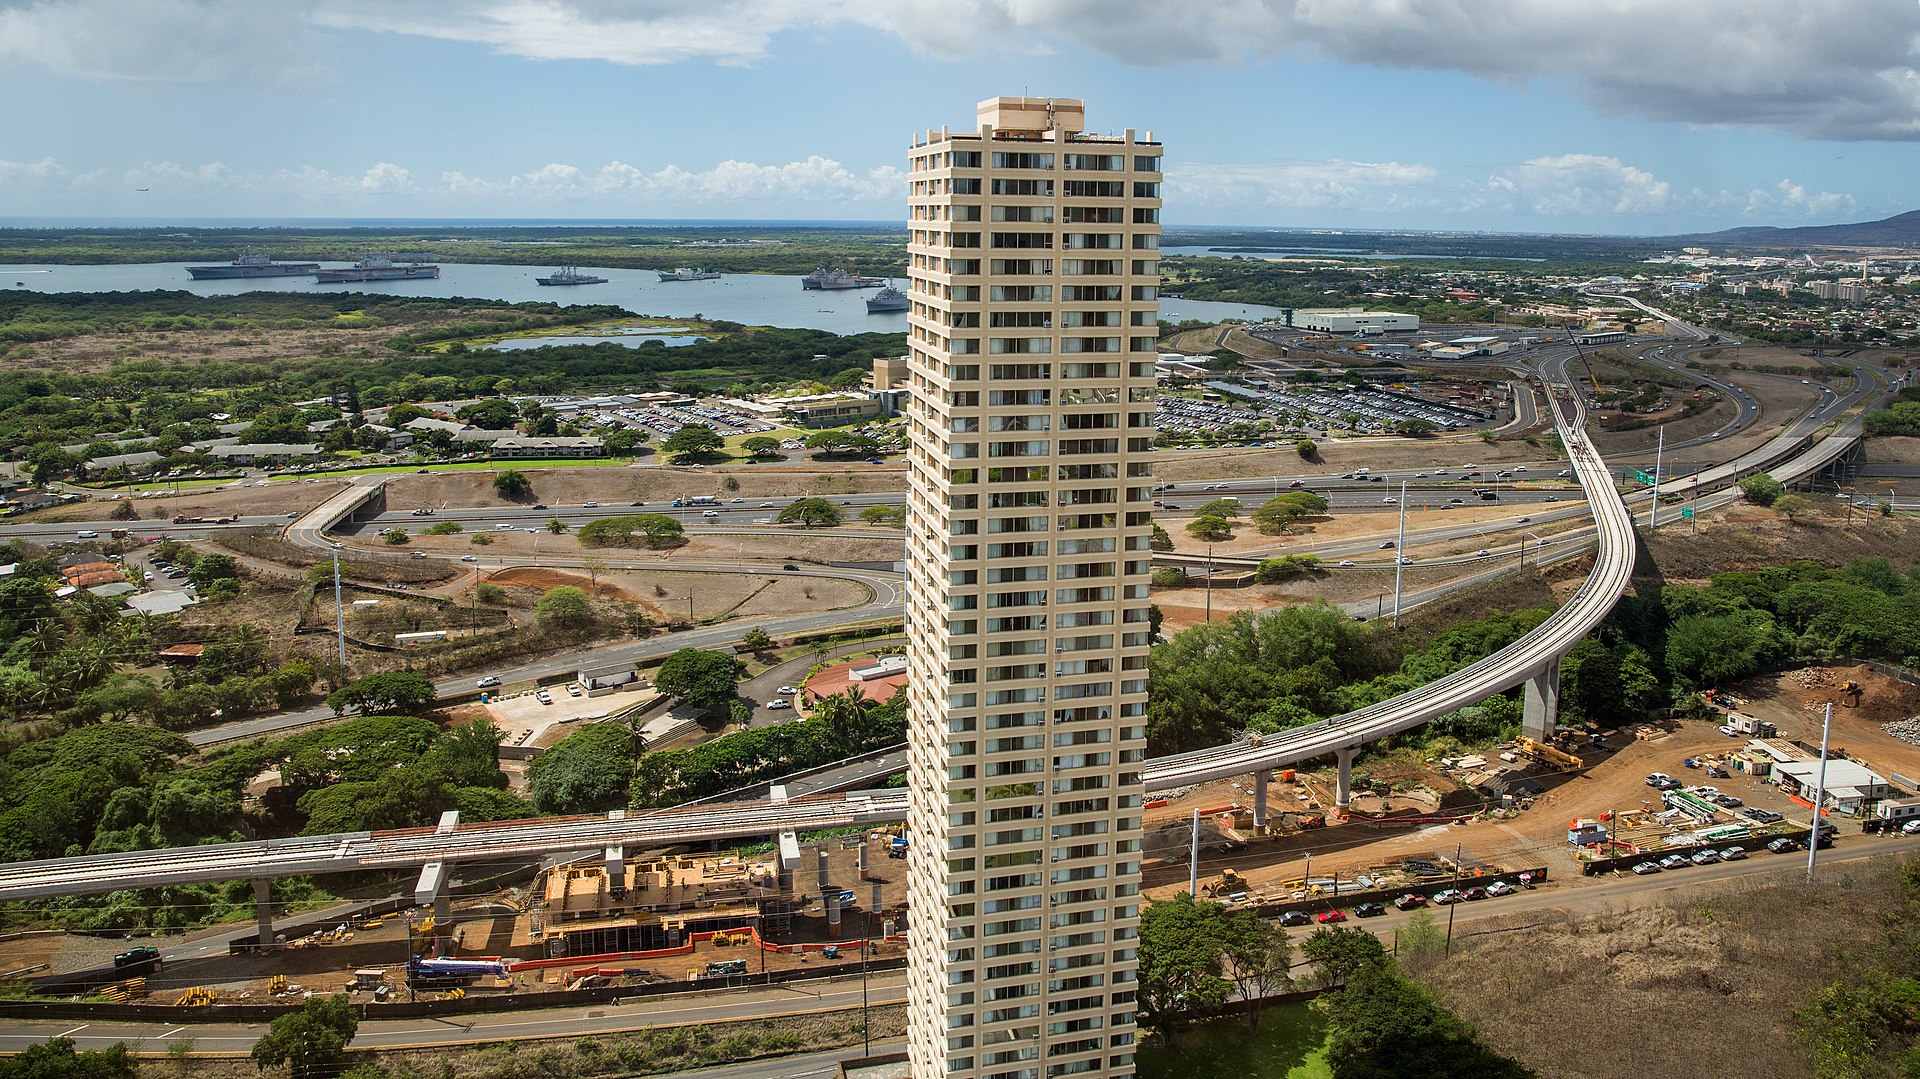 Anthony Quintano CC BY 2.0, Wikimedia Commons
49: Ohio
Overall score: 0.434
Percent of roads in poor condition: 42%
Annual spending per mile: $41,760
Driver satisfaction rating: 5.5/10
Bridge safety score: 71/100
Average commute delay: 12.8 minutes
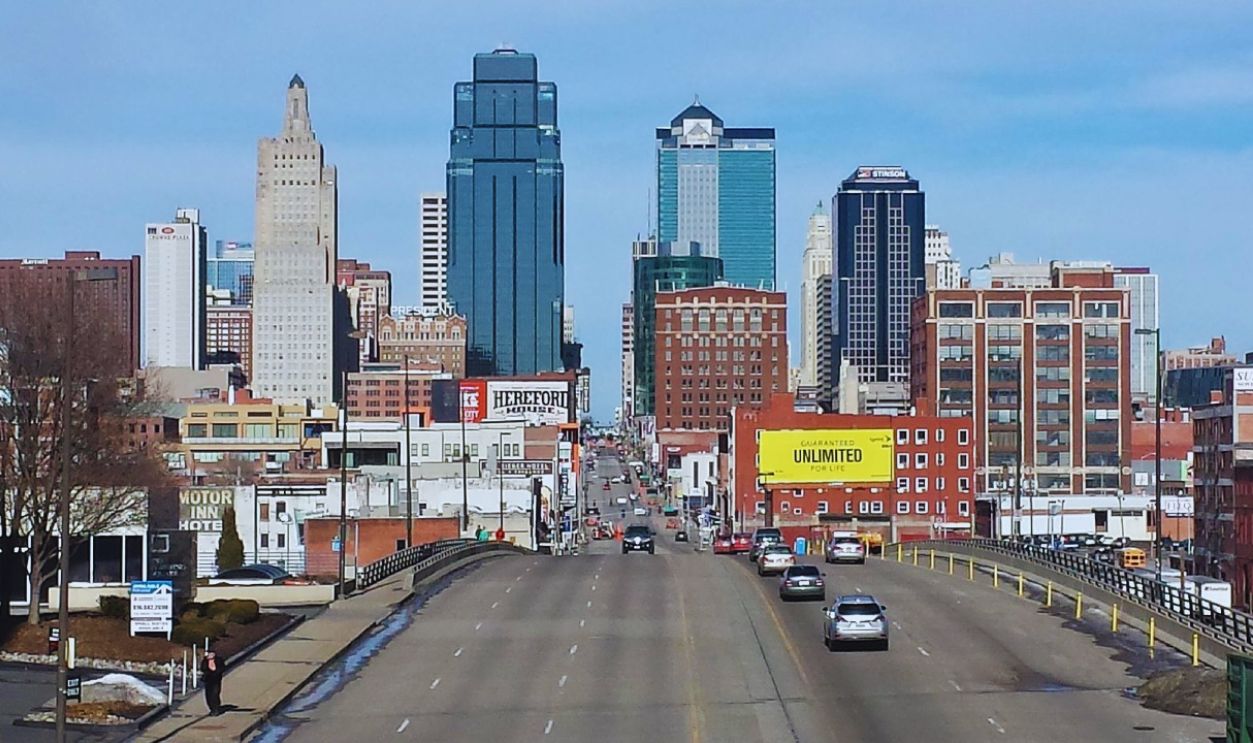
50: Missouri
Overall score: 0.426
Percent of roads in poor condition: 42%
Annual spending per mile: $40,161
Driver satisfaction rating: 7.2/10
Bridge safety score: 78/100
Average commute delay: 18.8 minutes
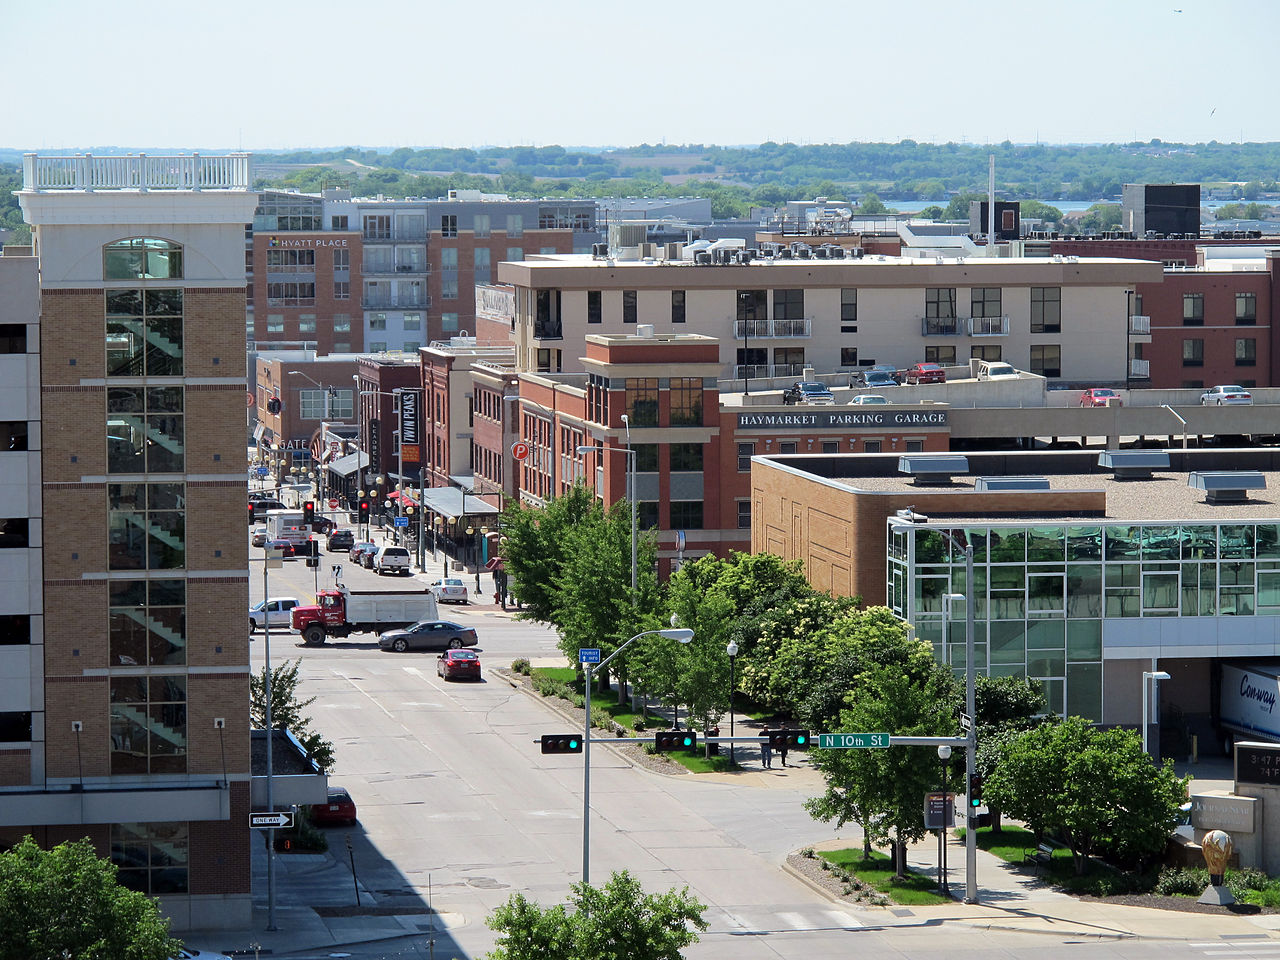
51: Nebraska
Overall score: 0.375
Percent of roads in poor condition: 46%
Annual spending per mile: $41,016
Driver satisfaction rating: 6.1/10
Bridge safety score: 56/100
Average commute delay: 18.4 minutes
 Hanyou23, CC BY-SA 4.0, Wikimedia Commons
You Might Also Like:
Ranking The Most Tech-Advanced Countries In The World—According To Data
Ranking The Top Cities With The Best Nightlife—According To Data


.jpg)
.jpg)
.jpg)