

Gridlocked And Loaded
Long lines at red lights, crammed subways, and endless bumper-to-bumper traffic—it’s no wonder commuting can ruin your day.
We analyzed the average commute time, traffic congestion level, public transit quality, and the percentage of residents with 45+ minute commutes to determine which cities are the hardest on commuters. Using a weighted scoring system, we’ve ranked the 51 worst U.S. cities for commuting (is your city on the list).

51: Salt Lake City, Utah
Commute score: 18.8
Average commute time: 23.8 minutes
Congestion level: 17%
Public transit score: 55
45+ min commutes: 13.5%
SLC offers light rail, but many still face longer-than-expected commutes and unreliable coverage.

50: Buffalo, New York
Commute score: 19.6
Average commute time: 22.5 minutes
Congestion level: 16%
Public transit score: 42
45+ min commutes: 12.6%
Buffalo doesn’t have major congestion, but weak transit systems keep it on this list.
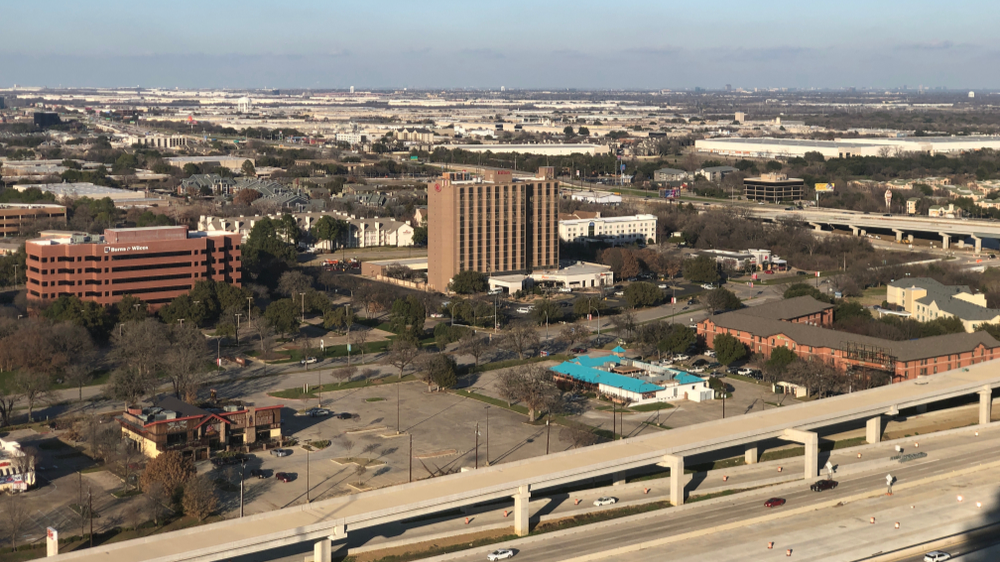
 Andre Carrotflower, Wikimedia Commons
49: Spokane, Washington
Commute score: 22.1
Average commute time: 22.1 minutes
Congestion level: 15%
Public transit score: 33
45+ min commutes: 13.2%
Spokane’s low congestion helps, but public transit access is still lacking for many neighborhoods.
 SounderBruce, Wikimedia Commons
48: Chattanooga, Tennessee
Commute score: 23.0
Average commute time: 21.4 minutes
Congestion level: 14%
Public transit score: 24
45+ min commutes: 12.9%
Short commutes don’t tell the full story—poor public transit means few alternatives to driving.

47: Boise, Idaho
Commute score: 23.7
Average commute time: 21.6 minutes
Congestion level: 15%
Public transit score: 29
45+ min commutes: 13.8%
Boise’s sprawl and low transit investment lead to heavy reliance on personal vehicles.

46: Milwaukee, Wisconsin
Commute score: 25.3
Average commute time: 22.5 minutes
Congestion level: 18%
Public transit score: 39
45+ min commutes: 14.2%
Milwaukee offers transit, but budget cuts and infrequent service hurt its reliability.
 Michael Barera, Wikimedia Commons
45: Richmond, Virginia
Commute score: 27.9
Average commute time: 24.9 minutes
Congestion level: 18%
Public transit score: 41
45+ min commutes: 14.0%
Though average times seem mild, the lack of rail or major transit options hurts daily reliability.

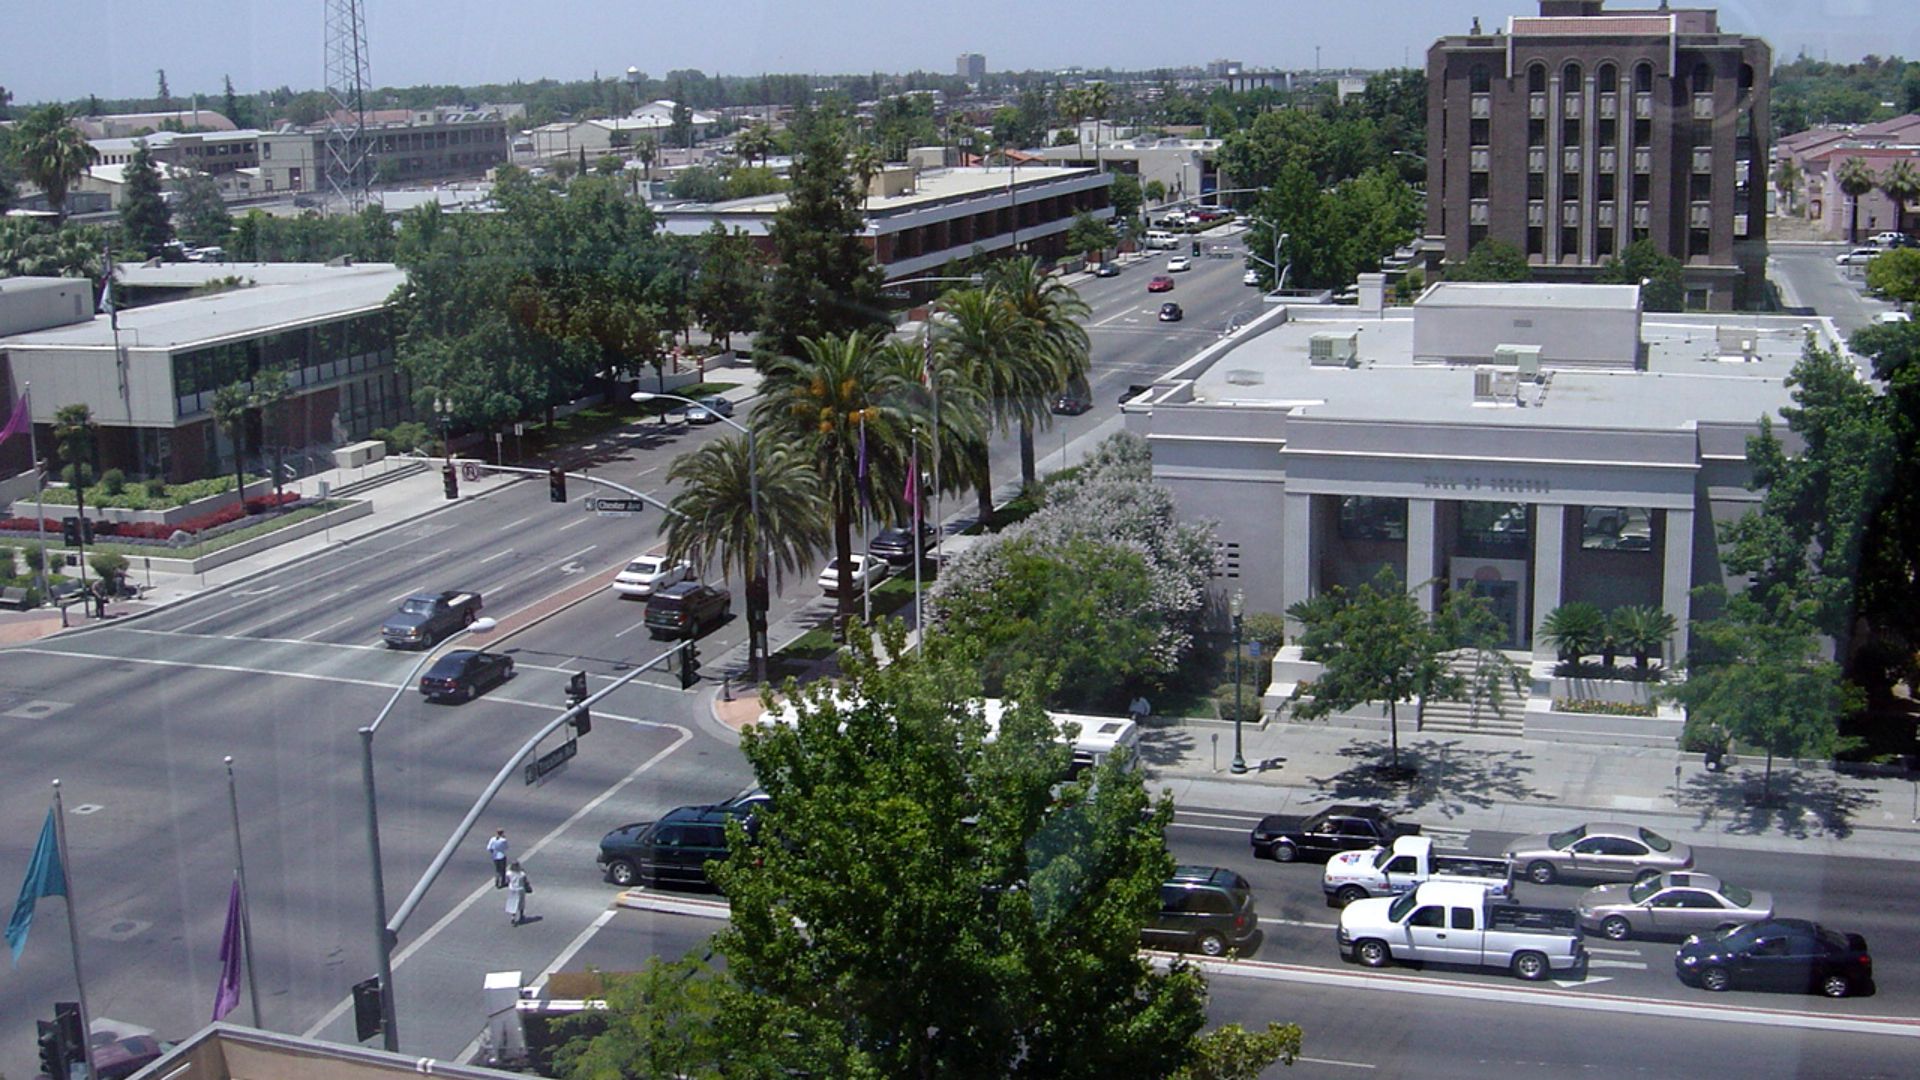
44: Bakersfield, California
Commute score: 28.4
Average commute time: 22.8 minutes
Congestion level: 16%
Public transit score: 27
45+ min commutes: 14.4%
Public transit in Bakersfield is sparse, making long drives nearly unavoidable.
 Bobak Ha'Eri, Wikimedia Commons
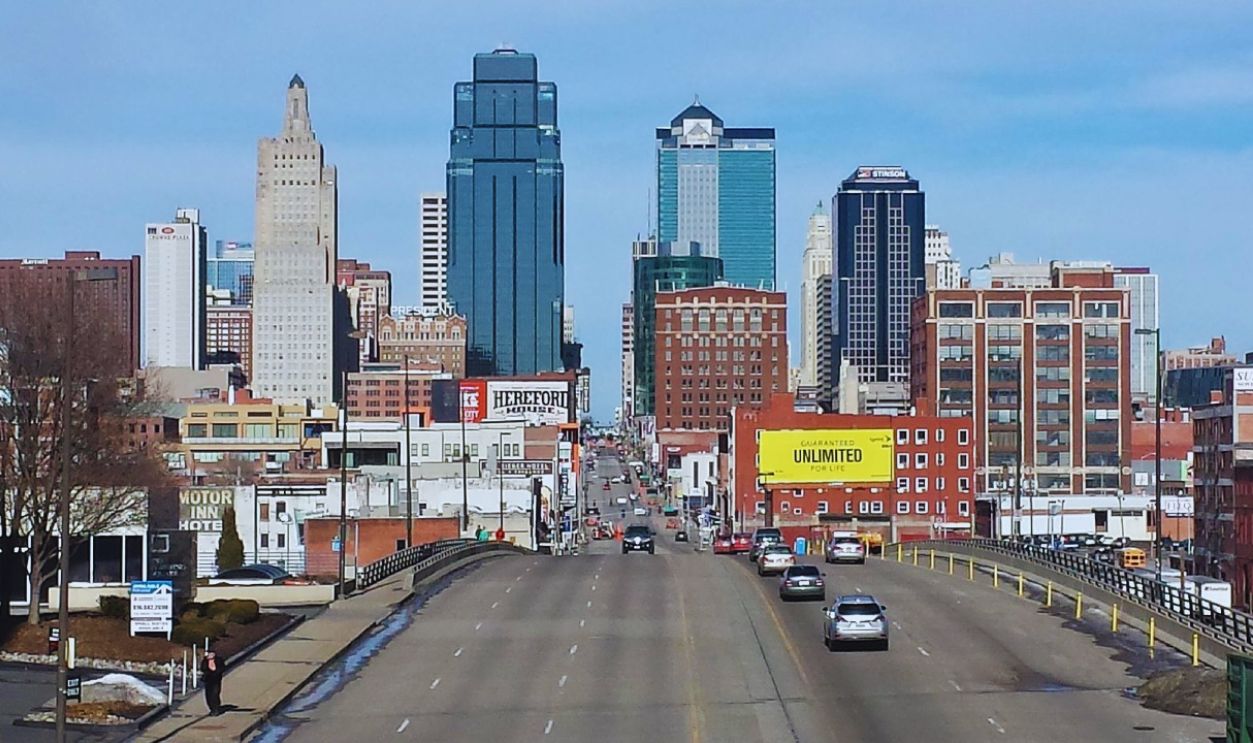
43: Kansas City, Missouri
Commute score: 29.1
Average commute time: 23.1 minutes
Congestion level: 18%
Public transit score: 28
45+ min commutes: 13.1%
This city faces a mix of long commutes, rising congestion, and underwhelming public transit options.
42: Minneapolis, Minnesota
Commute score: 29.2
Average commute time: 25.7 minutes
Congestion level: 21%
Public transit score: 58
45+ min commutes: 16.4%
This city faces a mix of long commutes, rising congestion, and underwhelming public transit options.

41: Cleveland, Ohio
Commute score: 29.3
Average commute time: 24.5 minutes
Congestion level: 18%
Public transit score: 45
45+ min commutes: 16.7%
Cleveland has infrastructure, but underfunded systems and aging transit options slow commuters down.

40: Raleigh, North Carolina
Commute score: 30.4
Average commute time: 24.7 minutes
Congestion level: 19%
Public transit score: 40
45+ min commutes: 14.9%
Raleigh’s fast growth is overwhelming its modest public transit system.
 Mark Turner, Wikimedia Commons
39: St. Louis, Missouri
Commute score: 30.7
Average commute time: 24.3 minutes
Congestion level: 19%
Public transit score: 37
45+ min commutes: 14.7%
St. Louis has light rail, but many areas remain underserved—especially outside the downtown core.
 Carlos Santa Maria, Adobe Stock
38: Cincinnati, Ohio
Commute score: 30.9
Average commute time: 24.2 minutes
Congestion level: 20%
Public transit score: 34
45+ min commutes: 13.2%
This city faces a mix of long commutes, rising congestion, and underwhelming public transit options.

37: Louisville, Kentucky
Commute score: 31.1
Average commute time: 24.2 minutes
Congestion level: 18%
Public transit score: 31
45+ min commutes: 14.2%
With few public transit options and growing urban sprawl, driving is the default—often to a fault.
 Grindstone Media Grp, Adobe Stock
36: Fresno, California
Commute score: 31.1
Average commute time: 23.6 minutes
Congestion level: 17%
Public transit score: 28
45+ min commutes: 14.9%
This city faces a mix of long commutes, rising congestion, and underwhelming public transit options.

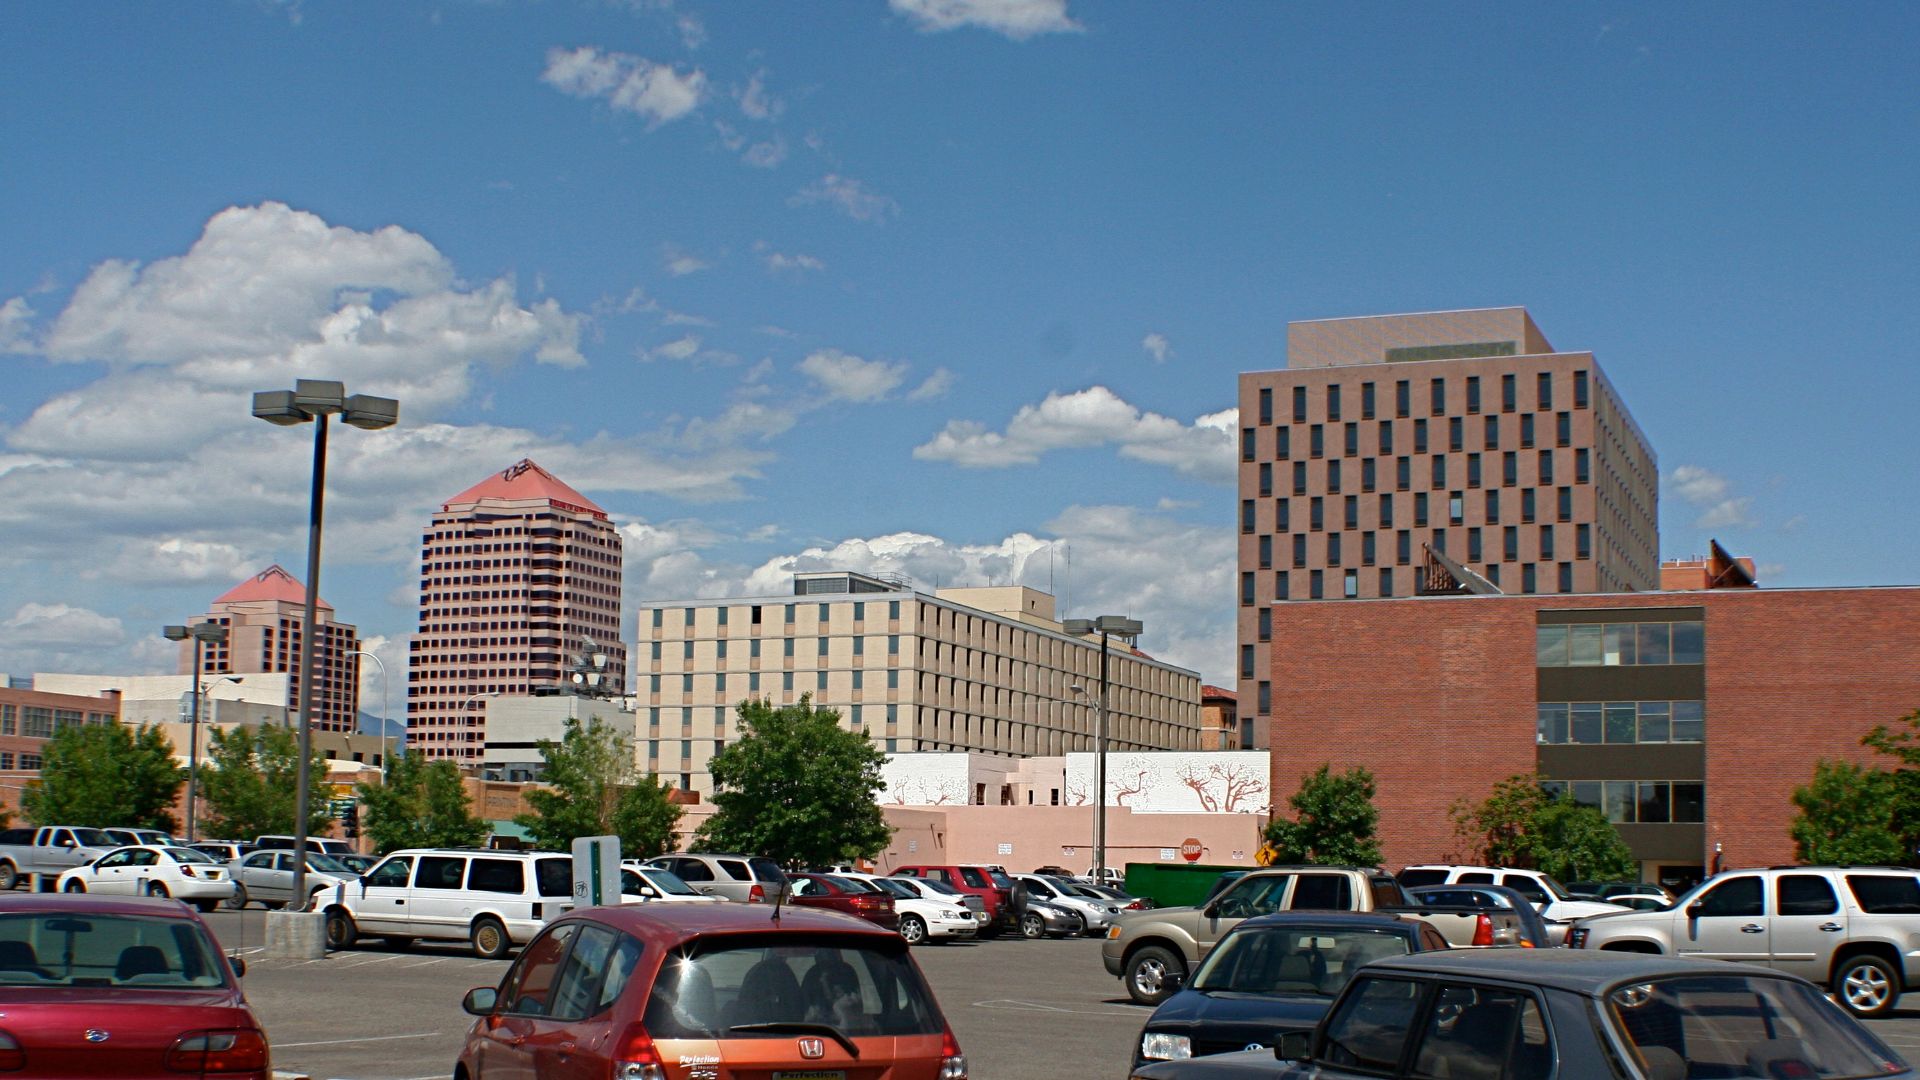
35: Albuquerque, New Mexico
Commute score: 31.2
Average commute time: 21.9 minutes
Congestion level: 17%
Public transit score: 29
45+ min commutes: 17.2%
This city faces a mix of long commutes, rising congestion, and underwhelming public transit options.
 Asaavedra32, Wikimedia Commons
34: Indianapolis, Indiana
Commute score: 32.4
Average commute time: 23.5 minutes
Congestion level: 19%
Public transit score: 27
45+ min commutes: 13.9%
Indianapolis is expanding, but its car-centric design and weak bus system can’t keep up.
 Nicholas J. Klein, Adobe Stock
33: Pittsburgh, Pennsylvania
Commute score: 32.7
Average commute time: 26.1 minutes
Congestion level: 20%
Public transit score: 48
45+ min commutes: 16.5%
This city faces a mix of long commutes, rising congestion, and underwhelming public transit options.

32: El Paso, Texas
Commute score: 32.9
Average commute time: 22.1 minutes
Congestion level: 18%
Public transit score: 26
45+ min commutes: 16.5%
El Paso’s compact commutes are offset by poor public transit and a reliance on car travel for most residents.

31: Oklahoma City, Oklahoma
Commute score: 33.0
Average commute time: 21.9 minutes
Congestion level: 17%
Public transit score: 19
45+ min commutes: 15.6%
Oklahoma City is built for cars, and public transit remains too limited to help the average worker.
 Nicholas J. Klein, Adobe Stock
30: Columbus, Ohio
Commute score: 34.0
Average commute time: 23.6 minutes
Congestion level: 20%
Public transit score: 31
45+ min commutes: 15.3%
Columbus relies mostly on buses, but limited routes and infrequent service add frustration to daily travel.
 Nicholas J. Klein, Adobe Stock
29: Sacramento, California
Commute score: 37.1
Average commute time: 27.4 minutes
Congestion level: 21%
Public transit score: 33
45+ min commutes: 12.9%
This city faces a mix of long commutes, rising congestion, and underwhelming public transit options.
 Quintin Soloviev, CC BY 4.0, Wikimedia Commons
28: San Antonio, Texas
Commute score: 39.0
Average commute time: 25.7 minutes
Congestion level: 21%
Public transit score: 30
45+ min commutes: 15.4%
San Antonio’s lack of rail and growing suburban sprawl means long waits and longer drives.

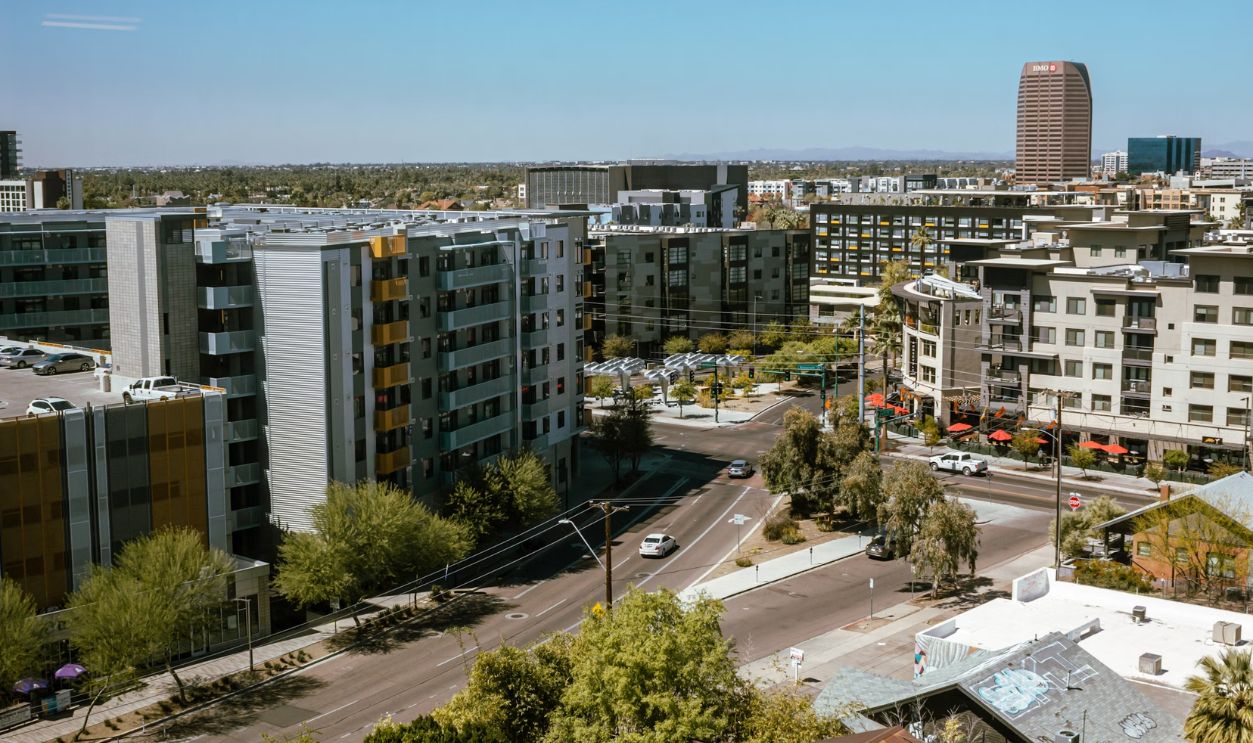
27: Phoenix, Arizona
Commute score: 39.4
Average commute time: 26.5 minutes
Congestion level: 22%
Public transit score: 32
45+ min commutes: 14.5%
Phoenix struggles with sprawl and a limited light rail network, making commutes frustrating for many.
26: Charlotte, North Carolina
Commute score: 39.9
Average commute time: 26.2 minutes
Congestion level: 20%
Public transit score: 35
45+ min commutes: 17.9%
Charlotte’s traffic issues keep growing, while its small light rail system reaches too few areas.
 Precisionviews, CC BY-SA 4.0, Wikimedia Commons
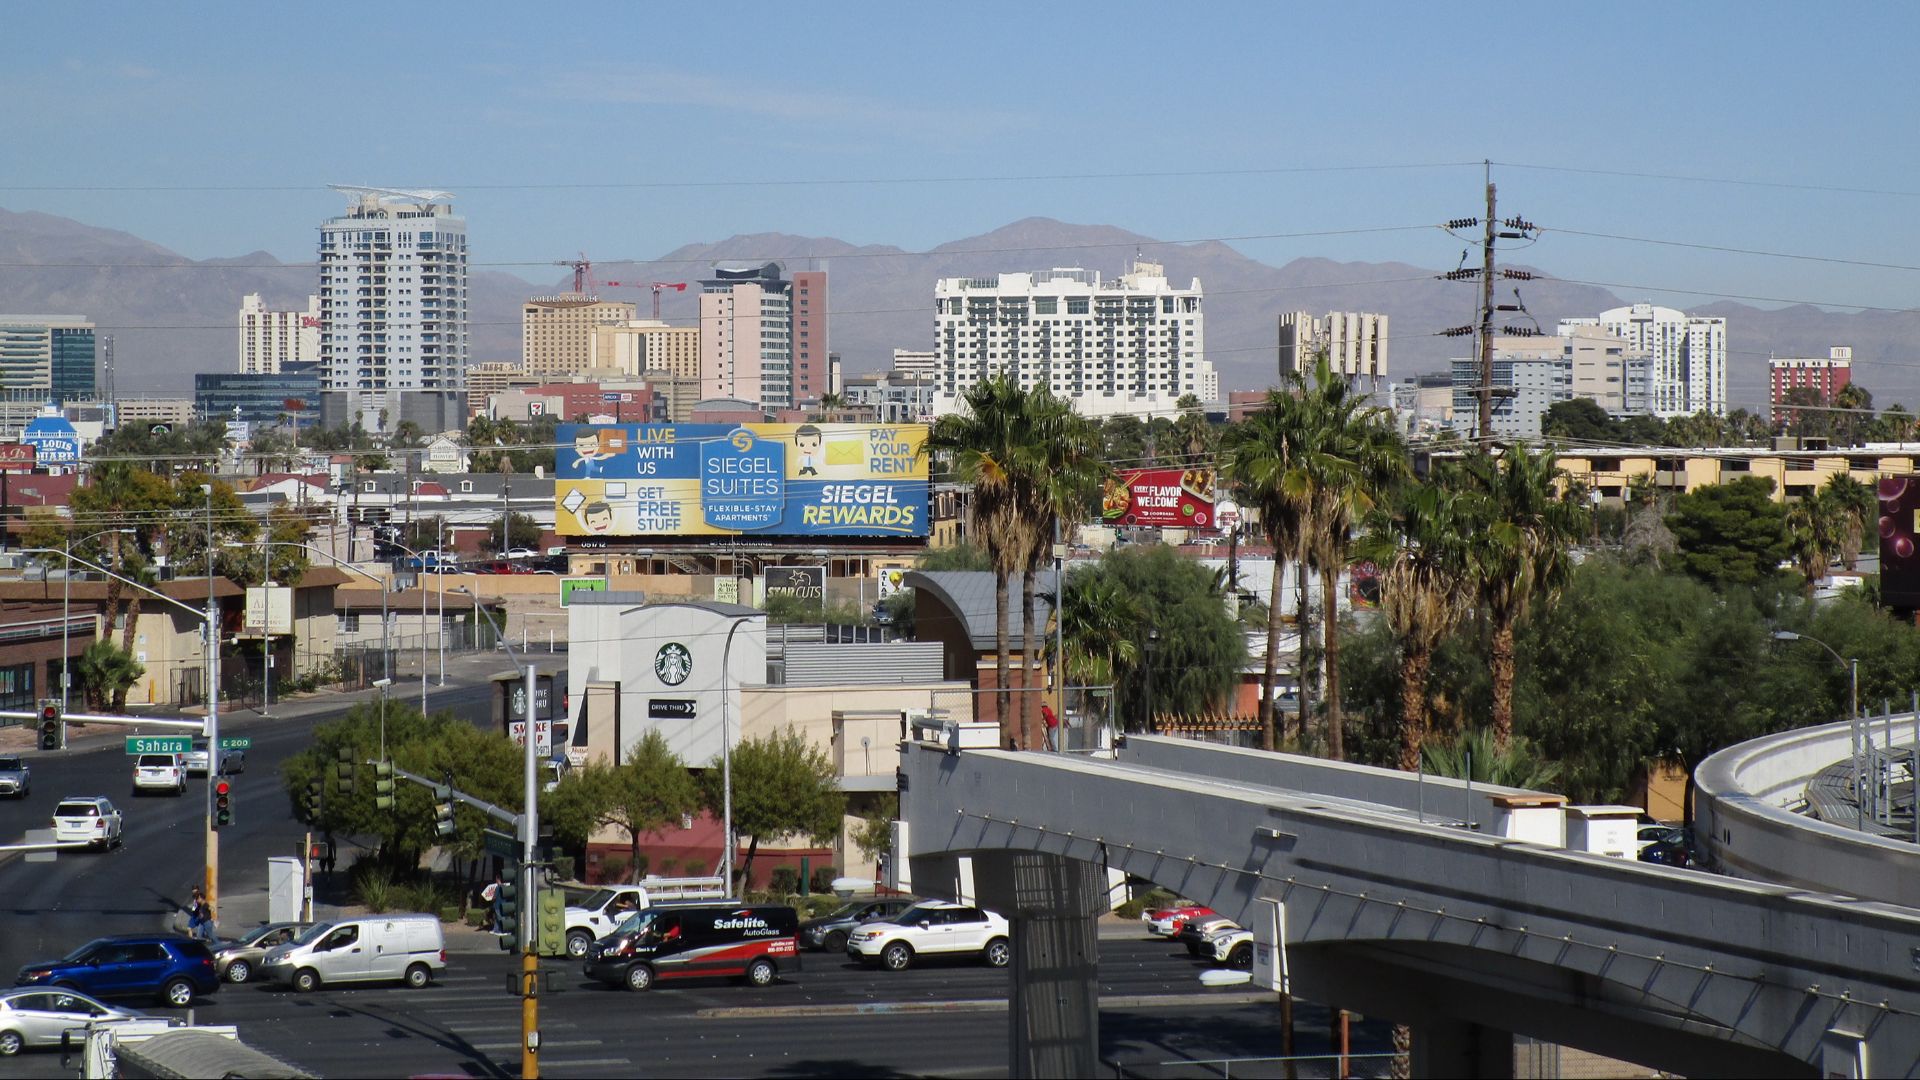
25: Las Vegas, Nevada
Commute score: 41.2
Average commute time: 27.1 minutes
Congestion level: 21%
Public transit score: 36
45+ min commutes: 17.2%
Las Vegas is not just for tourists—residents face long commutes and limited options beyond buses.
 Reinhard Link from Germany, Wikimedia Commons
24: Boston, Massachusetts
Commute score: 41.8
Average commute time: 30.2 minutes
Congestion level: 27%
Public transit score: 72
45+ min commutes: 19.4%
Boston’s MBTA system is widespread—but chronic delays and breakdowns hurt overall efficiency.

23: Denver, Colorado
Commute score: 42.2
Average commute time: 27.5 minutes
Congestion level: 24%
Public transit score: 47
45+ min commutes: 18.1%
This city faces a mix of long commutes, rising congestion, and underwhelming public transit options.

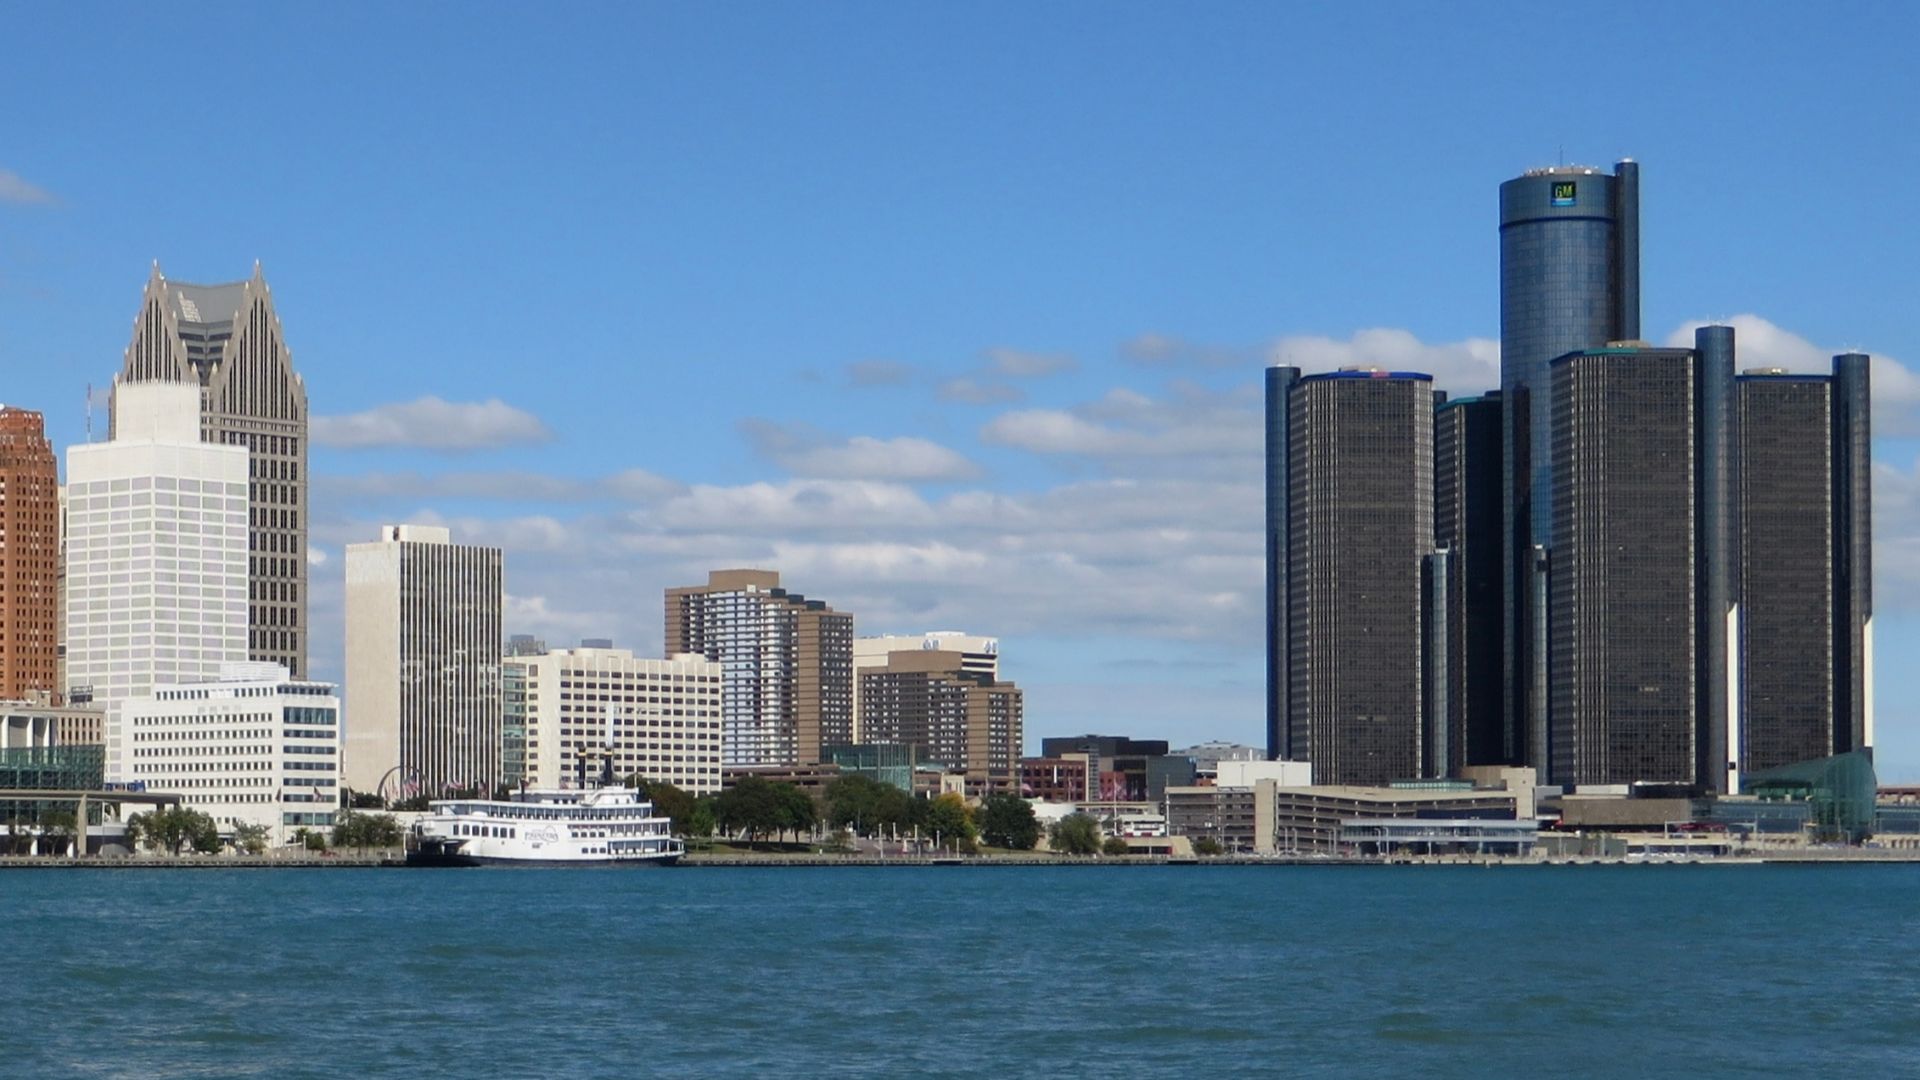
22: Detroit, Michigan
Commute score: 43.5
Average commute time: 27.6 minutes
Congestion level: 22%
Public transit score: 44
45+ min commutes: 19.8%
Detroit’s low congestion hides a bigger issue—public transit struggles and long commutes persist.
 Ken Lund from Reno, Nevada, USA, Wikimedia Commons
21: Baltimore, Maryland
Commute score: 43.7
Average commute time: 30.2 minutes
Congestion level: 25%
Public transit score: 57
45+ min commutes: 18.2%
This city faces a mix of long commutes, rising congestion, and underwhelming public transit options.

20: Jacksonville, Florida
Commute score: 43.8
Average commute time: 26.4 minutes
Congestion level: 21%
Public transit score: 23
45+ min commutes: 16.1%
Jacksonville is huge geographically, and with few rail options, commutes are often long and draining.
 Felix Mizioznikov, Adobe Stock
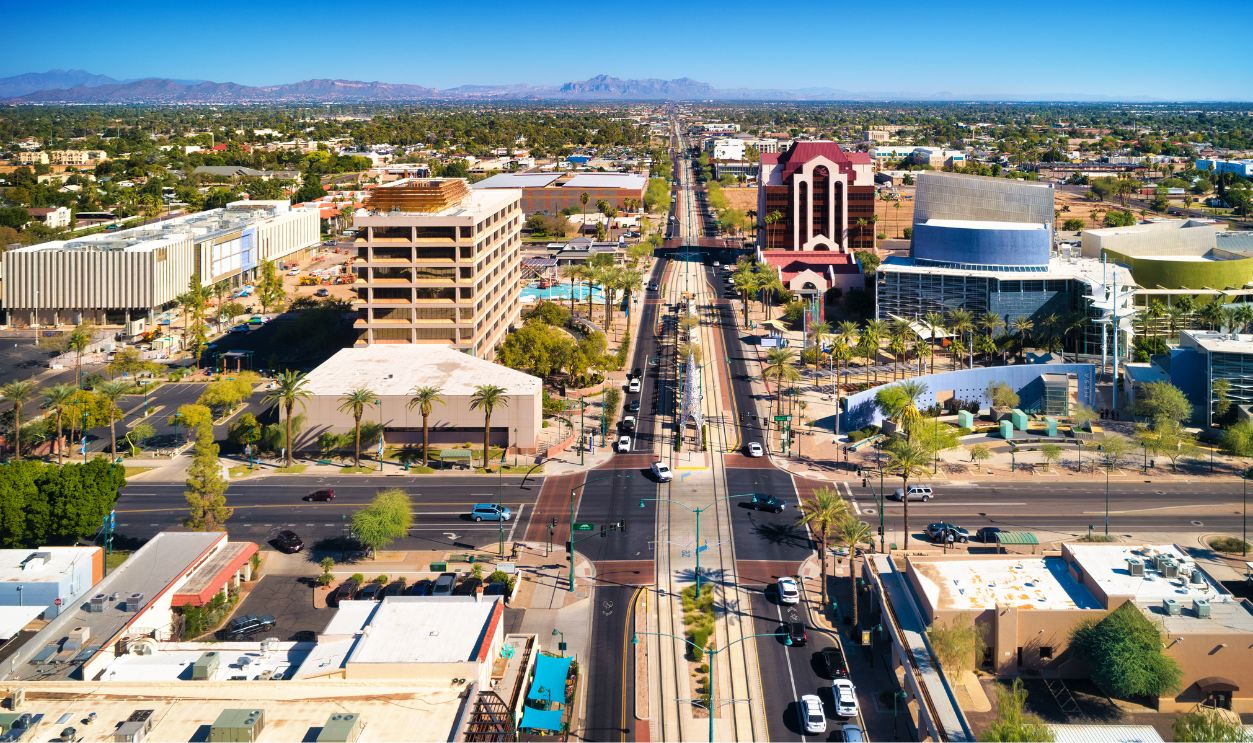
19: Mesa, Arizona
Commute score: 44.2
Average commute time: 25.6 minutes
Congestion level: 21%
Public transit score: 23
45+ min commutes: 17.3%
Mesa’s distance from Phoenix and limited connectivity force long daily drives across the desert.
18: Tampa, Florida
Commute score: 45.6
Average commute time: 27.4 minutes
Congestion level: 23%
Public transit score: 33
45+ min commutes: 17.5%
Tampa's transit system is playing catch-up to a booming population and worsening congestion.
 Clement Bardot, CC BY-SA 4.0, Wikimedia Commons
17: Fort Worth, Texas
Commute score: 46.3
Average commute time: 26.3 minutes
Congestion level: 23%
Public transit score: 28
45+ min commutes: 17.8%
This city faces a mix of long commutes, rising congestion, and underwhelming public transit options.

16: Austin, Texas
Commute score: 47.2
Average commute time: 28.3 minutes
Congestion level: 25%
Public transit score: 42
45+ min commutes: 18.5%
Austin’s booming growth has led to clogged roads and public transit that hasn’t caught up.

15: San Diego, California
Commute score: 47.2
Average commute time: 28.5 minutes
Congestion level: 24%
Public transit score: 39
45+ min commutes: 18.3%
San Diego boasts ocean views, but also long travel times and inconsistent transit service.
 Crown Point Design, Adobe Stock
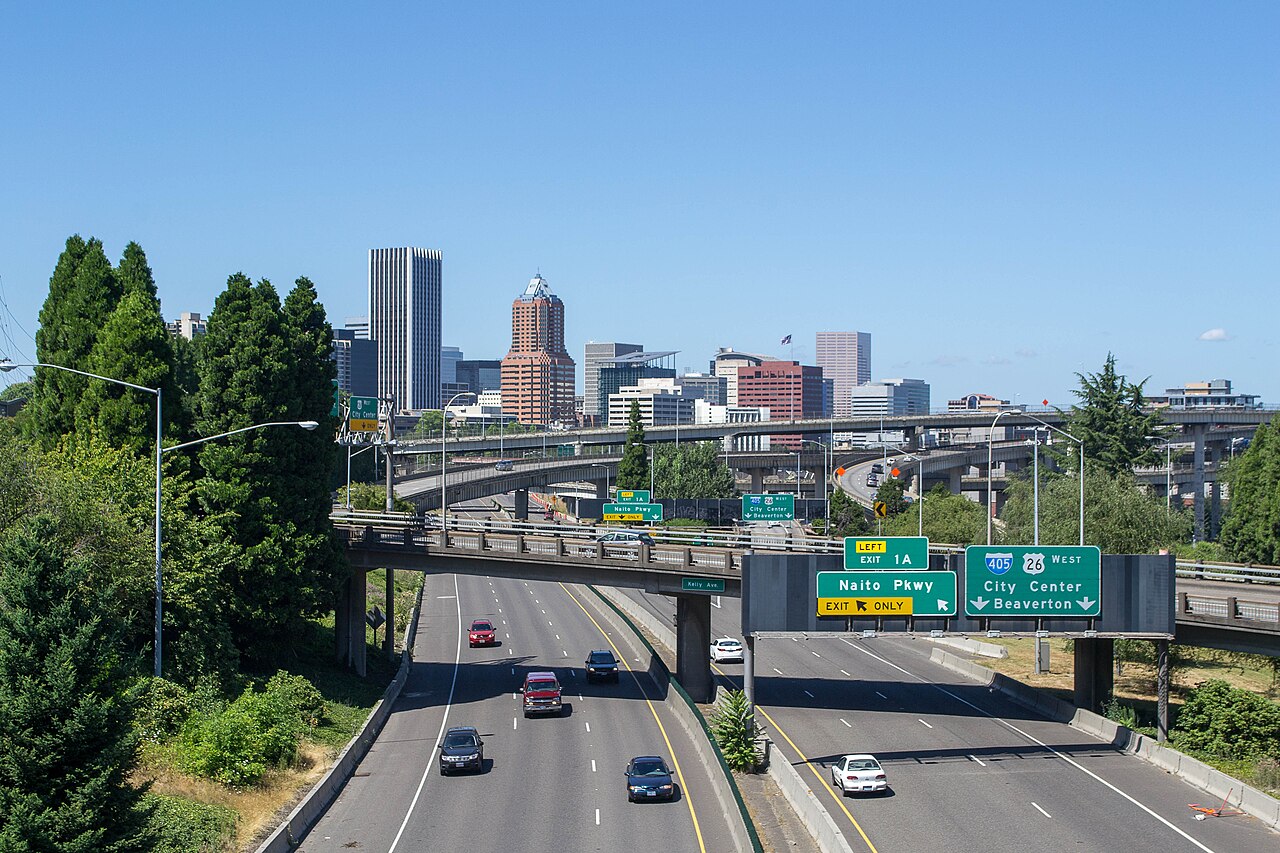
14: Portland, Oregon
Commute score: 48.4
Average commute time: 29.5 minutes
Congestion level: 26%
Public transit score: 52
45+ min commutes: 20.1%
Portland has solid transit options, but congestion and rising commute times are worsening.
 Visitor7, CC BY-SA 3.0, Wikimedia Commons
13: Nashville, Tennessee
Commute score: 48.7
Average commute time: 27.3 minutes
Congestion level: 25%
Public transit score: 25
45+ min commutes: 15.8%
This city faces a mix of long commutes, rising congestion, and underwhelming public transit options.

12: Arlington, Texas
Commute score: 50.2
Average commute time: 26.5 minutes
Congestion level: 22%
Public transit score: 18
45+ min commutes: 18.4%
This city faces a mix of long commutes, rising congestion, and underwhelming public transit options.
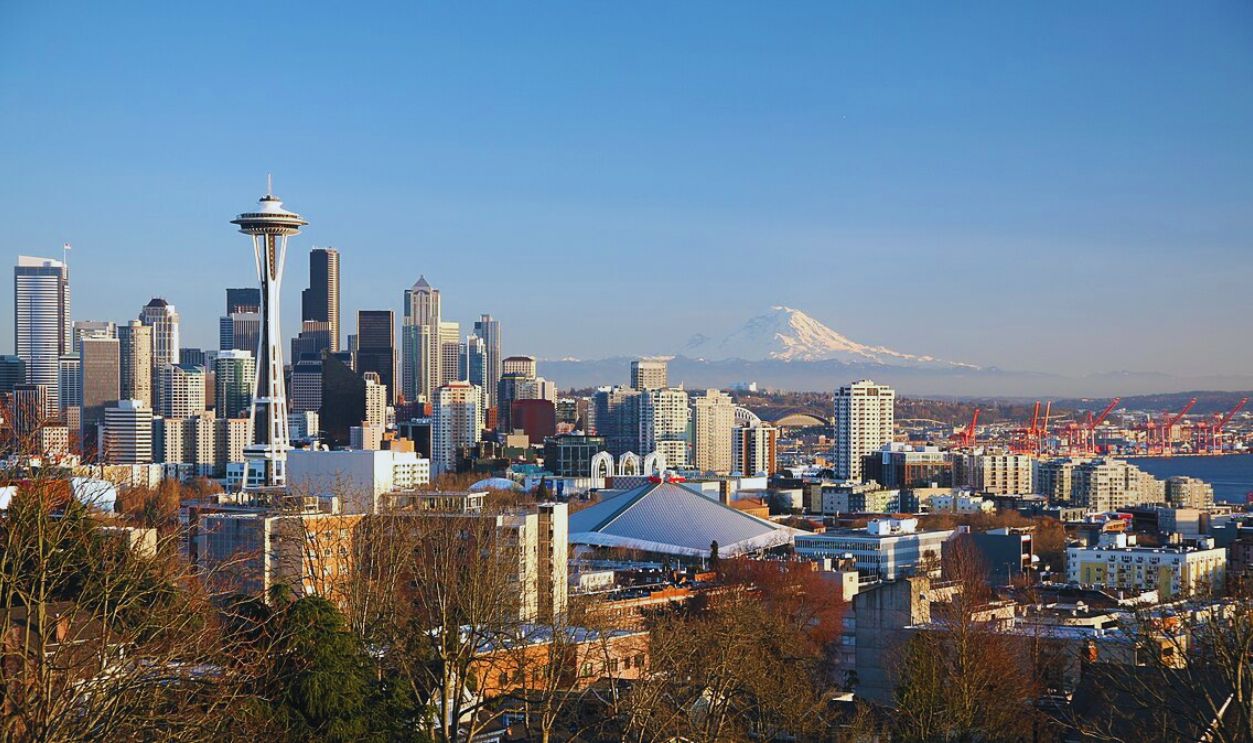
11: Seattle, Washington
Commute score: 50.7
Average commute time: 30.9 minutes
Congestion level: 28%
Public transit score: 60
45+ min commutes: 20.8%
Seattle has expanded its light rail, but bridge bottlenecks and traffic slow everyone down.
 Daniel Schwen, CC BY-SA 4.0, Wikimedia Commons
10: Philadelphia, Pennsylvania
Commute score: 50.8
Average commute time: 31.5 minutes
Congestion level: 29%
Public transit score: 68
45+ min commutes: 21.7%
Philadelphia has extensive public transit, but it's known for delays and aging infrastructure.

9: Houston, Texas
Commute score: 52.5
Average commute time: 29.8 minutes
Congestion level: 26%
Public transit score: 38
45+ min commutes: 18.7%
Houston has one of the worst combinations: long drive times, sprawling layout, and unreliable transit.
 Carol M. Highsmith,Wikimedia Commons
8: Miami, Florida
Commute score: 58.3
Average commute time: 31.7 minutes
Congestion level: 30%
Public transit score: 55
45+ min commutes: 22.3%
Miami combines heat, traffic, and slow rail service into one messy commute.

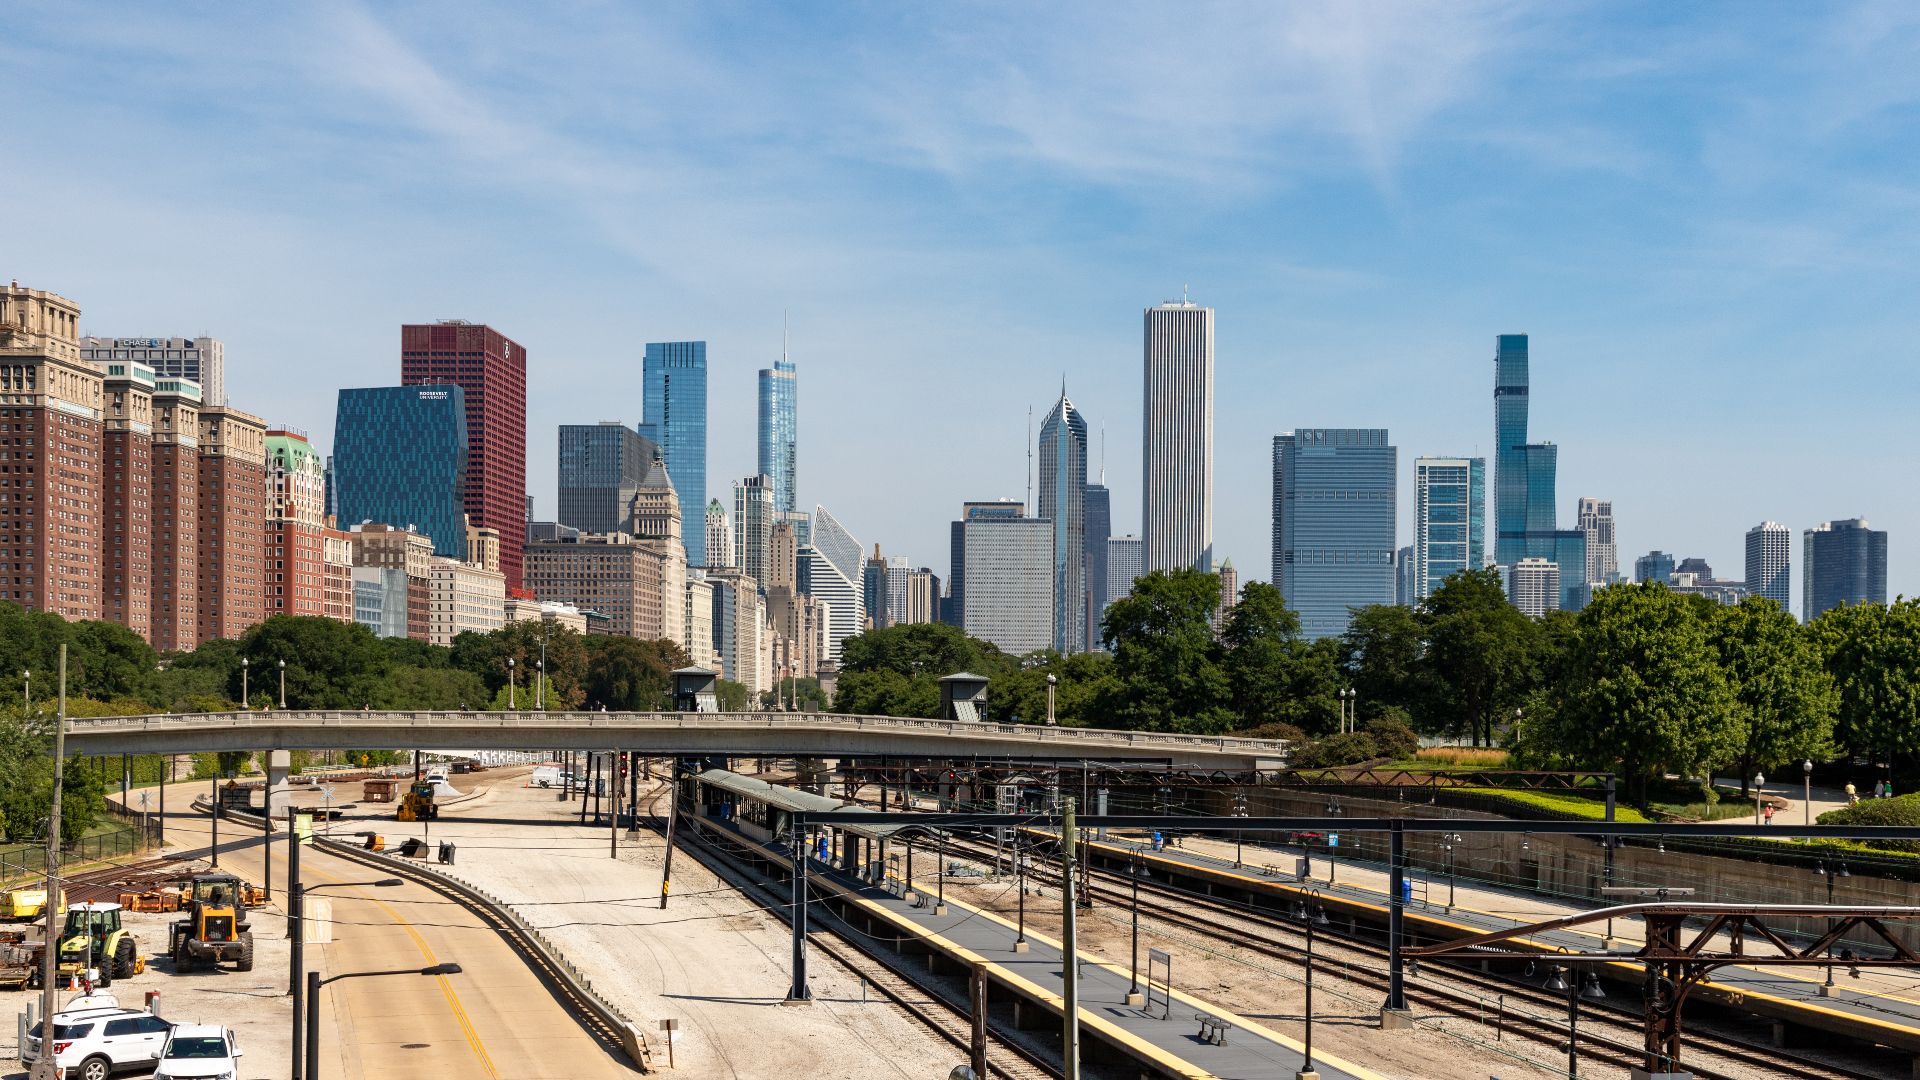
7: Chicago, Illinois
Commute score: 59.3
Average commute time: 33.2 minutes
Congestion level: 31%
Public transit score: 65
45+ min commutes: 23.4%
Chicago’s commute options are plentiful, but inconsistent service and gridlock are big problems.
 Paul R. Burley, Wikimedia Commons
6: San Francisco, California
Commute score: 59.7
Average commute time: 34.6 minutes
Congestion level: 32%
Public transit score: 80
45+ min commutes: 25.6%
San Francisco has transit access, but high congestion and crowding make every trip a chore.
 Sharon Hahn Darlin, CC BY 2.0, Wikimedia Commons
5: Los Angeles, California
Commute score: 63.5
Average commute time: 31.4 minutes
Congestion level: 34%
Public transit score: 49
45+ min commutes: 21.2%
Los Angeles still lives up to its traffic reputation—especially for those outside the Metro’s reach.
 Christophe.Finot, Wikimedia Commons
4: Washington, D.C.
Commute score: 64.4
Average commute time: 34.3 minutes
Congestion level: 34%
Public transit score: 75
45+ min commutes: 26.2%
Washington, D.C.’s Metro system faces frequent delays and its roads are famously clogged.

3: Atlanta, Georgia
Commute score: 67.5
Average commute time: 32.5 minutes
Congestion level: 33%
Public transit score: 50
45+ min commutes: 24.1%
Atlanta’s highways are legendary for gridlock, and MARTA serves only a slice of commuters.

2: New York, New York
Commute score: 75.0
Average commute time: 40.8 minutes
Congestion level: 35%
Public transit score: 81
45+ min commutes: 27.5%
New Yorkers endure the longest commutes in the nation—even with the subway, there’s no escape.

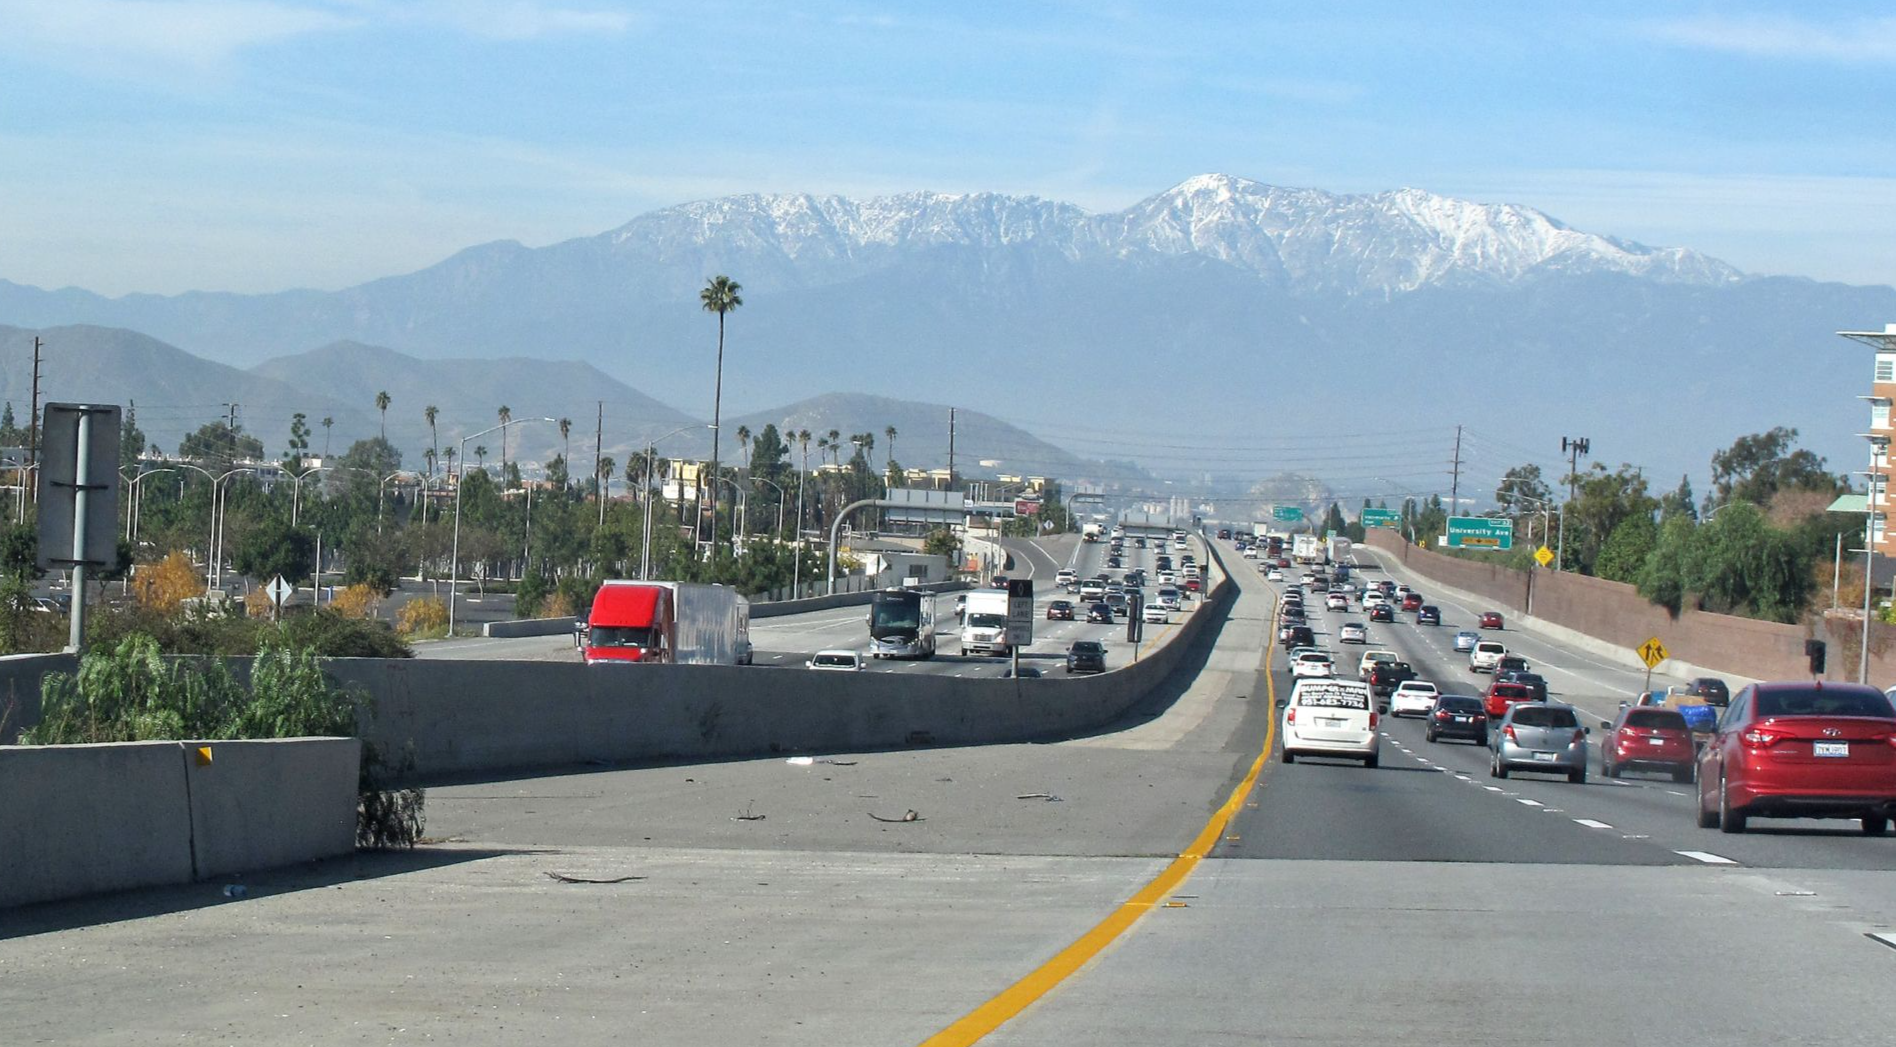
1: Riverside, California
Commute score: 76.2
Average commute time: 31.6 minutes
Congestion level: 29%
Public transit score: 22
45+ min commutes: 26.9%
Riverside residents face punishing commutes into nearby job centers like LA—with almost no rail help.
 Downtowngal, Wikimedia Commons
You Might Also Like:
Ranking The U.S. States With The Most UFO Sightings—According To Reports
The States With The Worst Roads—Ranked According To Data (And Drivers)
Ranking The States With The Worst Infrastructure In America—According To Data
Sources: 1, 2, 3


