

The United States of Broke
Rising costs, stagnant wages, and growing debt have made it harder than ever for Americans to stay financially afloat. But depending on where you live, your odds of going broke might be much higher than you think.
We combined fresh data on income, debt, bankruptcy rates, cost of living, and savings buffers to rank the states where residents are most at risk of financial collapse in 2026.
And they are...
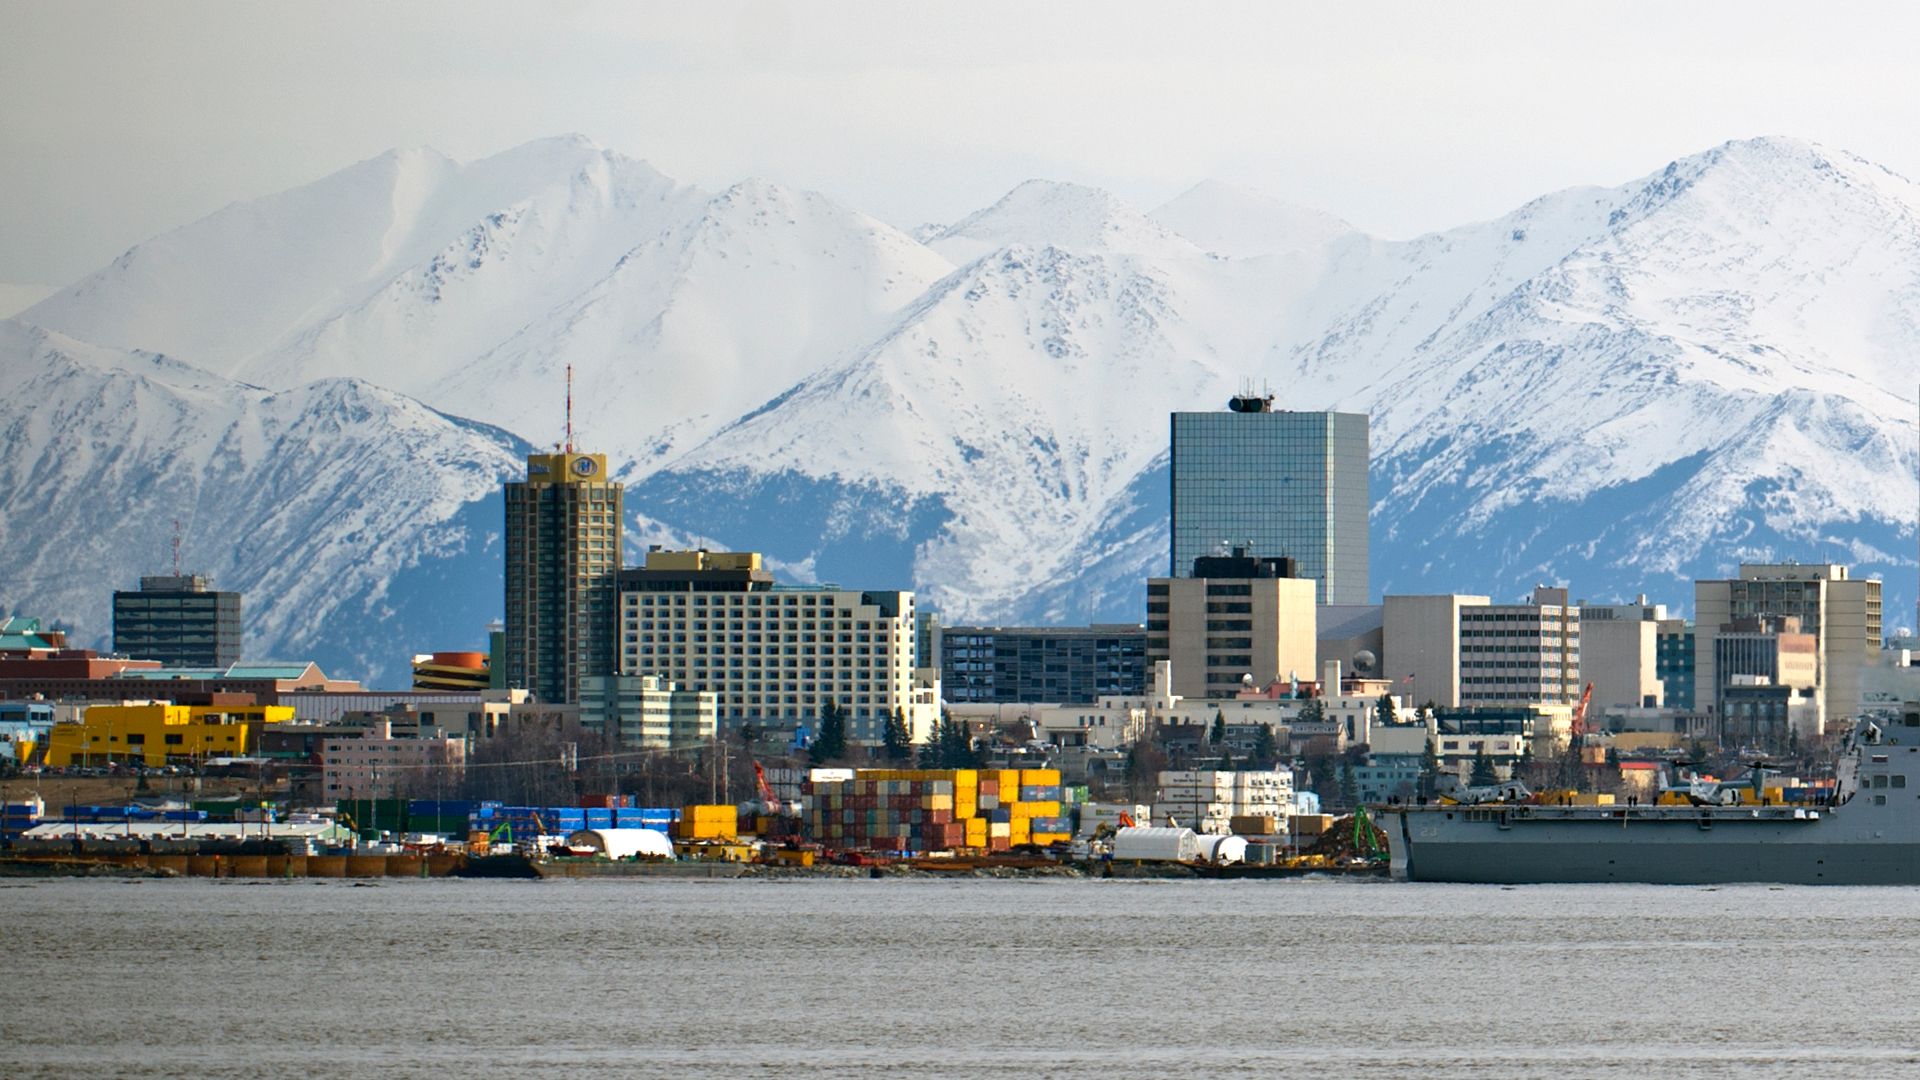
 30: Alaska
Median income: High vs. U.S.; volatile year-to-year
Average debt per resident: Above U.S. average
Bankruptcy rate: Low–moderate
Cost of living: Well above U.S. average
Liquid-asset poverty: Mid-high tier
A strong income is blunted by sky-high prices and heavy household balances—especially vehicles and mortgages.
 Jack Connaher, Wikimedia Commons
29: Colorado
Median income: Above average
Average debt per resident: High (mortgage-heavy)
Bankruptcy rate: Low–moderate
Cost of living: Above U.S. average
Liquid-asset poverty: Mid tier
Boomtown costs and big leverage can still sink middle-income households without robust cash buffers.

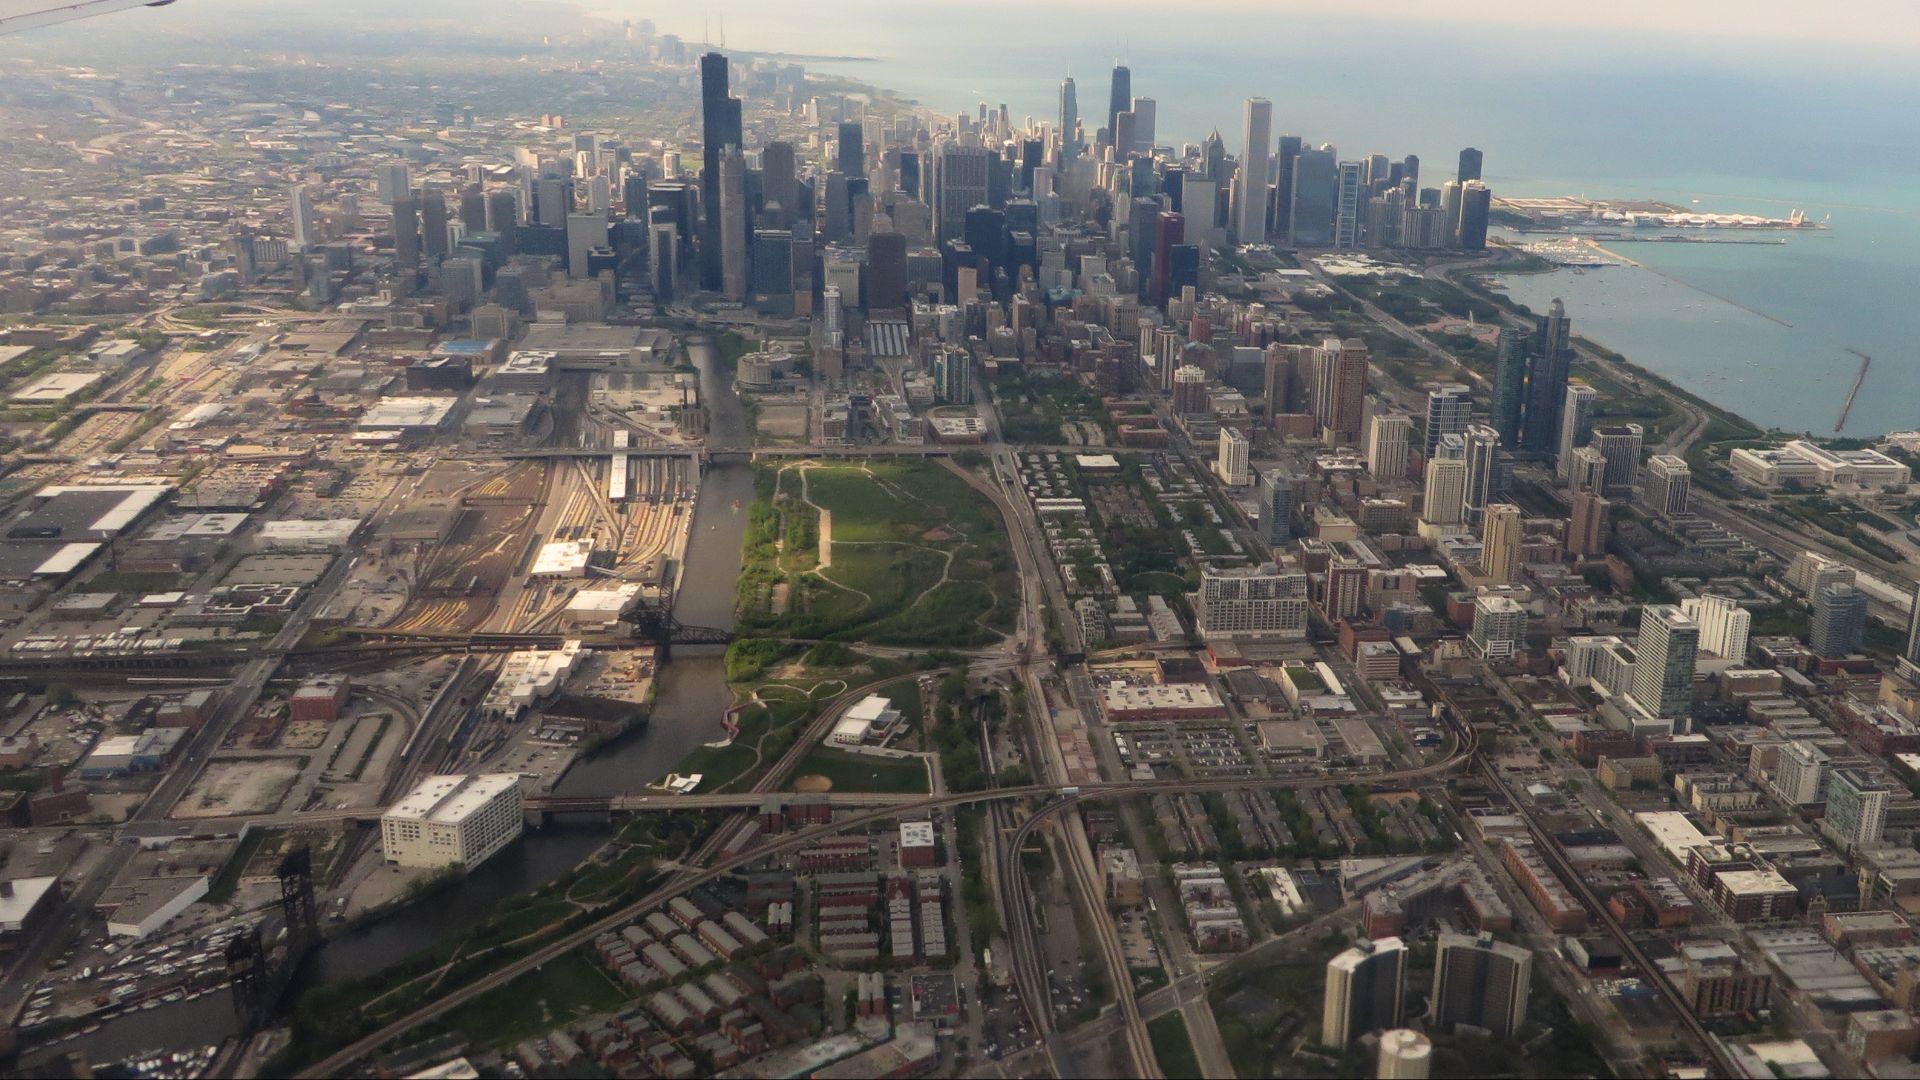
28: Illinois
Median income: Near U.S. average
Average debt per resident: High
Bankruptcy rate: High (relative to peers)
Cost of living: Slightly above U.S.
Liquid-asset poverty: Mid-high tier
Chicago-area expenses and higher filing activity keep financial stress elevated.
 Ken Lund from Reno, Nevada, USA, Wikimedia Commons
27: Washington
Median income: High
Average debt per resident: High
Bankruptcy rate: Low
Cost of living: Above U.S. average
Liquid-asset poverty: Mid tier
Tech wages help, but housing and consumer balances leave many one bad month from red.
 Carol M. Highsmith, Wikimedia Commons
26: Oregon
Median income: Near-above average
Average debt per resident: High
Bankruptcy rate: Mid
Cost of living: Above U.S. average
Liquid-asset poverty: Mid-high tier
Price levels and card balances keep budgets taut even with decent pay.
 Fcb981, edit by --Digon3 talk, Wikimedia Commons
25: Pennsylvania
Median income: Near U.S. average
Average debt per resident: Mid-high
Bankruptcy rate: Mid
Cost of living: Near U.S.
Liquid-asset poverty: Mid-high tier
Stable incomes meet rising non-mortgage debt and thin rainy-day funds.
 Popscreenshot, Wikimedia Commons
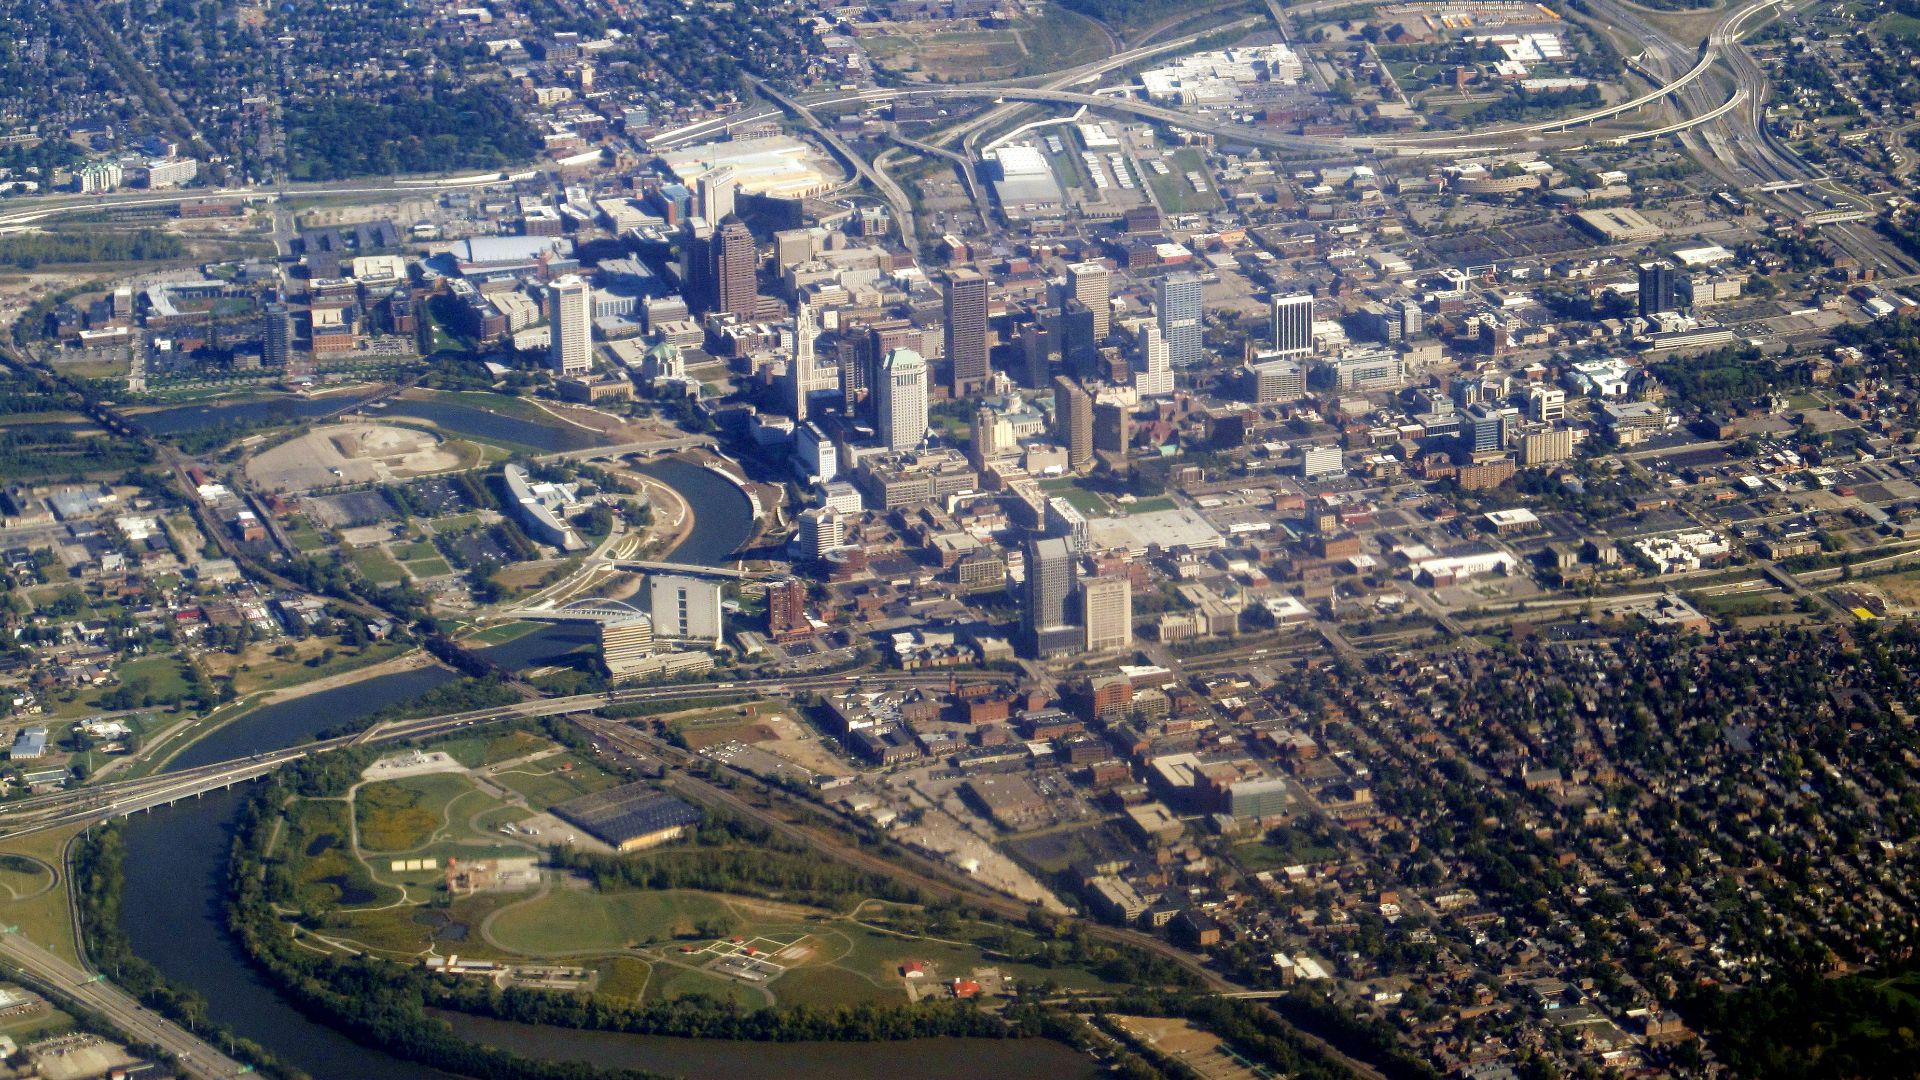
24: Ohio
Median income: Below U.S. average
Average debt per resident: Mid
Bankruptcy rate: High
Cost of living: Below U.S.
Liquid-asset poverty: High tier
Lower prices help, but filing rates and limited liquidity elevate risk.
 Pi.1415926535, Wikimedia Commons
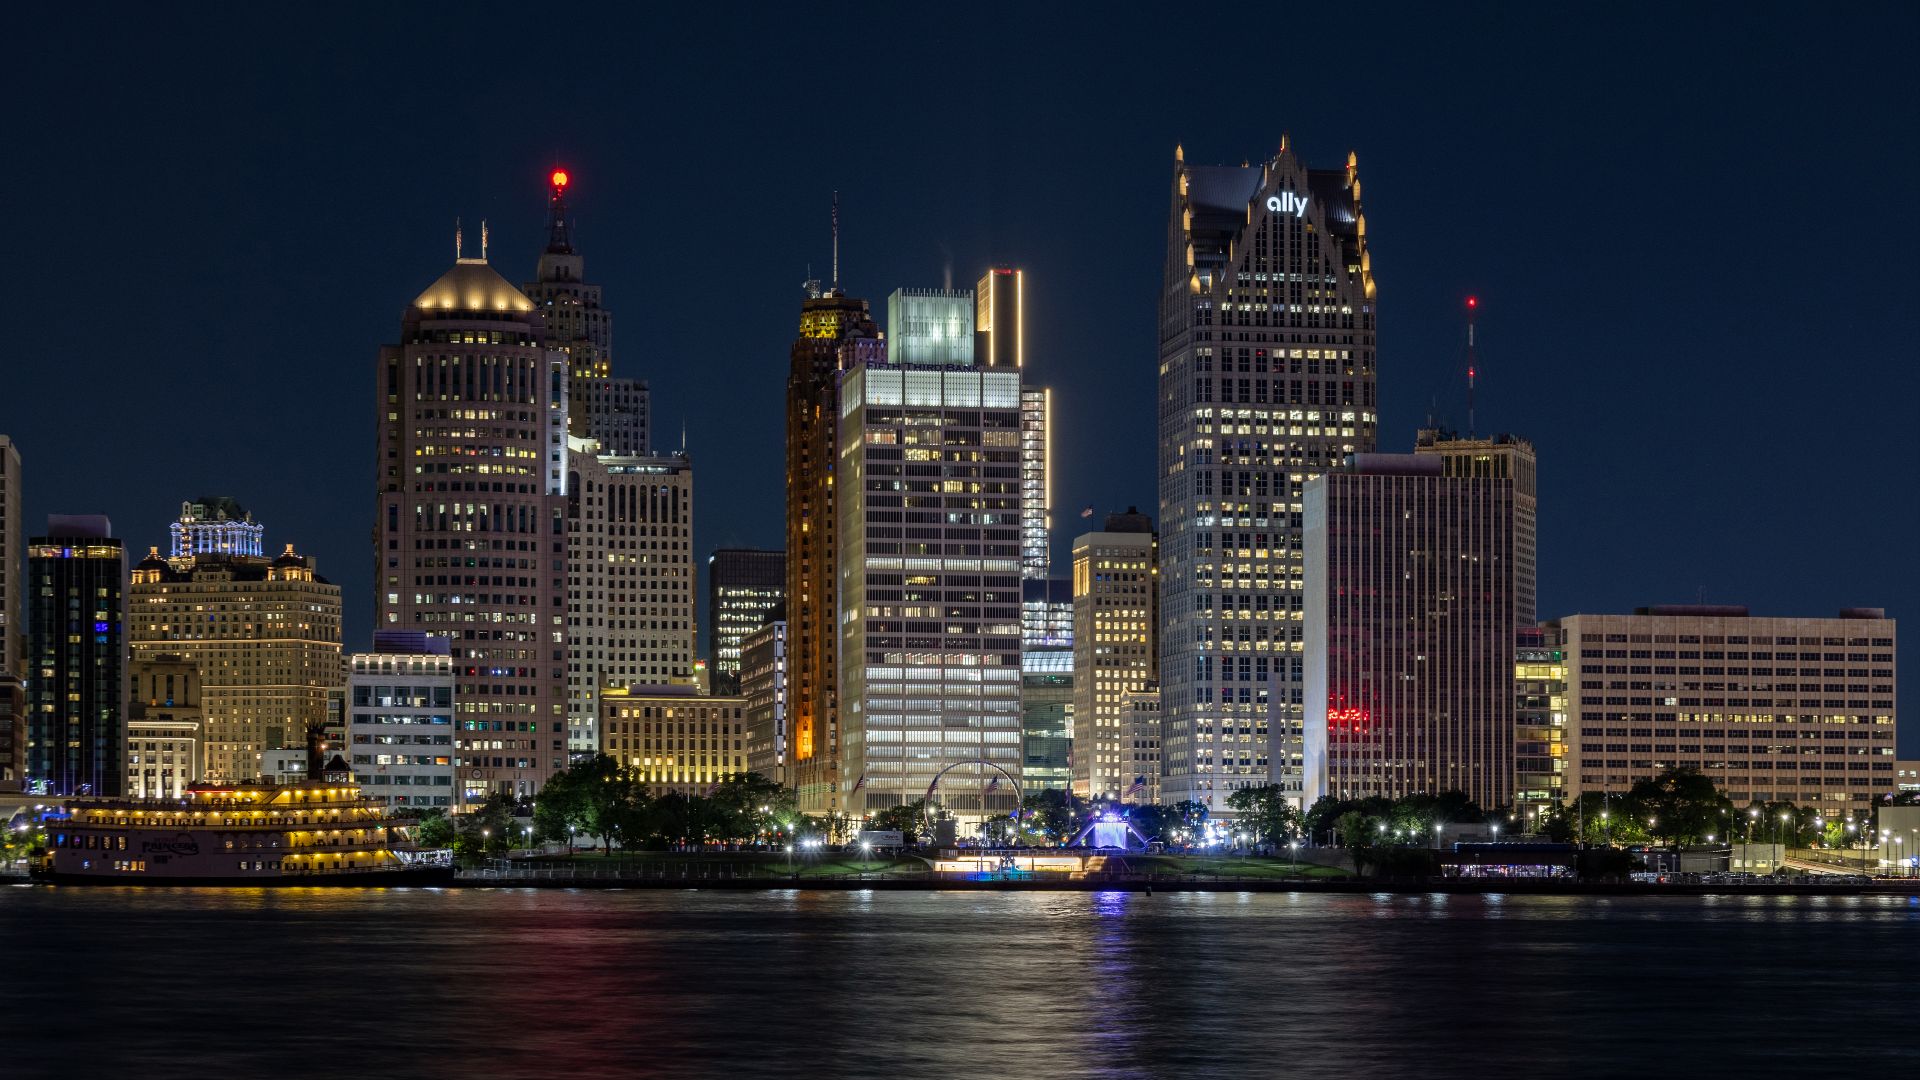
23: Michigan
Median income: Near U.S. average
Average debt per resident: Mid-high (auto-heavy)
Bankruptcy rate: High
Cost of living: Below–near U.S.
Liquid-asset poverty: High tier
Auto debt and higher filings keep cash flow fragile.
 Crisco 1492, Wikimedia Commons
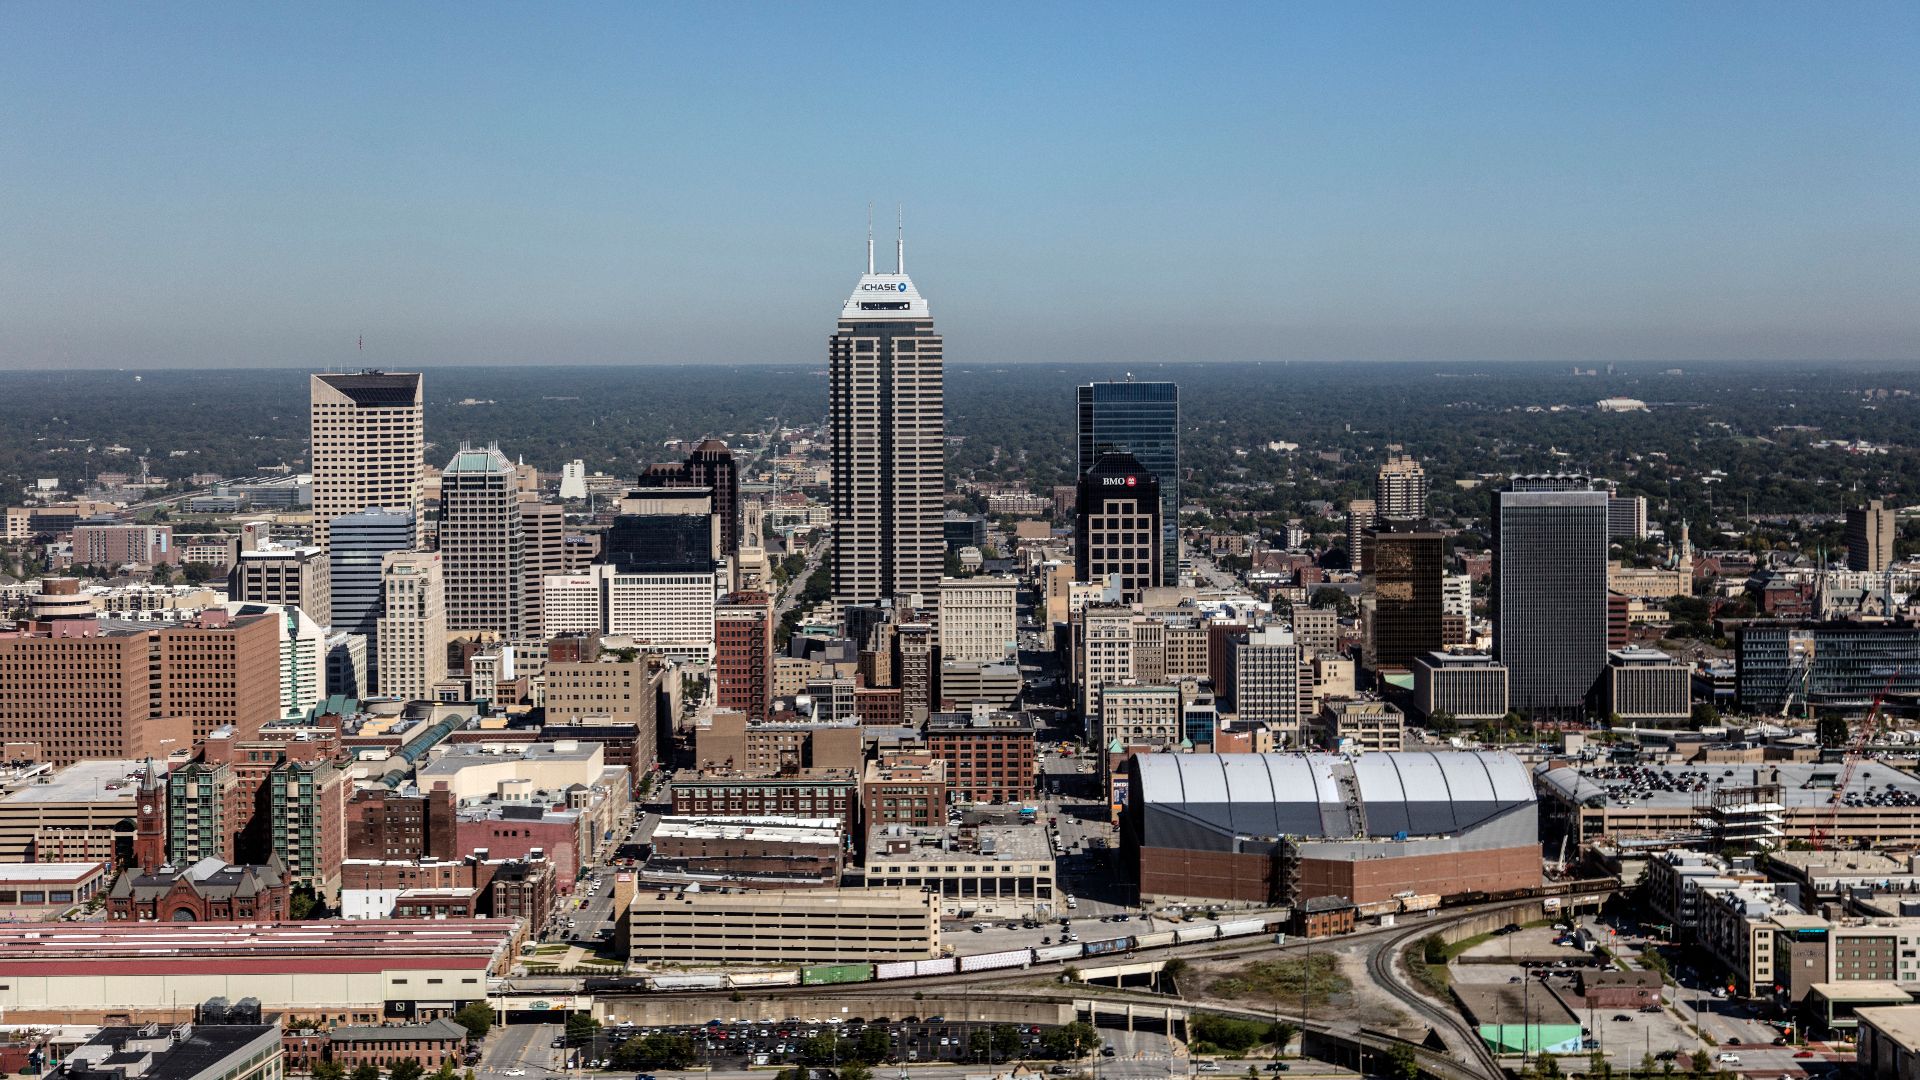
22: Indiana
Median income: Below U.S. average
Average debt per resident: Mid
Bankruptcy rate: High
Cost of living: Below U.S.
Liquid-asset poverty: High tier
Cheap living can’t fully offset weak cushions and filing intensity.
 Carol M. Highsmith, Wikimedia Commons
21: North Carolina
Median income: Near U.S.
Average debt per resident: Mid-high
Bankruptcy rate: Mid
Cost of living: Near U.S. (rising metros)
Liquid-asset poverty: Mid-high tier
Fast-growing metros bring higher bills; many households remain cash-light.
 Harrison Keely, Wikimedia Commons
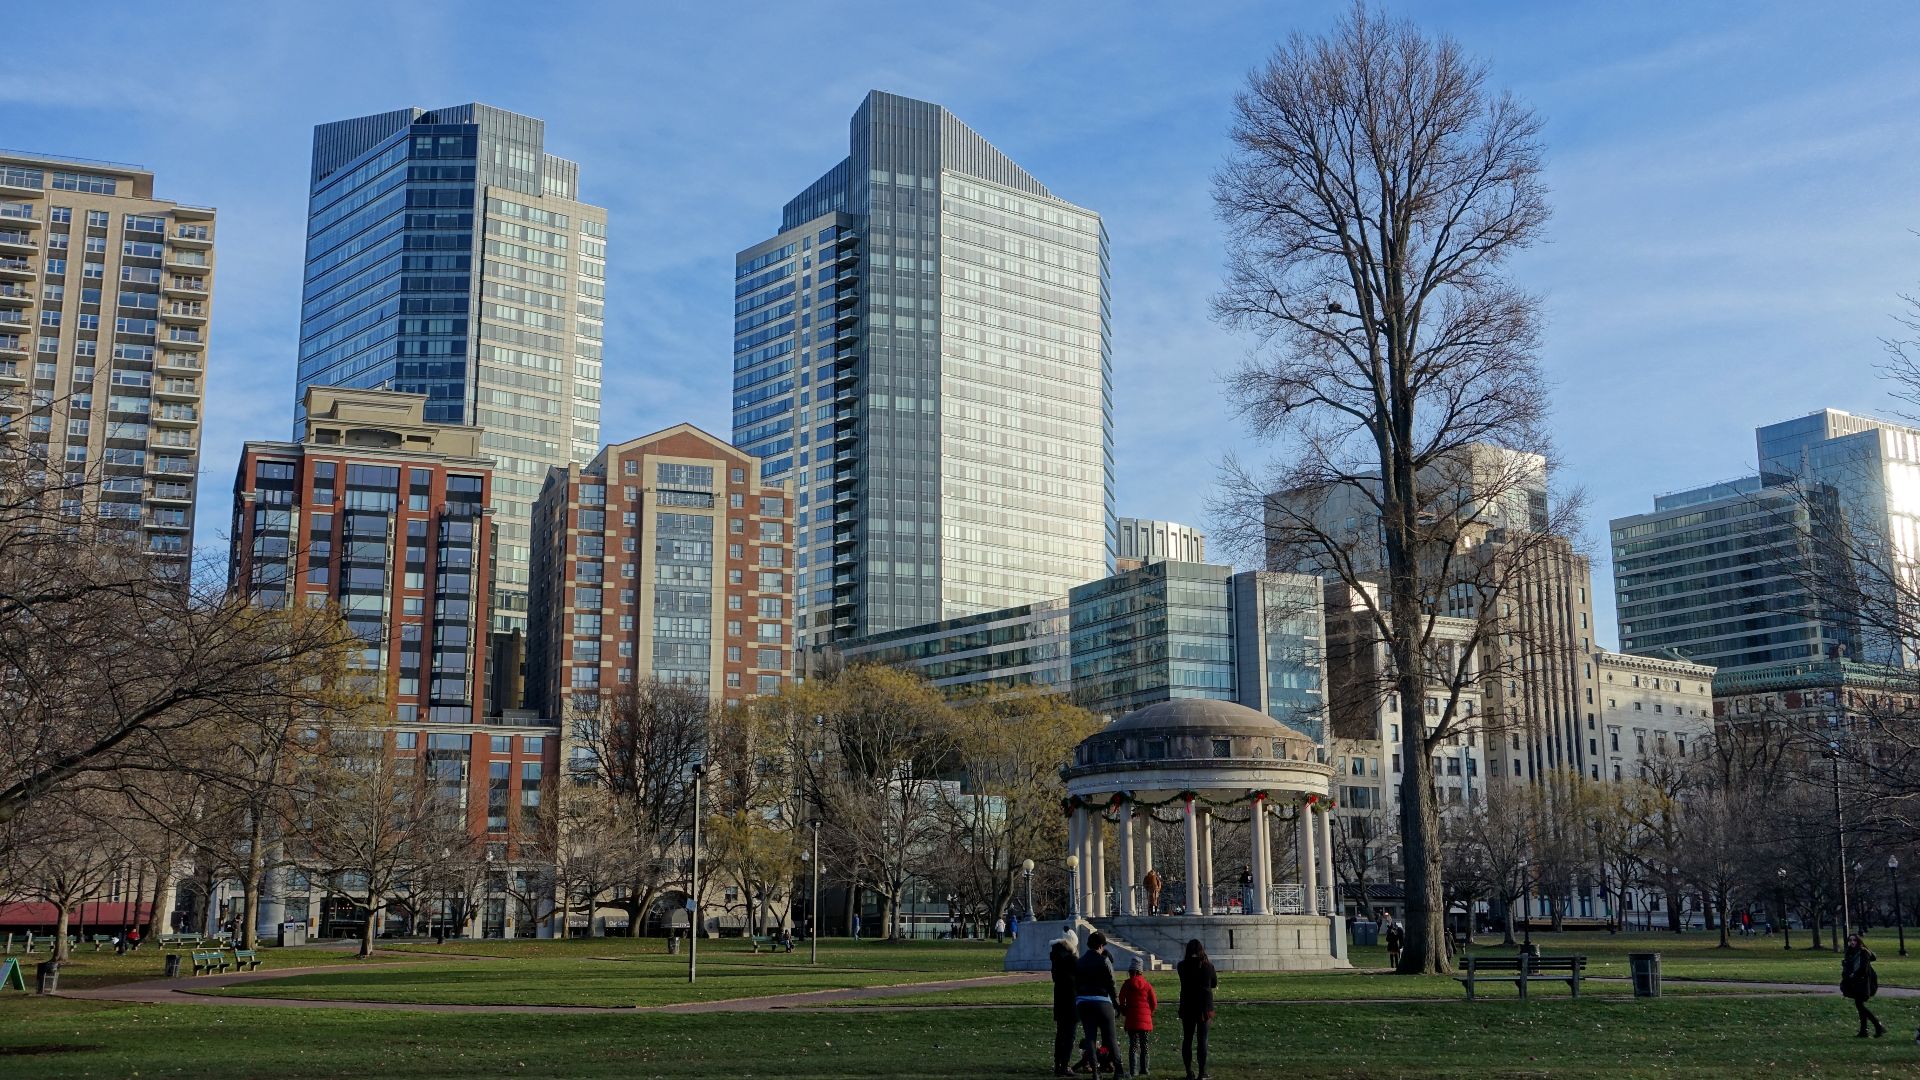
20: Massachusetts
Median income: Very high
Average debt per resident: High
Bankruptcy rate: Low
Cost of living: Far above U.S.
Liquid-asset poverty: Mid tier
Elite incomes, but prices and leverage make small shocks expensive.
19: New Jersey
Median income: Very high
Average debt per resident: Very high (mortgage-heavy)
Bankruptcy rate: Low
Cost of living: Far above U.S.
Liquid-asset poverty: Mid tier
Housing costs and big balances keep risk real despite paychecks.
 King of Hearts, Wikimedia Commons
18: New York
Median income: Above U.S. average
Average debt per resident: High
Bankruptcy rate: Low–mid
Cost of living: Very high
Liquid-asset poverty: Mid-high tier
Sky-high prices and thin savings among renters make NYC-area budgets precarious.
 Clement Bardot, Wikimedia Commons
17: Texas
Median income: Near U.S.
Average debt per resident: High
Bankruptcy rate: Mid–high in several districts
Cost of living: Slightly below U.S. (rising in metros)
Liquid-asset poverty: High tier
Leverage and weak savings buffers outweigh only-modest price relief.

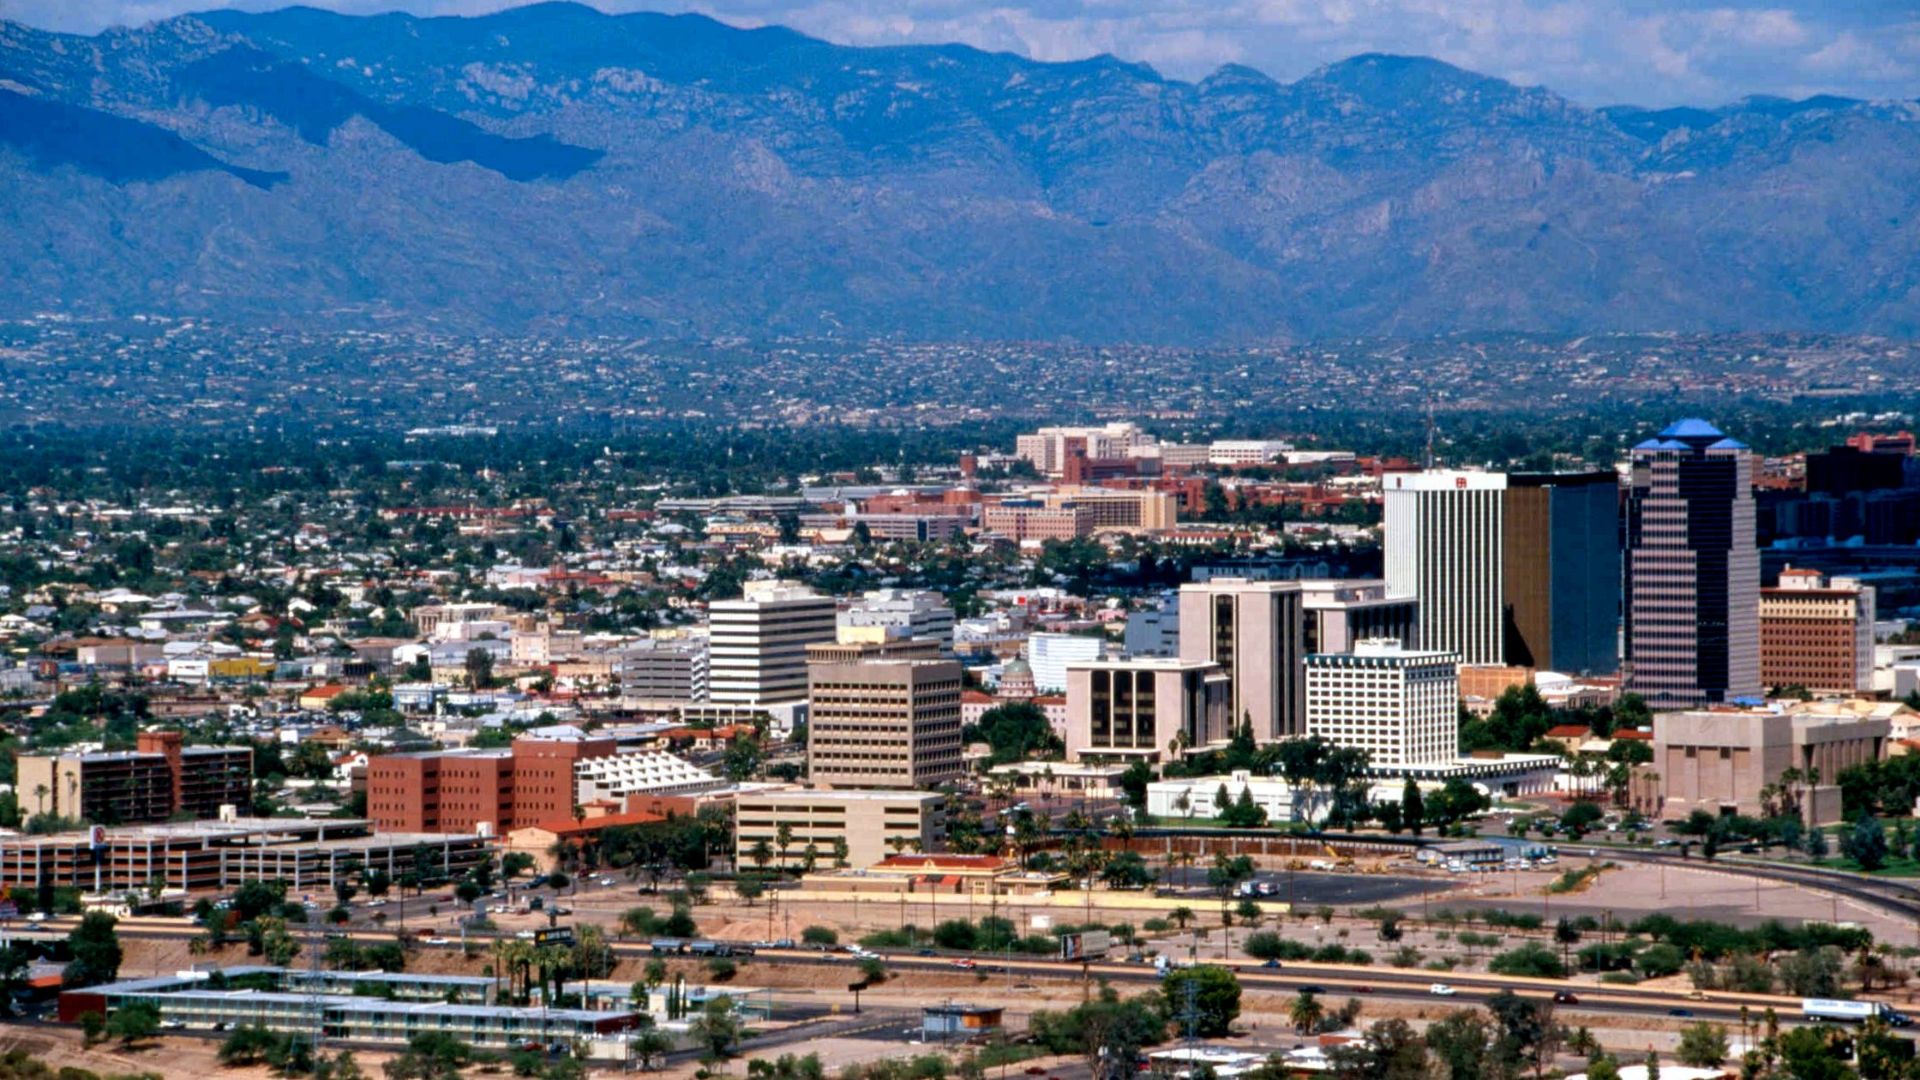
16: Arizona
Median income: Near U.S.
Average debt per resident: High
Bankruptcy rate: Mid
Cost of living: Above U.S. (metro-driven)
Liquid-asset poverty: Mid-high tier
Sunbelt migration brought costs and balances that strain newcomers.
 unknown; cleaned up, rotated and levels adjustment by Howcheng., Wikimedia Commons
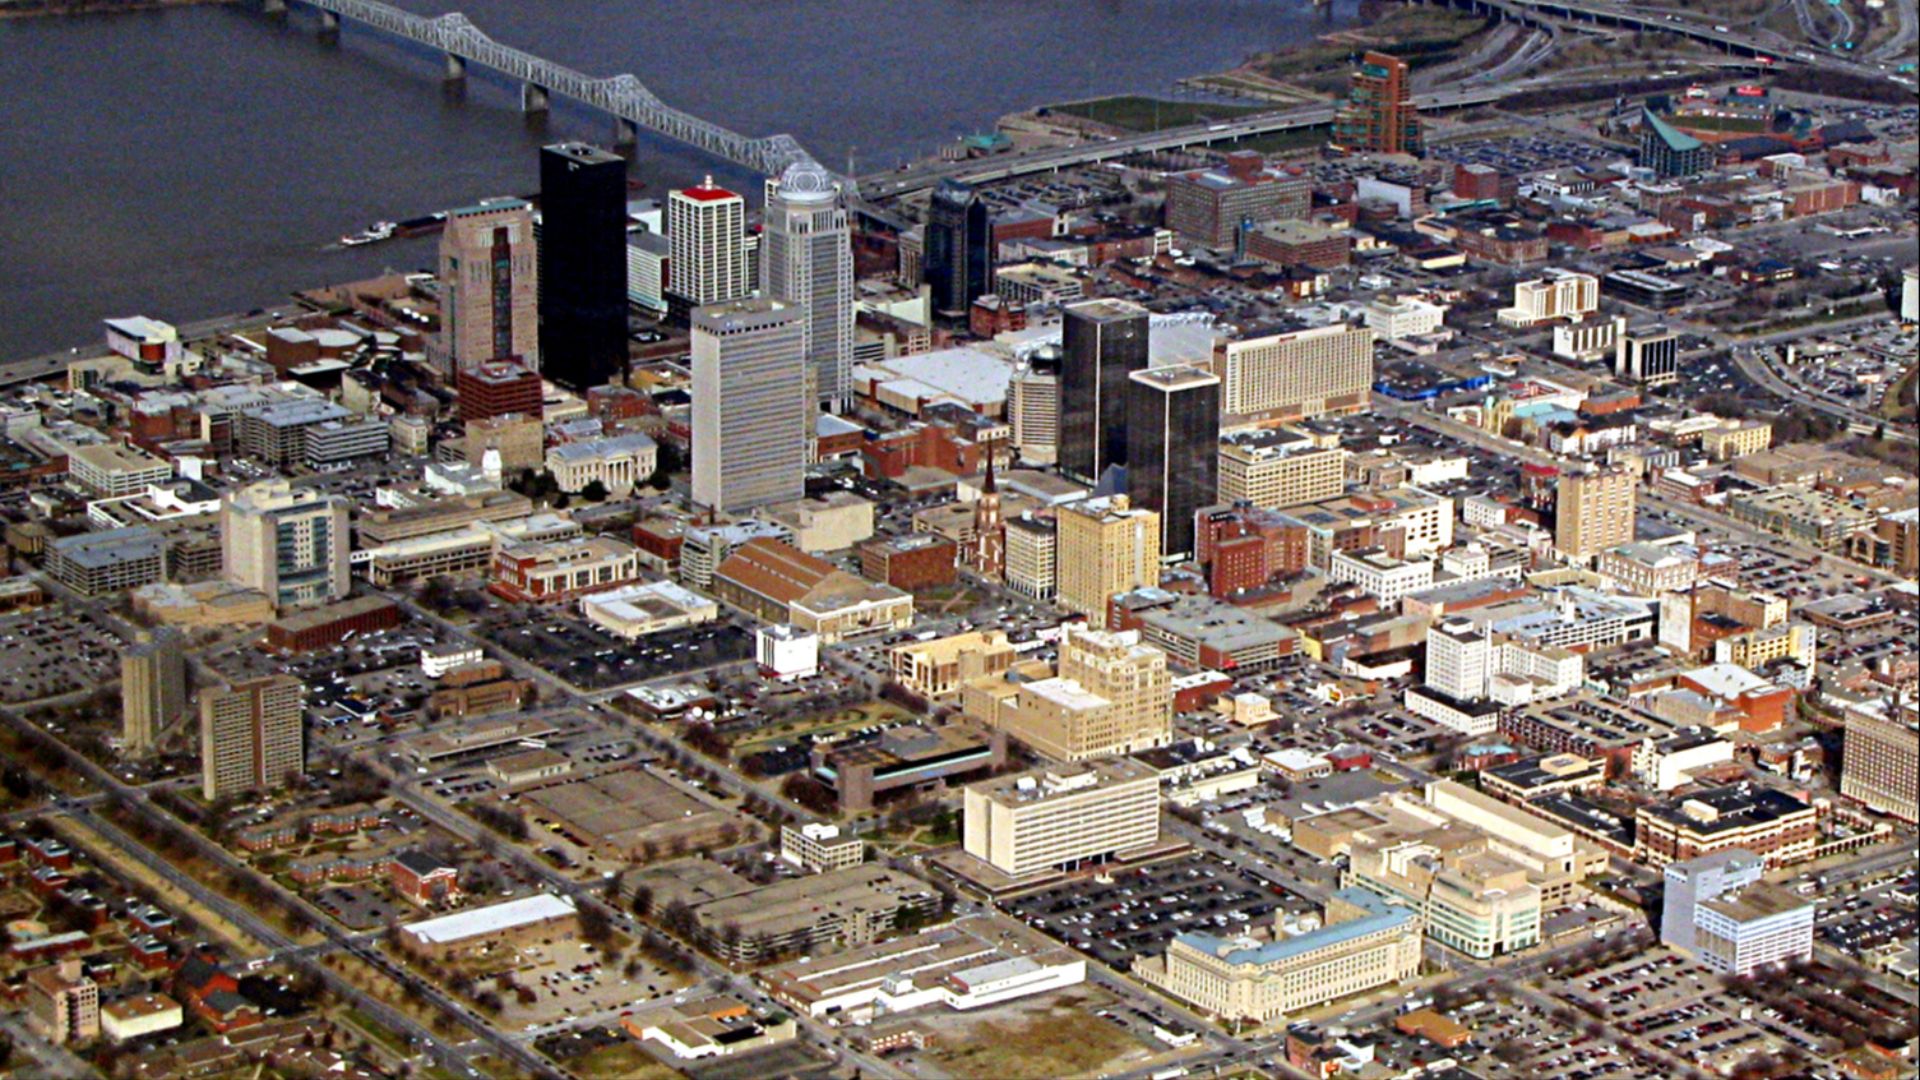
15: Kentucky
Median income: Low
Average debt per resident: Mid
Bankruptcy rate: High
Cost of living: Below U.S.
Liquid-asset poverty: High tier
Even with cheaper prices, low income and filings keep risk elevated.
 Ken Lund from Reno, Nevada, USA, Wikimedia Commons
14: Oklahoma
Median income: Low–near U.S.
Average debt per resident: Mid
Bankruptcy rate: High
Cost of living: Below U.S.
Liquid-asset poverty: High tier
Volatile energy cycles and weak savings create quick trouble.

13: South Carolina
Median income: Below U.S.
Average debt per resident: Mid-high
Bankruptcy rate: High
Cost of living: Near U.S. (coastal premiums)
Liquid-asset poverty: High tier
Tourism metros lift prices; cushions lag behind.

12: Georgia
Median income: Near U.S.
Average debt per resident: High
Bankruptcy rate: High
Cost of living: Near U.S. (Atlanta costs rising)
Liquid-asset poverty: High tier
Card and auto balances plus filing intensity keep households fragile.
 Frank Schulenburg, Wikimedia Commons
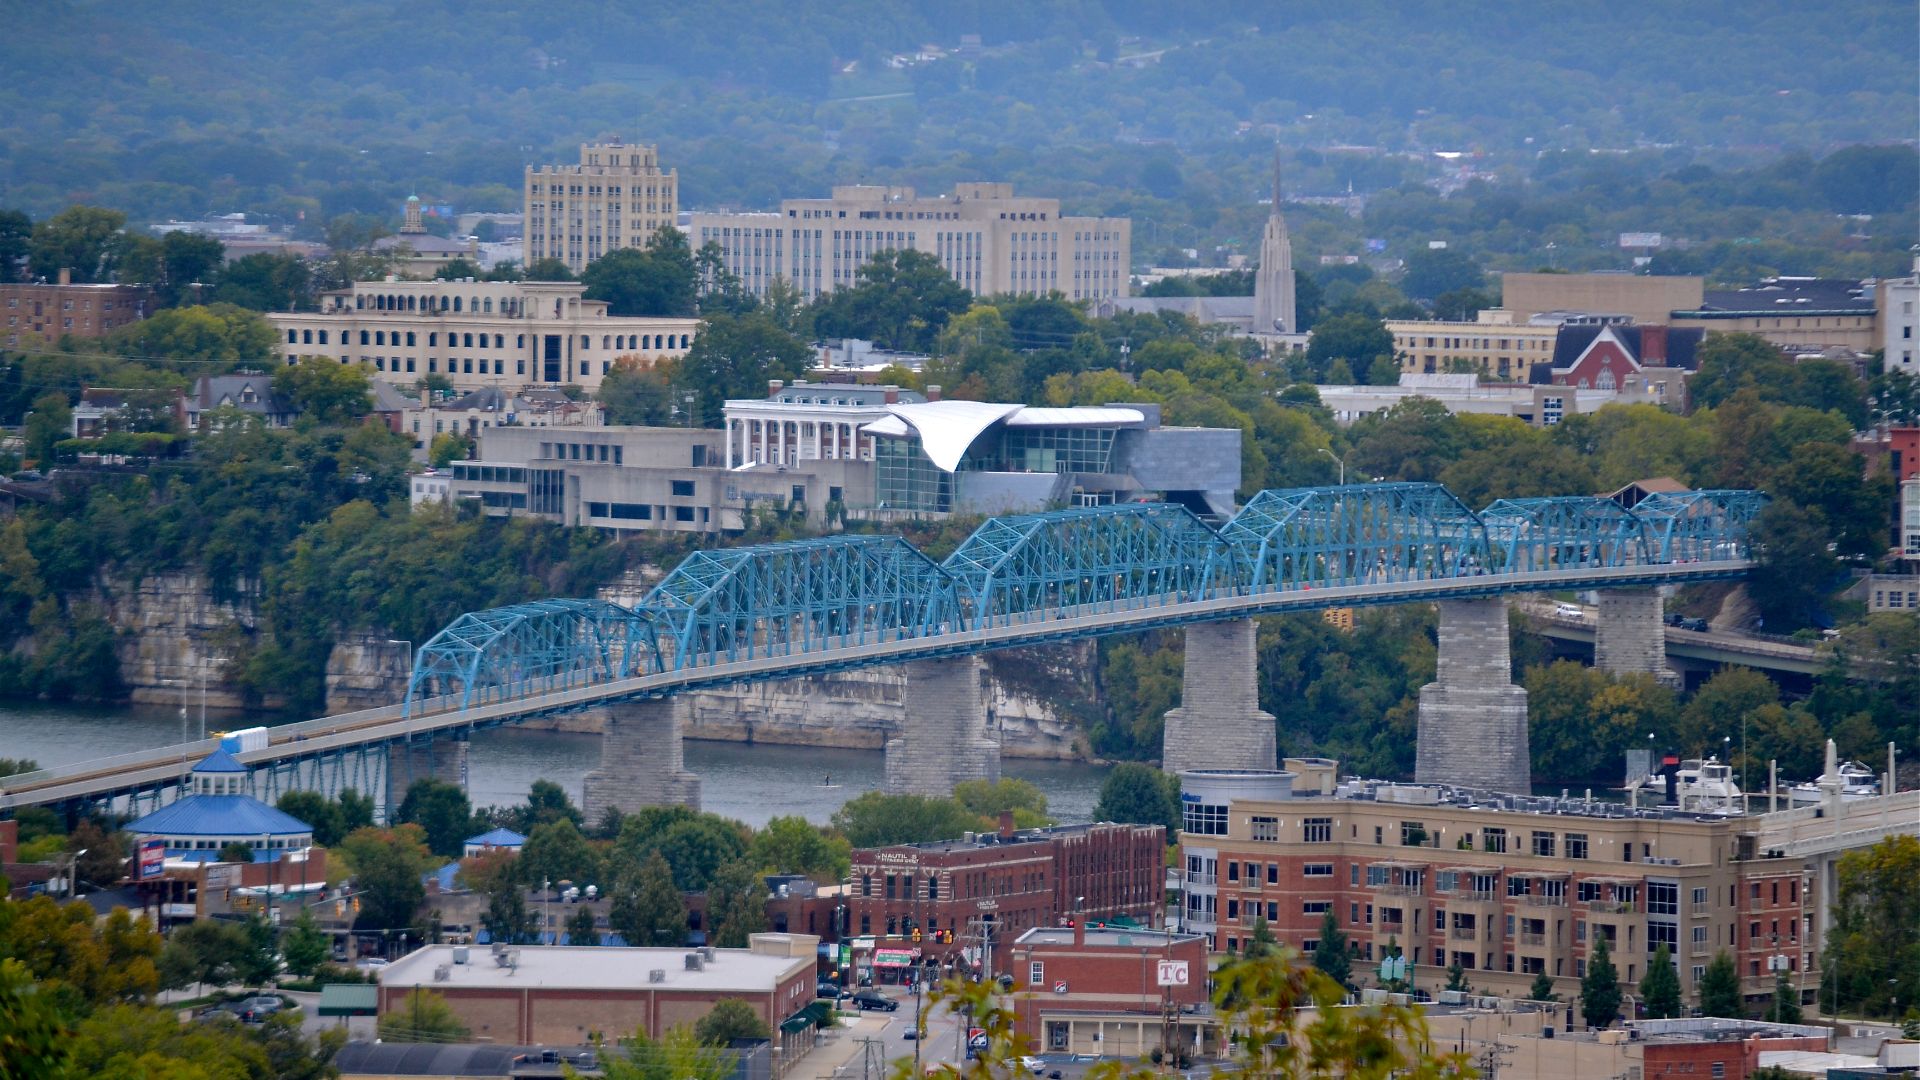
11: Tennessee
Median income: Below U.S.
Average debt per resident: Mid-high
Bankruptcy rate: Among highest
Cost of living: Below U.S. (Nashville above)
Liquid-asset poverty: High tier
One of the nation’s bankruptcy hot spots keeps risk near the top.
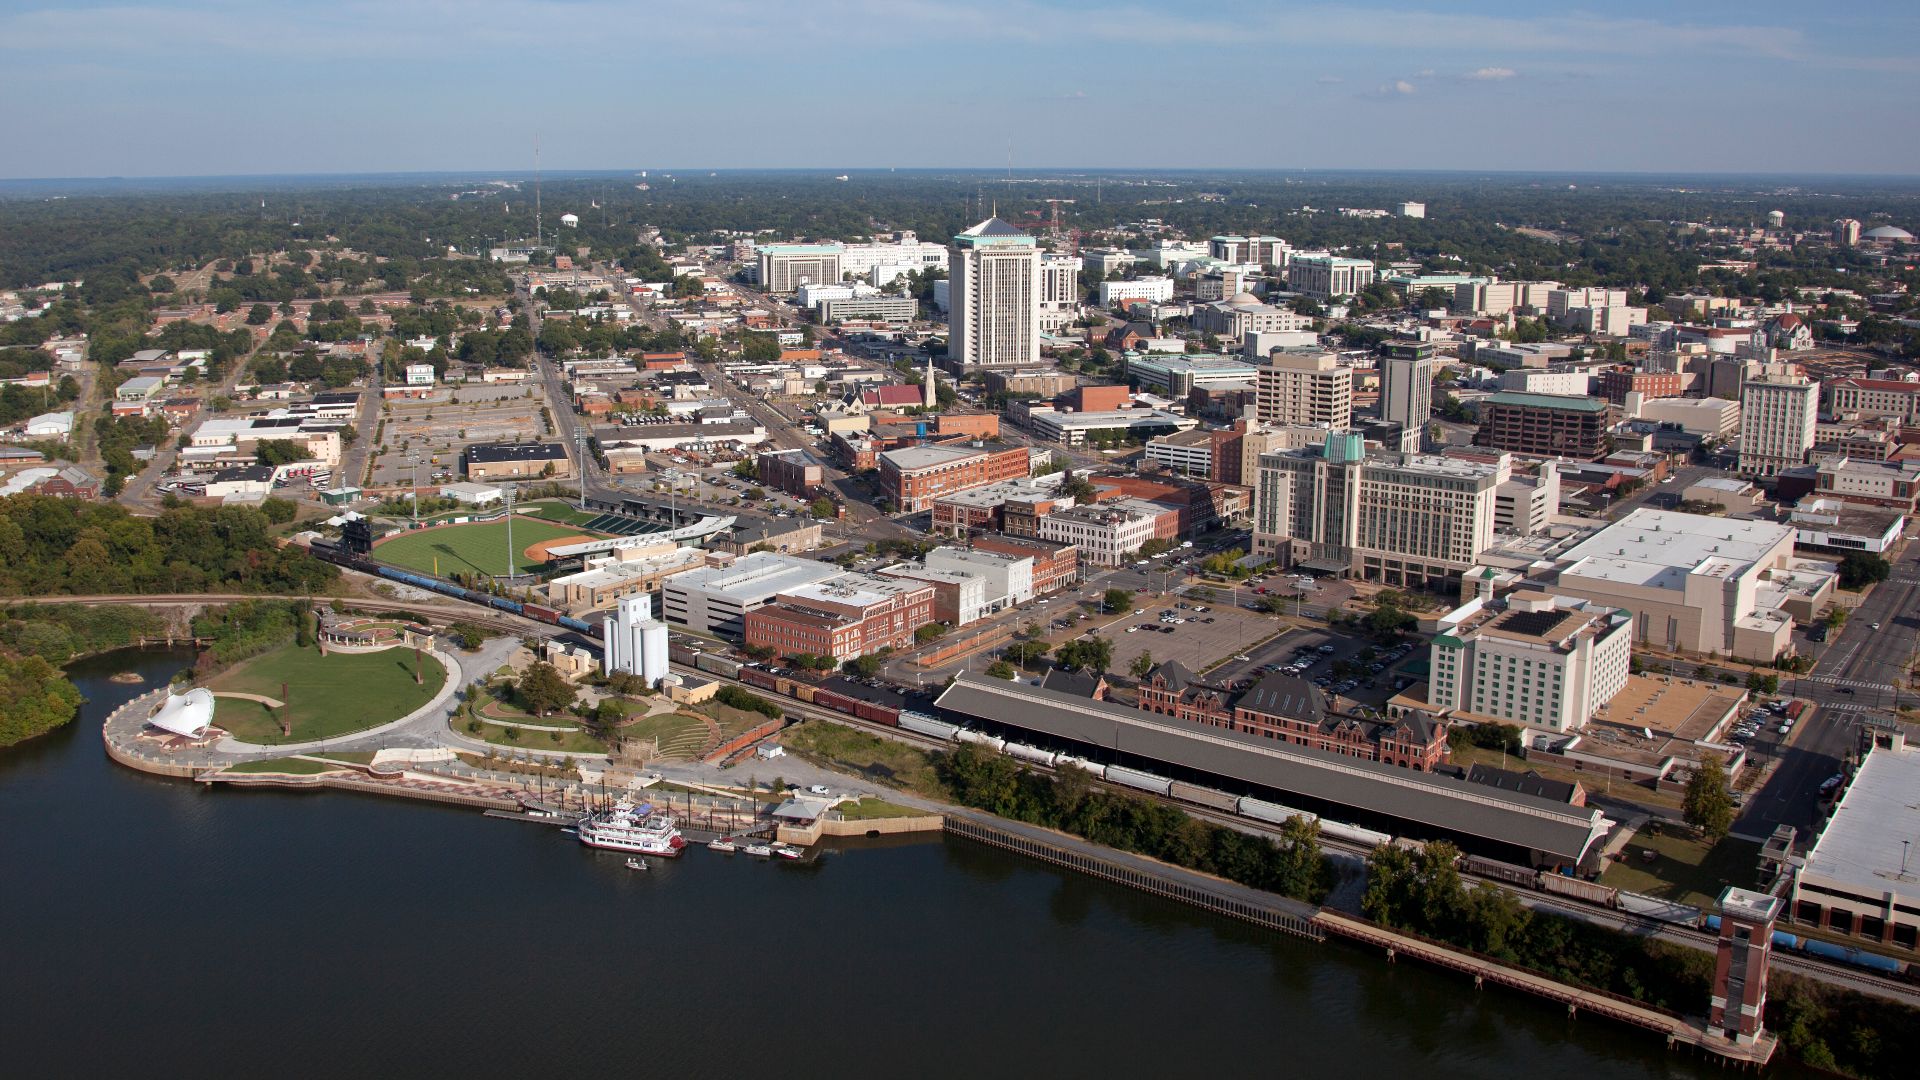
10: Alabama
Median income: Low
Average debt per resident: Mid
Bankruptcy rate: High
Cost of living: Below U.S.
Liquid-asset poverty: High tier
Thin incomes and weak cash buffers leave little room for error.
 Carol M. Highsmith, Wikimedia Commons
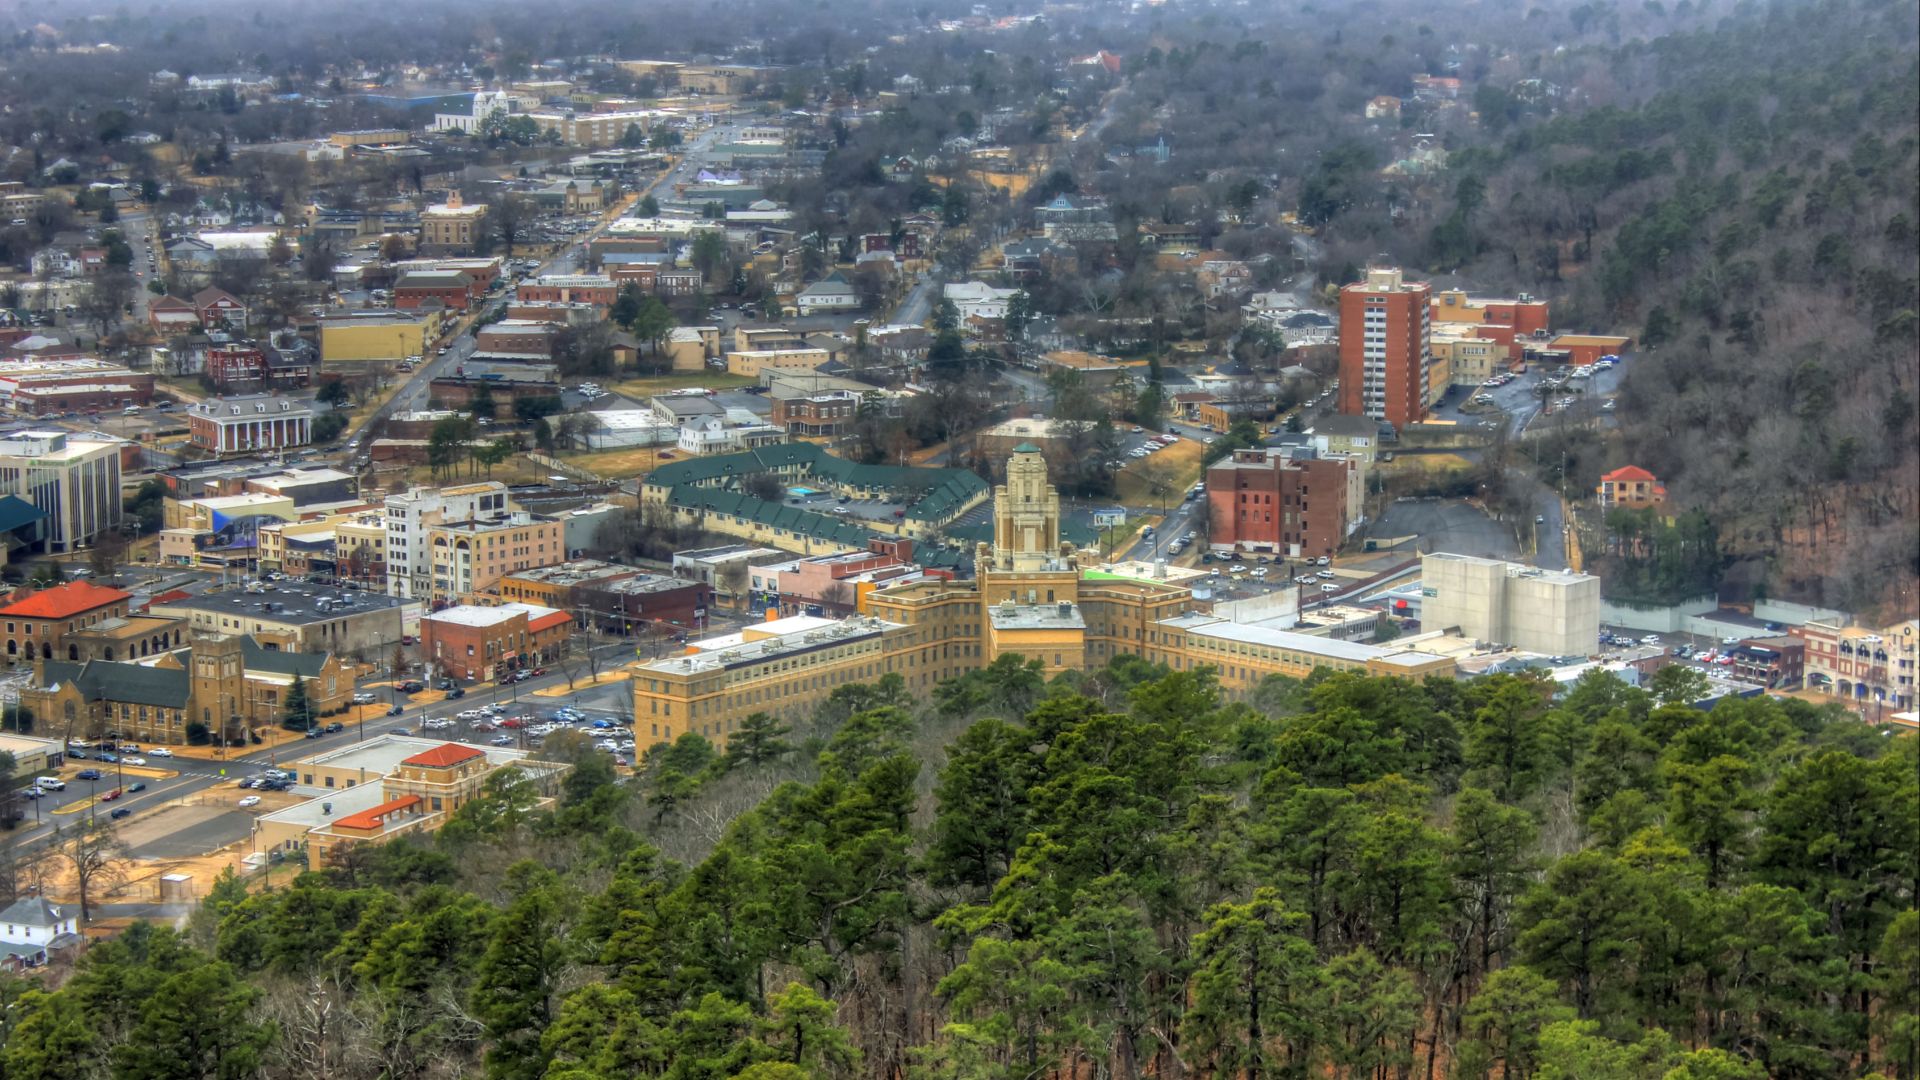
9: Arkansas
Median income: Low
Average debt per resident: Mid
Bankruptcy rate: High
Cost of living: Low
Liquid-asset poverty: High tier
Cheaper prices help, but savings gaps and filings dominate.
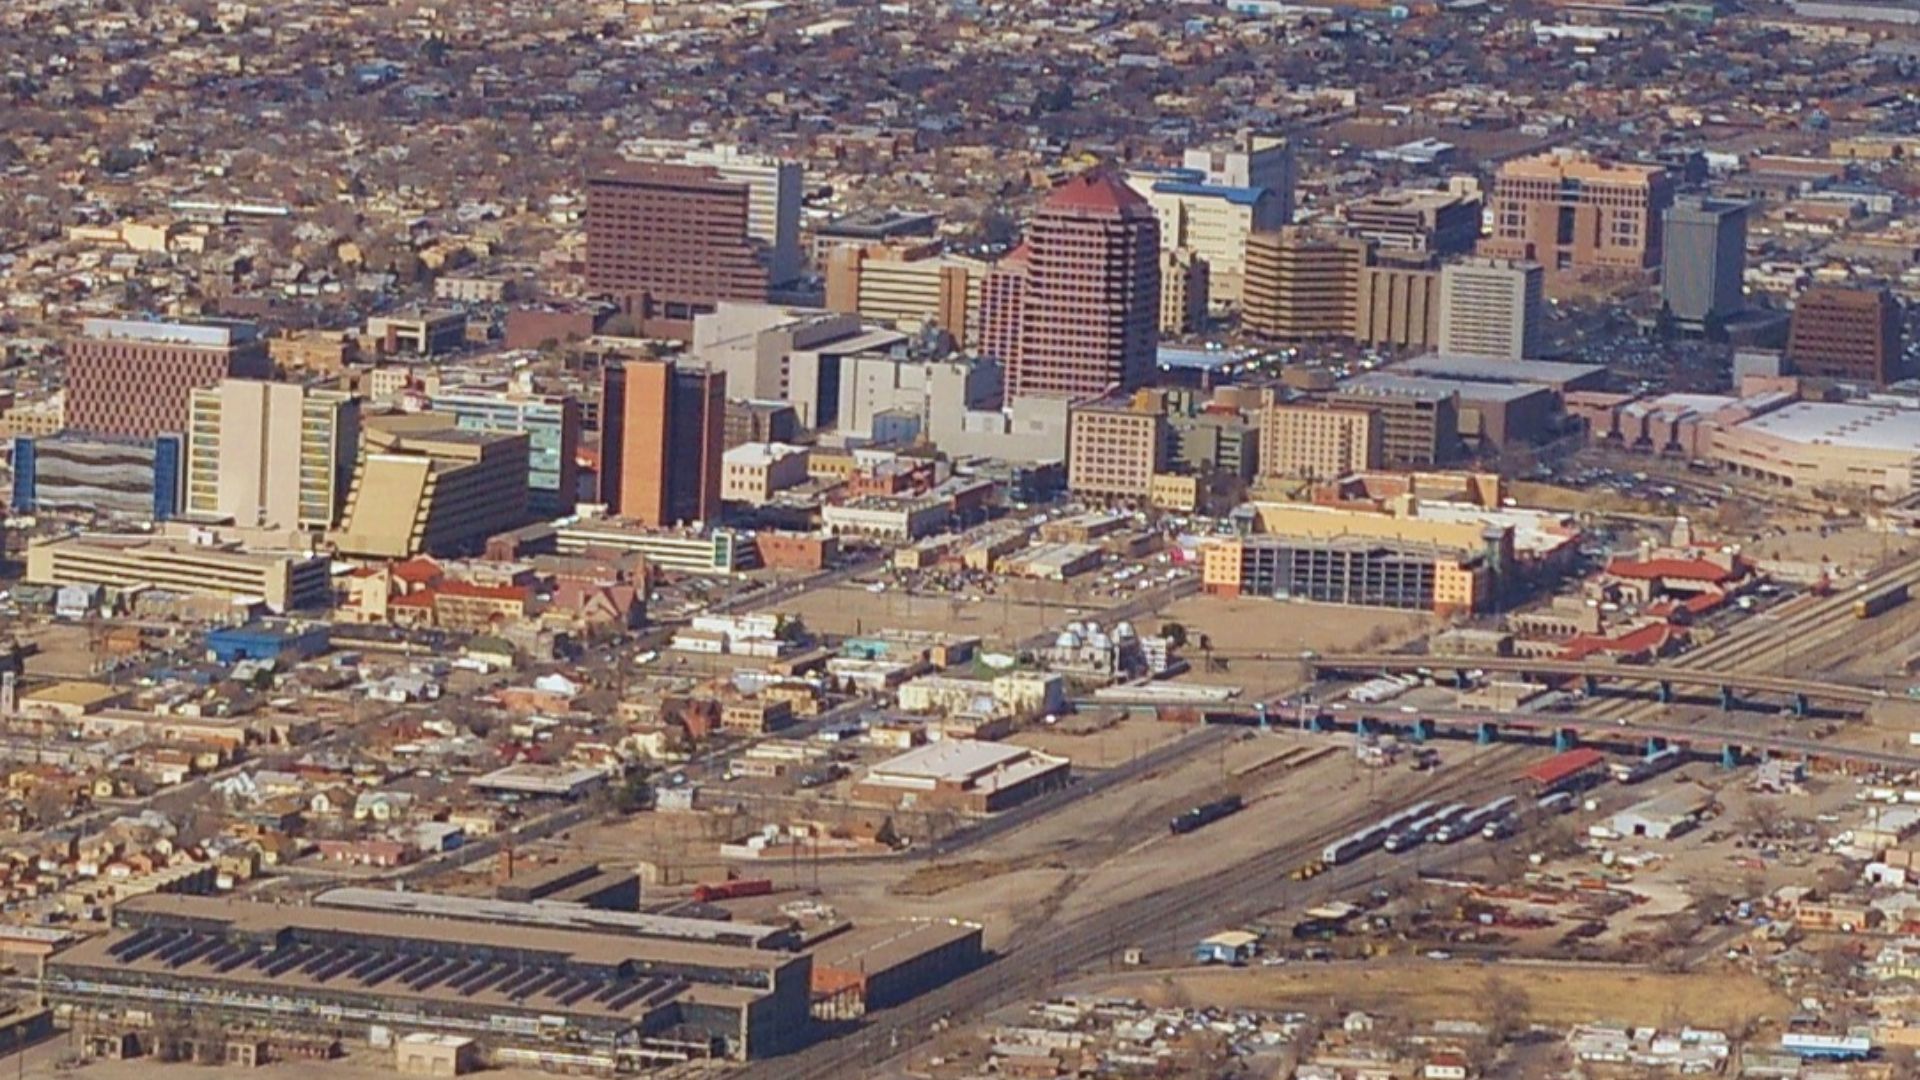
8: New Mexico
Median income: Low
Average debt per resident: Mid
Bankruptcy rate: Mid
Cost of living: Near U.S.
Liquid-asset poverty: High tier
Lower pay and thin cushions outweigh moderate prices.
 Ron Reiring, Wikimedia Commons
7: California
Median income: High
Average debt per resident: Very high
Bankruptcy rate: Mid
Cost of living: Among highest
Liquid-asset poverty: Mid-high tier
Top-tier incomes can’t fully offset extreme housing and insurance costs and heavy leverage.
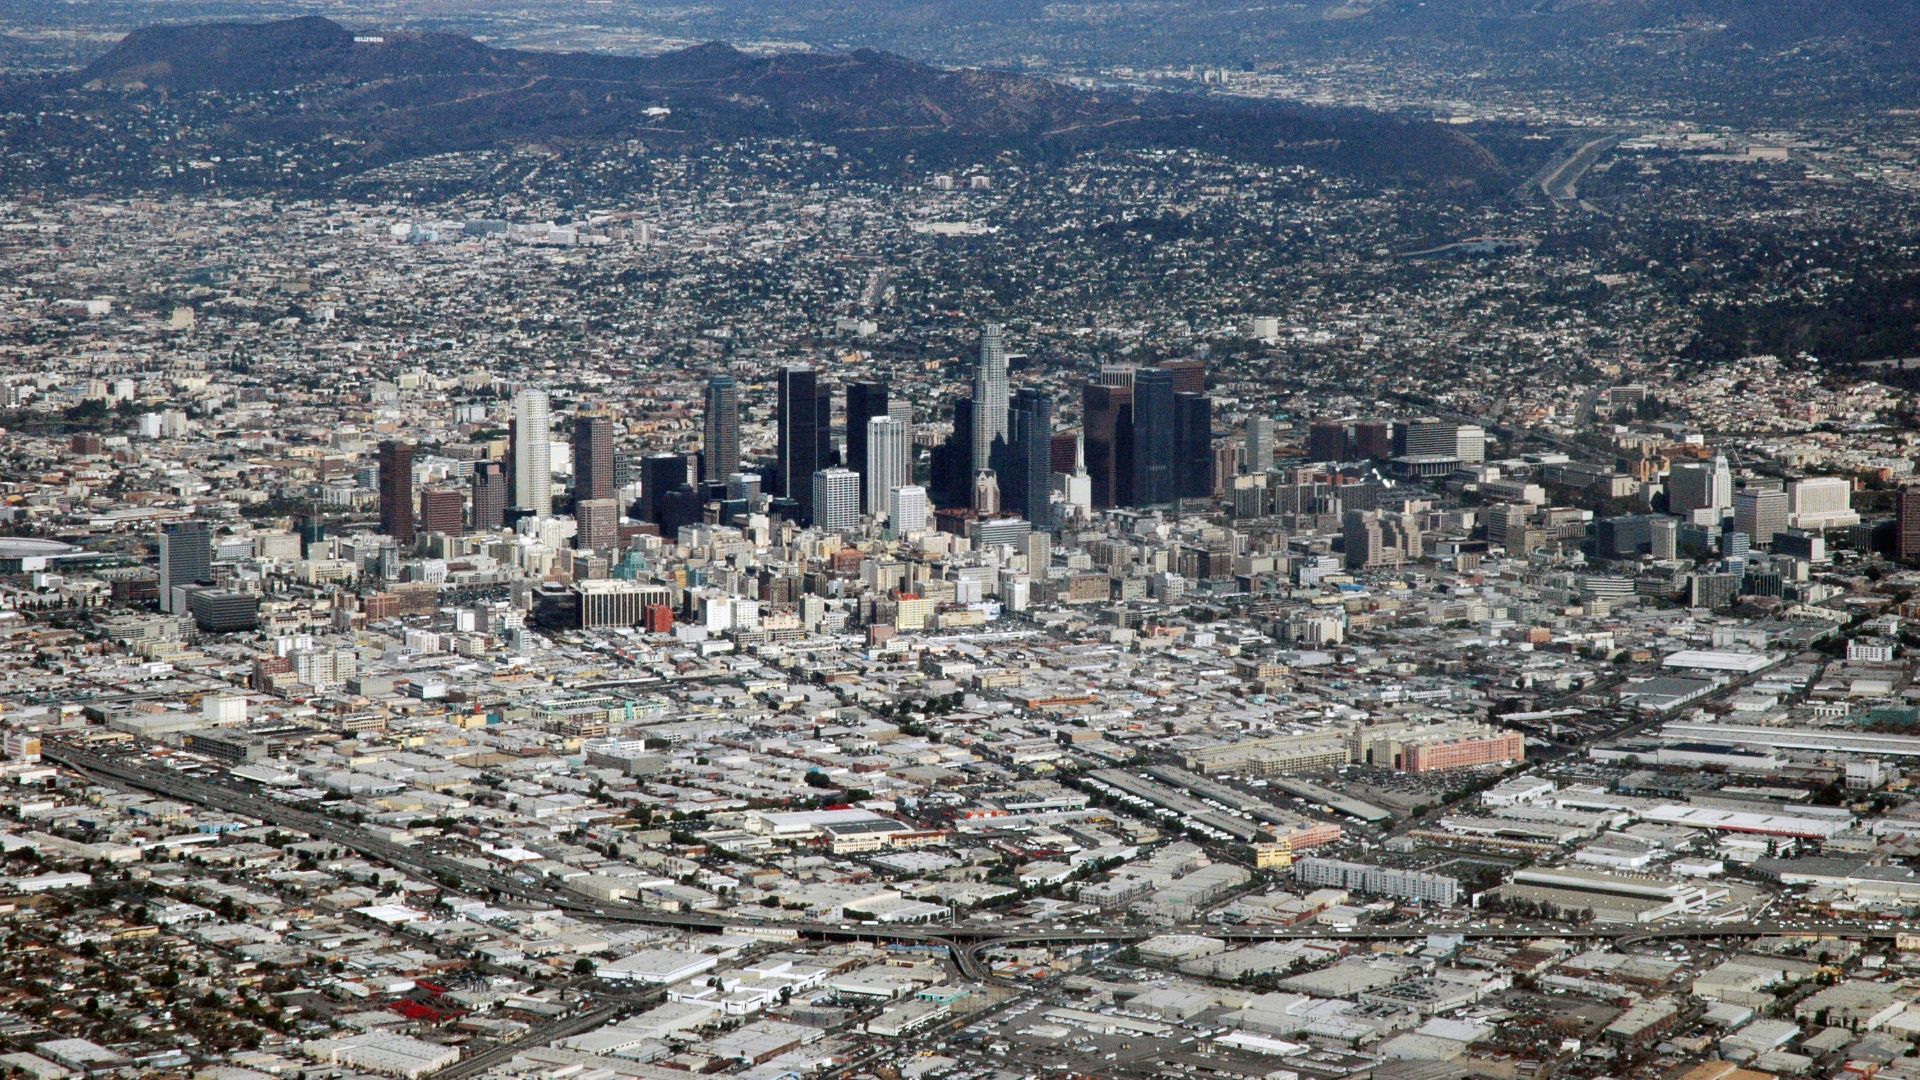 Marshall Astor from San Pedro, United States, Wikimedia Commons
6: Hawaii
Median income: High
Average debt per resident: High
Bankruptcy rate: Low–mid
Cost of living: Highest tier
Liquid-asset poverty: Mid-high tier
Island prices keep even solid earners on a knife’s edge.
 Highsmith, Carol M., 1946-, Wikimedia Commons
5: Florida
Median income: Below–near U.S.
Average debt per resident: High
Bankruptcy rate: Rising
Cost of living: Above U.S. (insurance shock)
Liquid-asset poverty: High tier
Insurance and housing spikes plus leverage and low buffers raise 2026 risk.
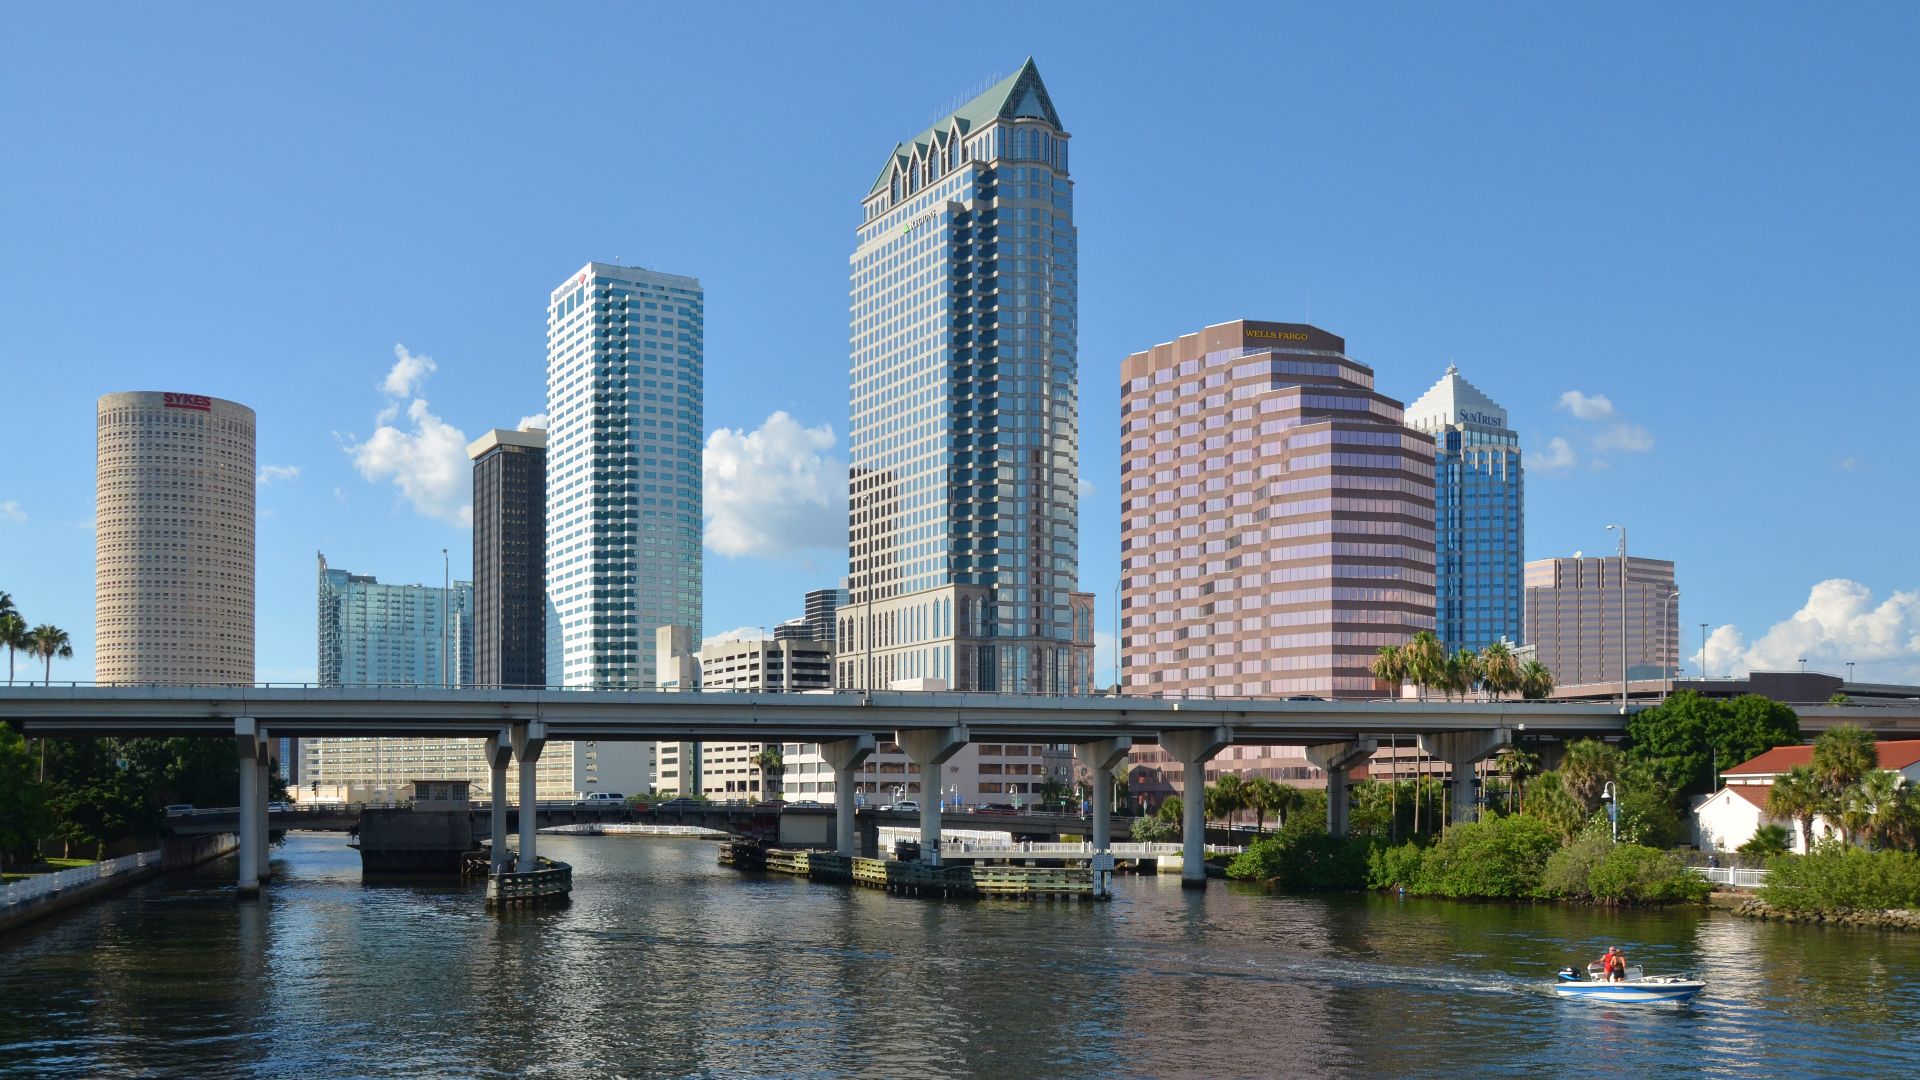 Clement Bardot, Wikimedia Commons
4: West Virginia
Median income: Very low
Average debt per resident: Mid
Bankruptcy rate: High
Cost of living: Low
Liquid-asset poverty: Very high
Chronic low incomes and weak savings overwhelm low prices.
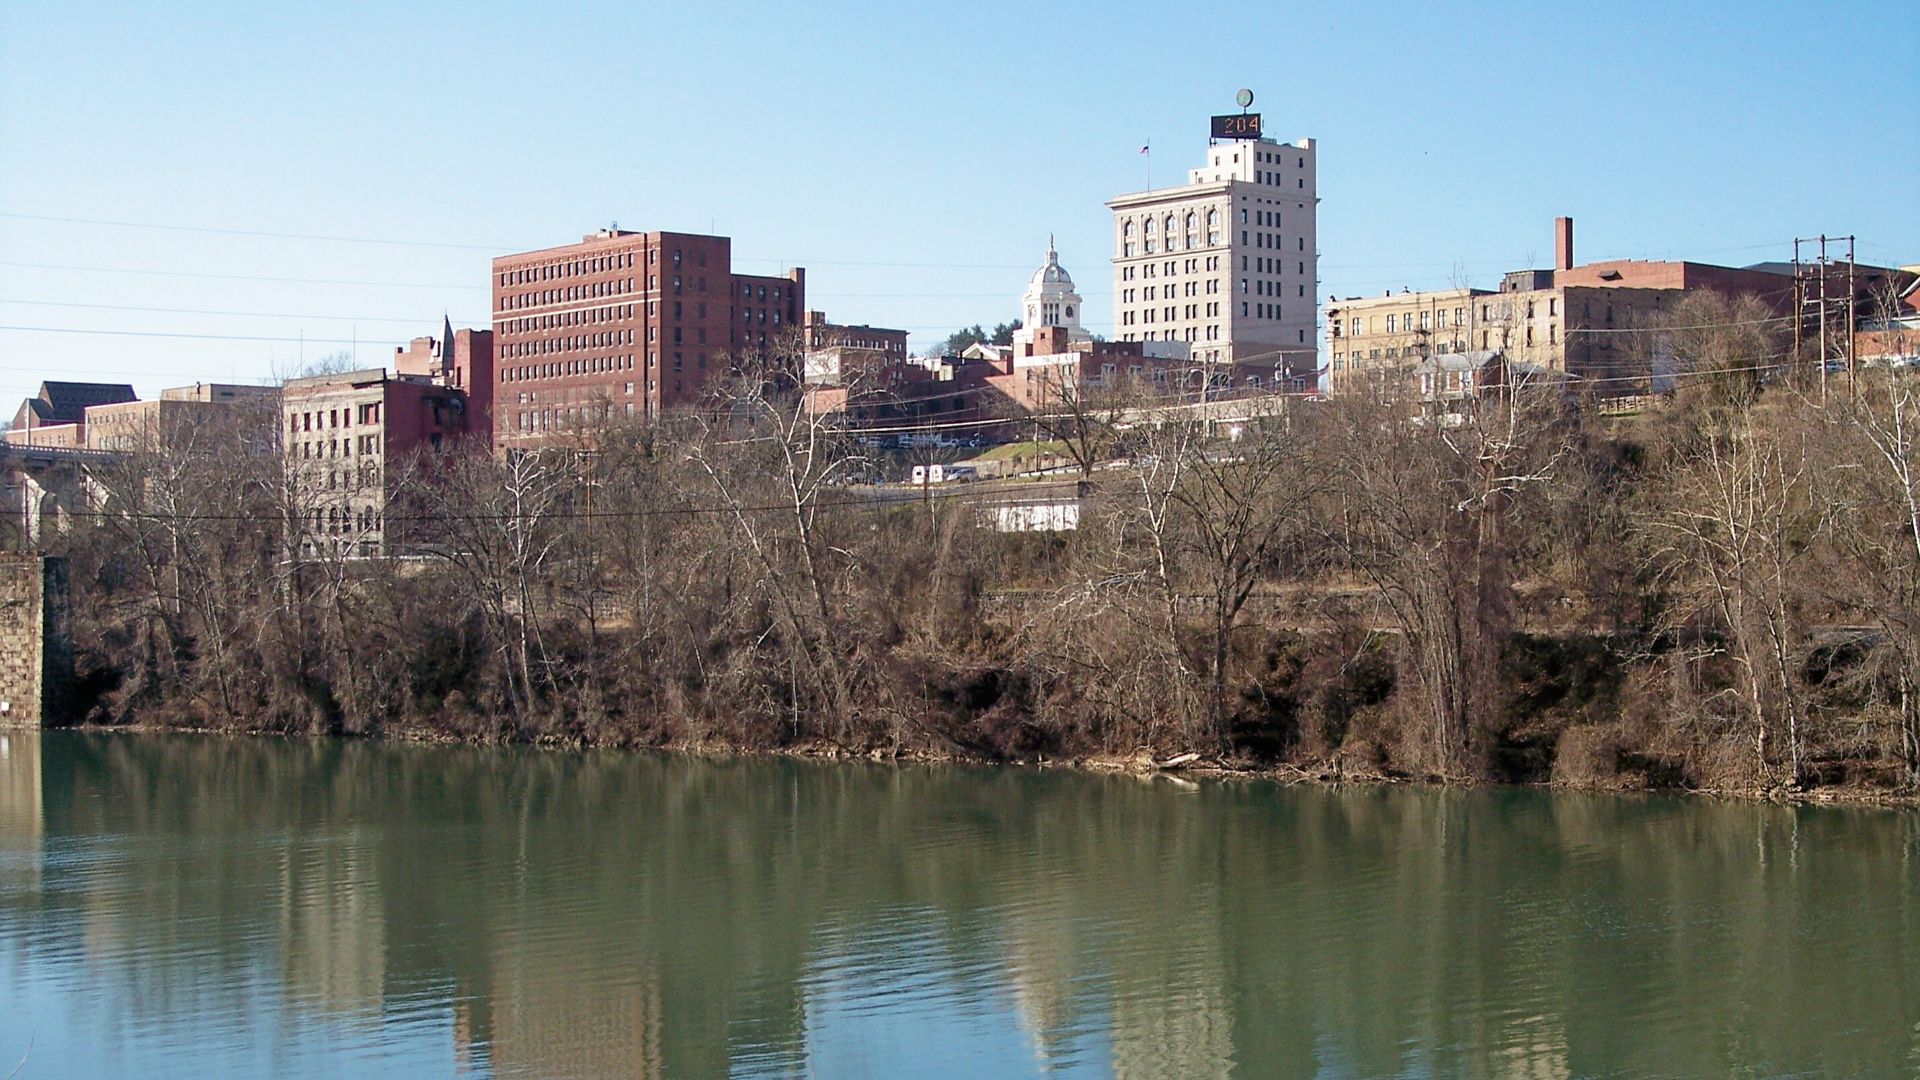 Tim Kiser (w:User:Malepheasant), Wikimedia Commons
3: Nevada
Median income: Near U.S.
Average debt per resident: High (credit-card and auto)
Bankruptcy rate: High/volatile
Cost of living: Above U.S. (housing swings)
Liquid-asset poverty: High tier
Tourism-cycle shocks and leverage keep households vulnerable.
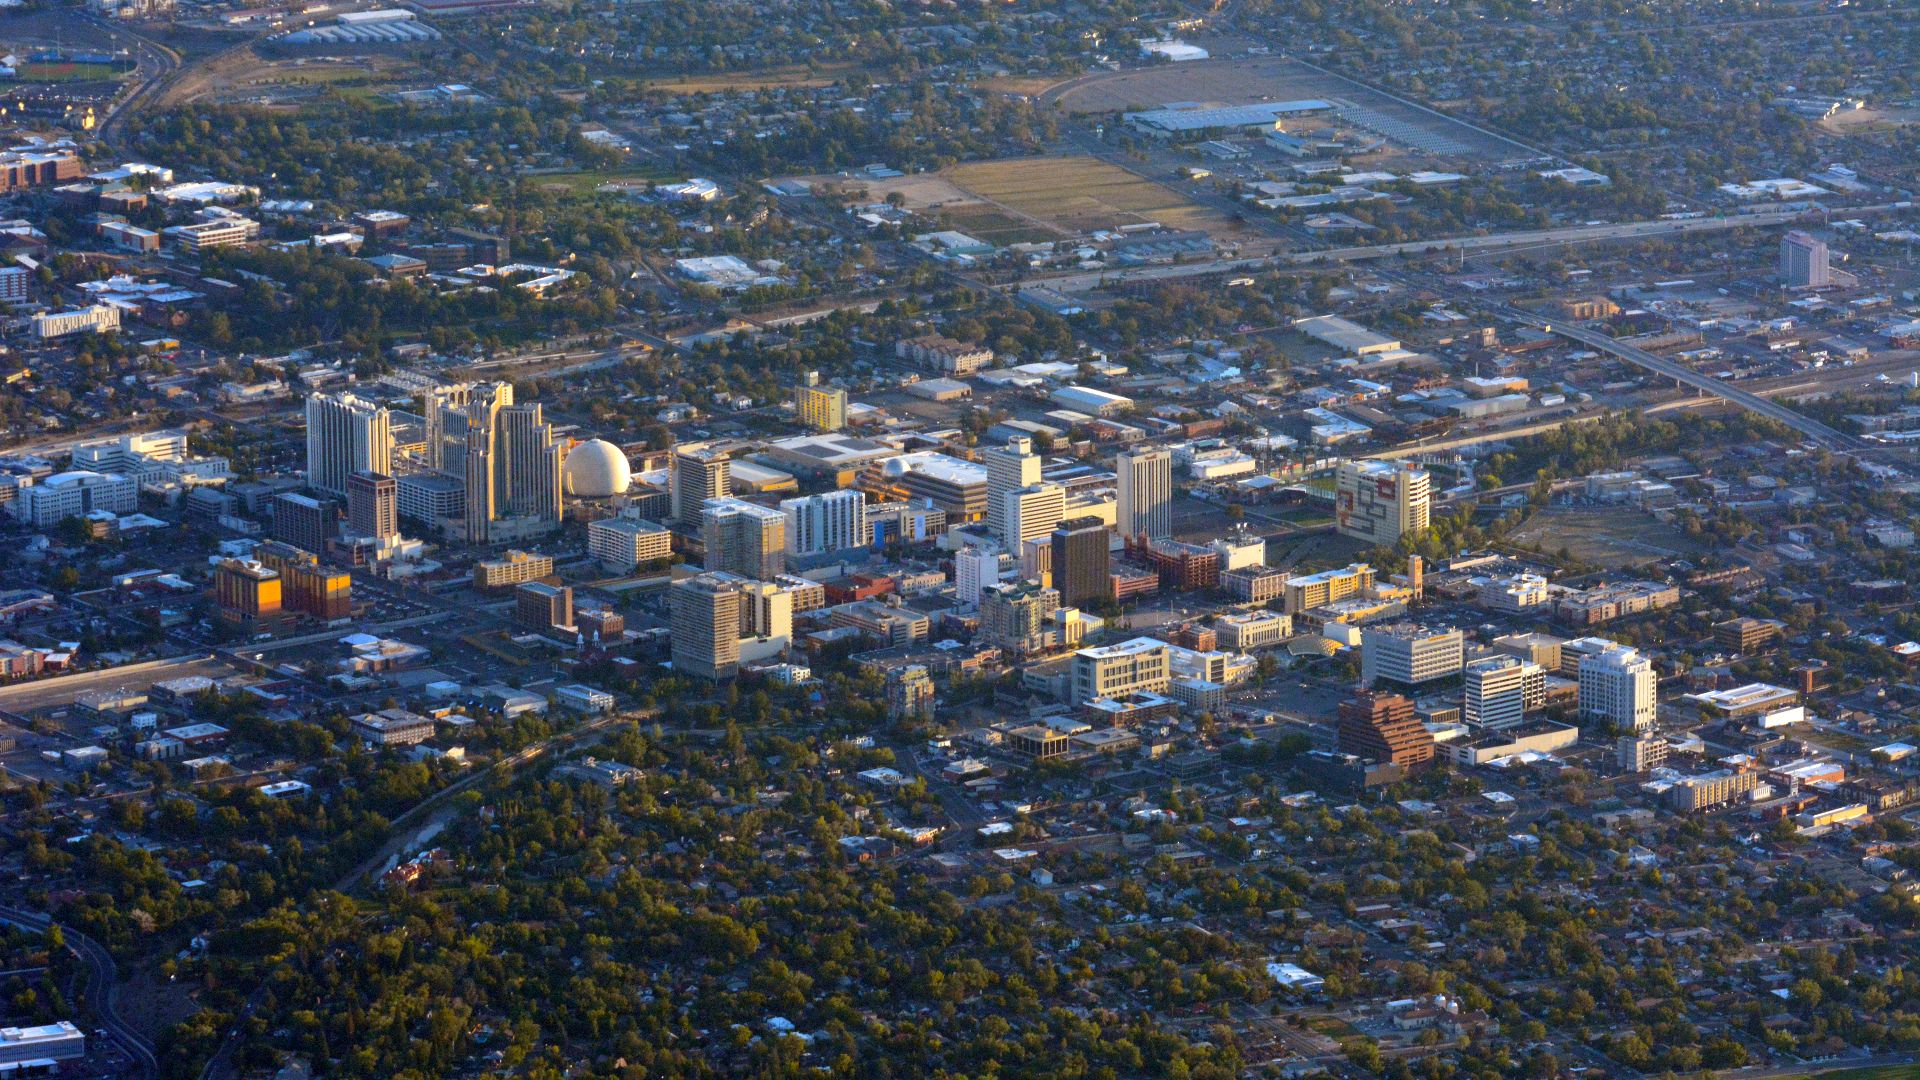 Don Ramey Logan, Wikimedia Commons
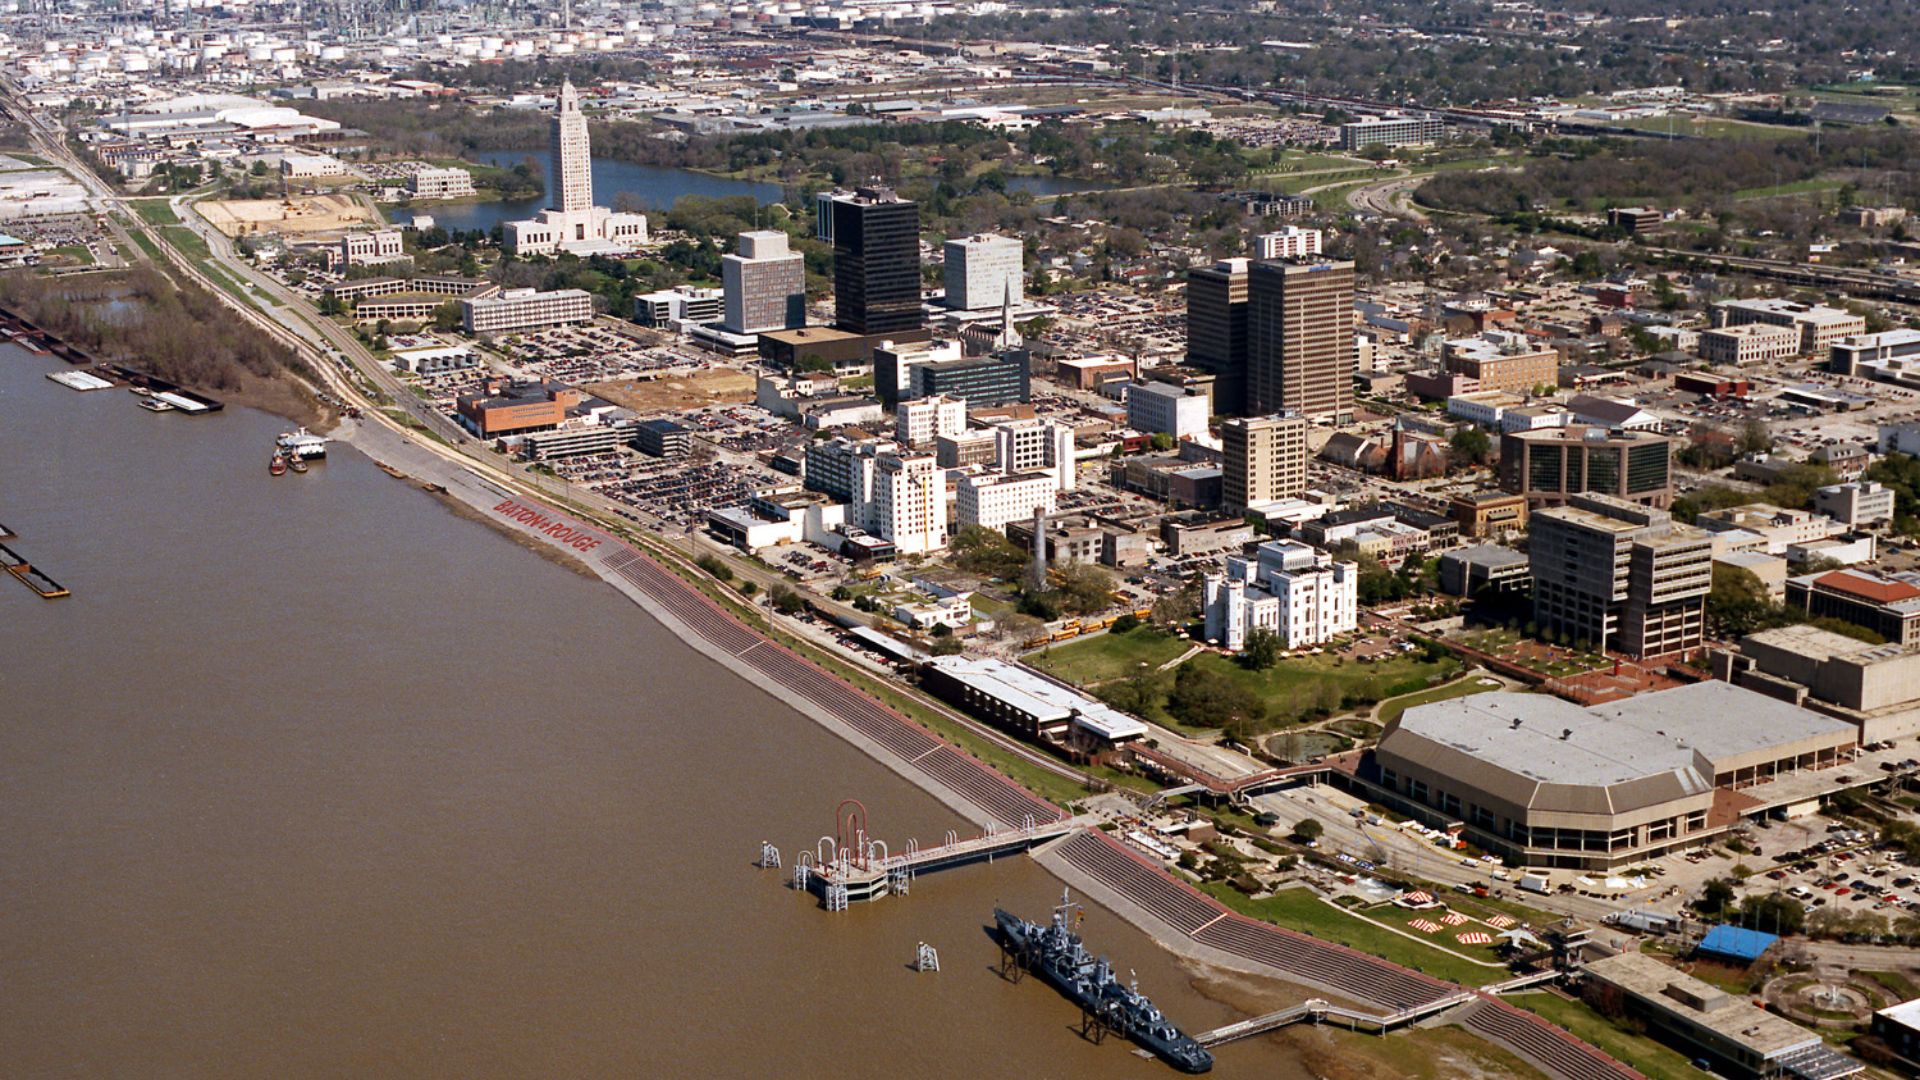
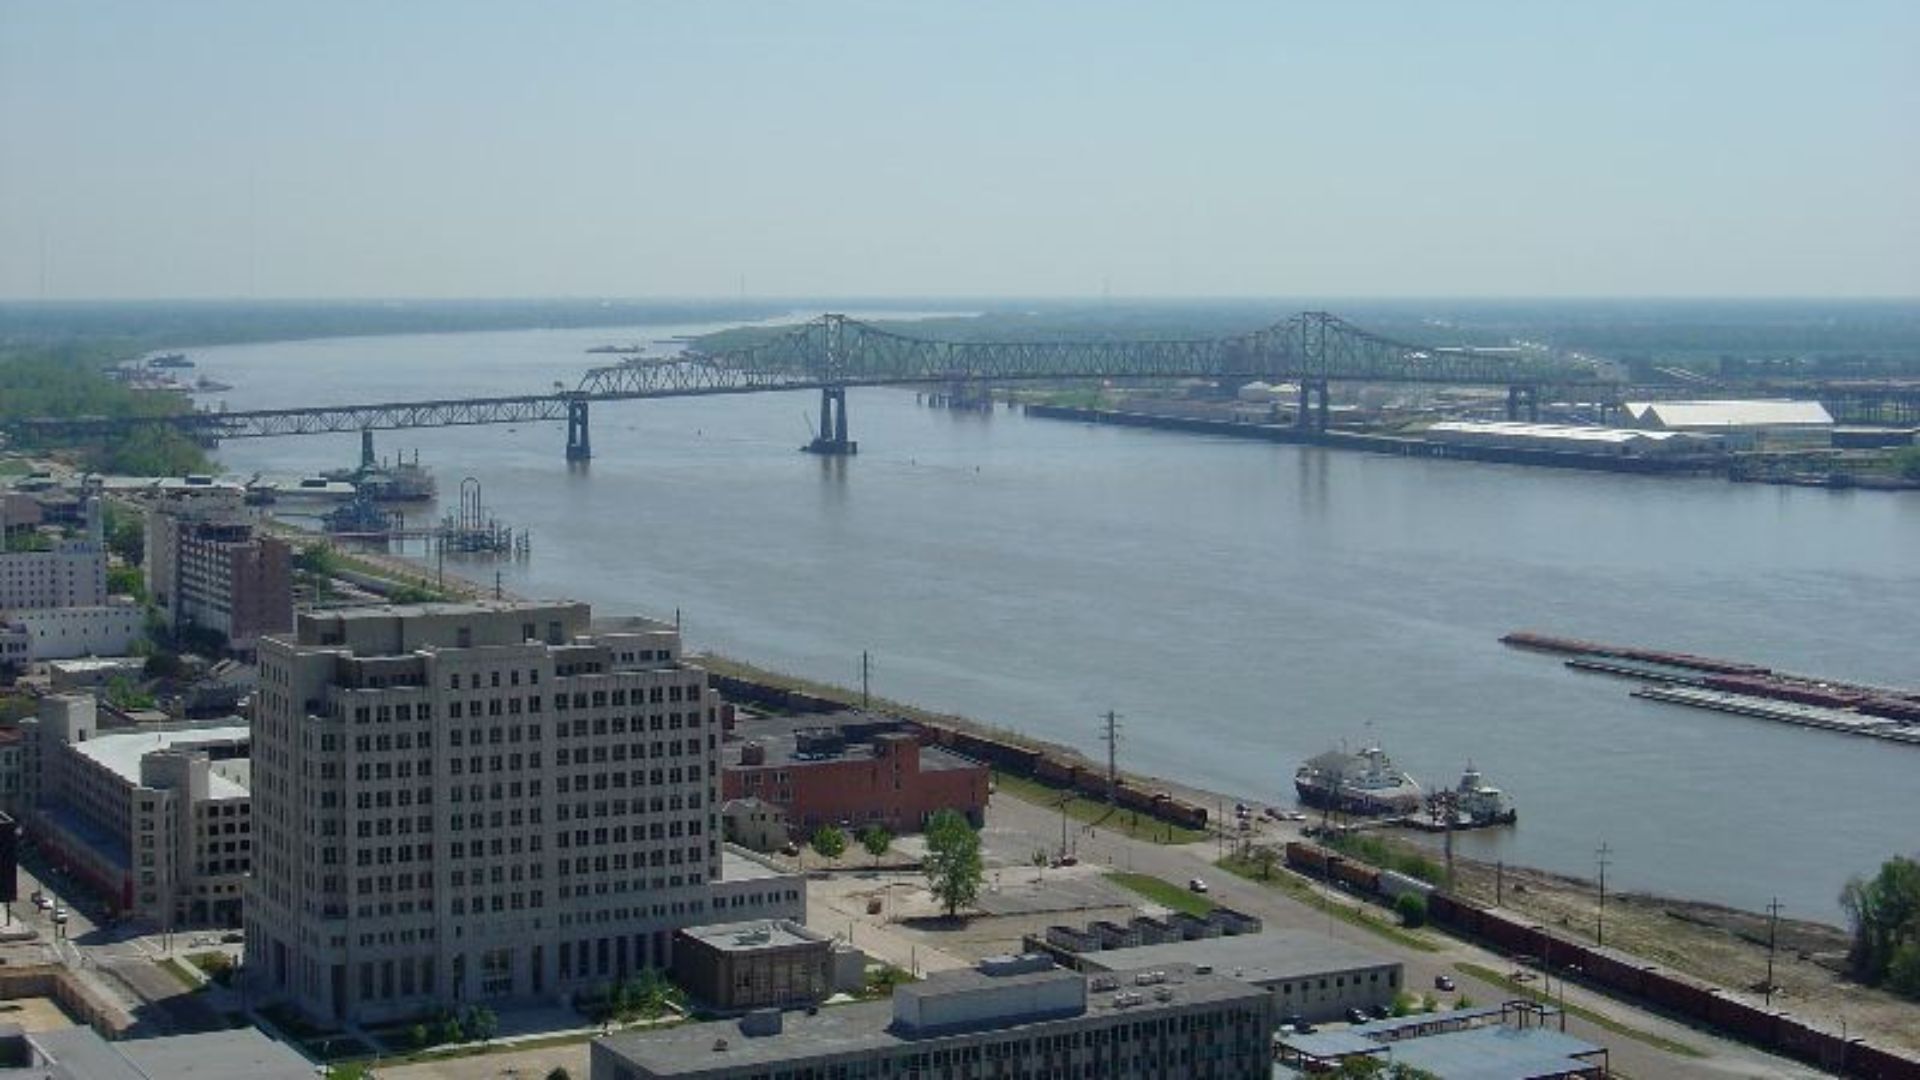
2: Louisiana
Median income: Very low
Average debt per resident: Mid
Bankruptcy rate: High
Cost of living: Near U.S. (insurance rising)
Liquid-asset poverty: Very high
Low pay and minimal cash buffers push many to the edge.
 Michael Maples, U.S. Army Corps of Engineers, Wikimedia Commons
1: Mississippi
Median income: Lowest in U.S.
Average debt per resident: Lower than U.S., but burdensome vs. income
Bankruptcy rate: Among highest
Cost of living: Below U.S.
Liquid-asset poverty: Highest tier
Even with cheaper prices, the combination of very low incomes, thin savings, and elevated filings makes Mississippi the most at-risk in 2026.
You Might Also Like:
Americans Are Fleeing Some States—Here’s Where They’re Moving Instead
Ranking The Best States For Fishing—According To Data
Every Reason Las Vegas Used To Be So Much Better In The 60s And 70s