


Where Americans Are Living Longest
The CDC’s latest state life expectancy table makes one thing hard not to do: wonder where your own state lands on the list. Well, here they are...ranked 50 to 1. We also checked out the average life expectancy for males and females in each state.

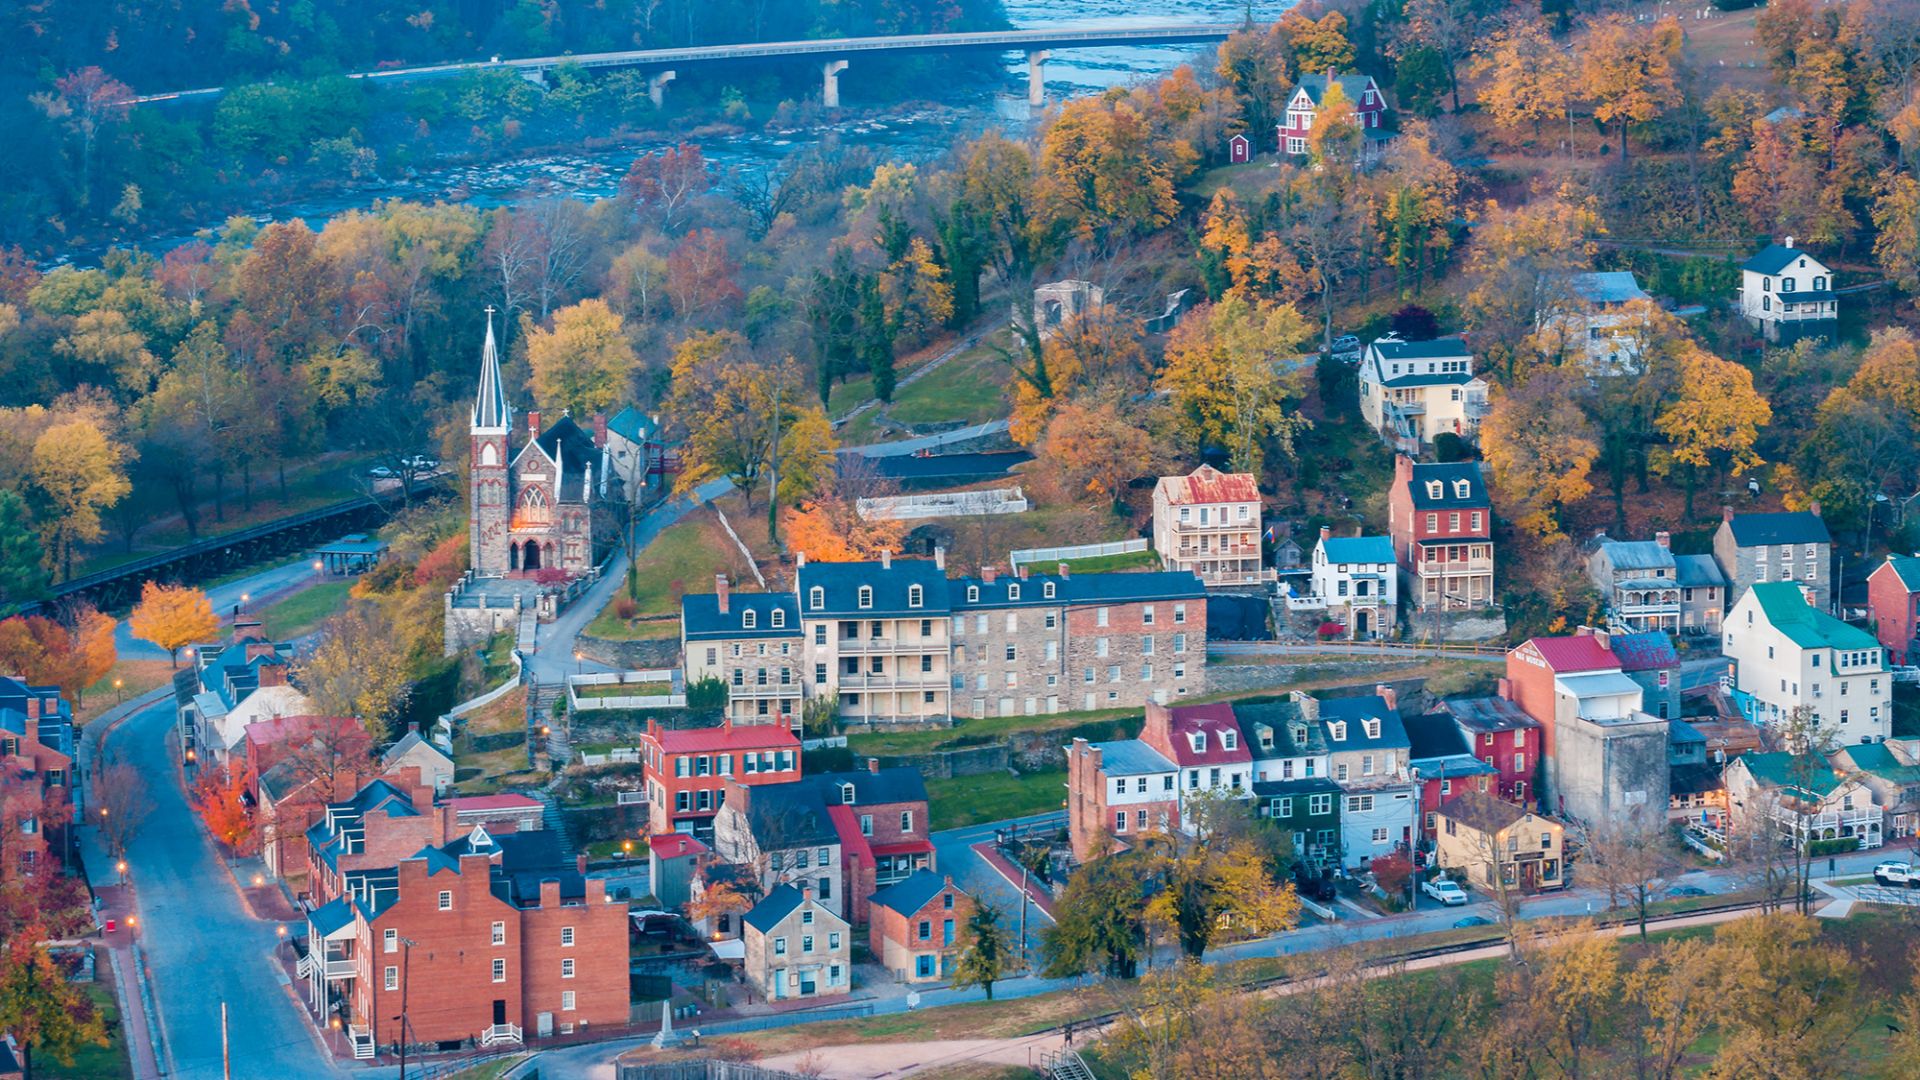
50: West Virginia (72.2 Years)
Male: 69.5 years
Female: 75.1 years
West Virginia’s number reflects the harder side of the Appalachian health map: rural communities, long drives for care, economic strain, and long-running chronic health challenges. The gender gap is also big here, with women outliving men by more than five and a half years.
 Jesse Lee Tucker, Wikimedia Commons
49: Mississippi (72.6 Years)
Male: 69.5 years
Female: 75.7 years
Mississippi’s number fits a larger Deep South pattern, where health gaps tend to show up early and stick around. Poverty, uneven access to care, chronic conditions, and preventive care gaps all matter here, but the bigger story is how many disadvantages can stack up at once.
 WeaponizingArchitecture, Wikimedia Commons
48: Kentucky (73.6 Years)
Male: 71.1 years
Female: 76.2 years
Kentucky’s ranking feels tied to the Appalachian story without being exactly the same as West Virginia’s. Rural access is part of it, but so are older industrial communities, lower incomes in many counties, and health problems that build over decades.

47: Louisiana (73.8 Years)
Male: 70.6 years
Female: 77.2 years
Louisiana is the kind of state that reminds you culture and health rankings do not always travel together. The food, music, and personality are world-class. The life expectancy number points to tougher realities: inequality, environmental pressure, and uneven access to care.
 TheLionHasSeen, Wikimedia Commons
46: Alabama (73.8 Years)
Male: 70.8 years
Female: 77.0 years
Alabama’s number sits right in the lower Southern cluster, and the male-female gap is part of the story. Women outpace men by more than six years here, which makes the overall number look a little different depending on who you are talking about.
 Quintin Soloviev, Wikimedia Commons
45: Tennessee (73.8 Years)
Male: 70.9 years
Female: 76.9 years
Tennessee has booming cities, mountain towns, music history, and plenty of people moving in—but the life expectancy number tells a less glossy story. The state’s ranking likely reflects the gap between fast-growing urban areas and communities still dealing with rural access, economic strain, and long-running health challenges.
 Quintin Soloviev, Wikimedia Commons
44: Oklahoma (73.8 Years)
Male: 71.3 years
Female: 76.5 years
Oklahoma is one of those states where the rounded number looks almost identical to several neighbors, but the context still matters. Rural medical access, chronic health conditions, road safety, and wide geographic spread can all tug the number downward.

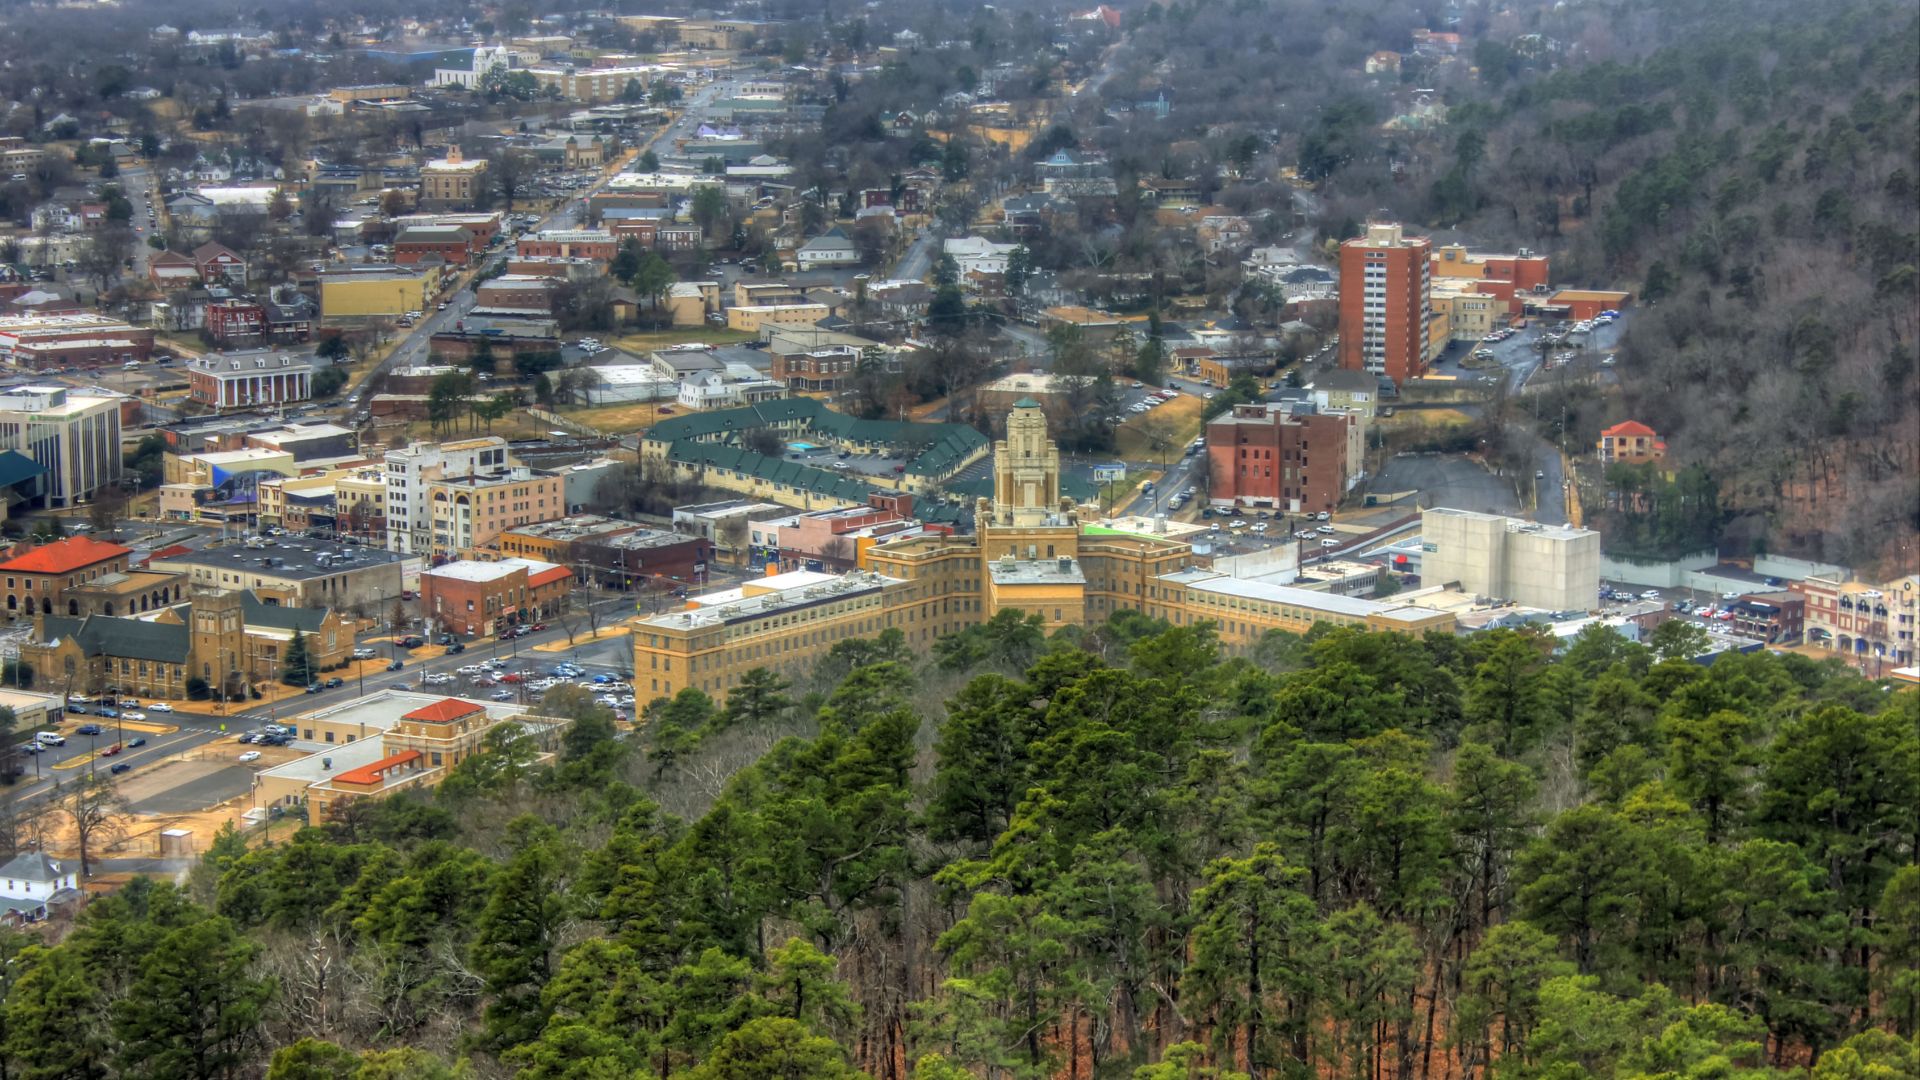
43: Arkansas (73.9 Years)
Male: 71.3 years
Female: 76.6 years
Arkansas sneaks just above the 73.8 group, but not by enough to make anyone feel comfortable. The state’s number fits the regional pattern: rural care access, income gaps, nutrition challenges, and chronic conditions all likely play a role.
42: New Mexico (74.5 Years)
Male: 71.2 years
Female: 78.1 years
New Mexico is the rare Western state near the bottom, and the gender gap is impossible to miss. Women outlive men by nearly seven years here, the widest gap in the CDC table. That makes the state’s overall number feel especially lopsided.
 Debernardi, CC BY-SA 3.0, Wikimedia Commons
41: South Carolina (75.1 Years)
Male: 72.2 years
Female: 78.1 years
South Carolina clears the 75-year mark, but it is still in the lower tier. The state’s number likely reflects a blend of rural access, chronic disease rates, income differences, and health gaps between fast-growing coastal areas and inland communities.
 Akhenaton06, CC BY-SA 3.0, Wikimedia Commons
40: Missouri (75.2 Years)
Male: 72.5 years
Female: 78.1 years
Missouri lands in that uncomfortable zone where it is not at the very bottom, but it is still clearly on the lower end. Its number likely reflects the state’s split personality: stronger health access around major metros, but bigger challenges in rural communities and economically strained regions.

39: Indiana (75.4 Years)
Male: 72.7 years
Female: 78.2 years
Indiana is not last, not close to first, and not really hiding in the middle either. The state’s number likely reflects chronic health conditions, income and education gaps, and uneven access to preventive care outside its bigger population centers.
 Daniel Schwen, Wikimedia Commons
38: Ohio (75.6 Years)
Male: 73.0 years
Female: 78.3 years
Ohio is a big, complicated state, and the life expectancy number lands right in that complicated middle-lower zone. Older industrial regions, economic strain in some communities, chronic health challenges, and uneven access to care all likely help explain why it does not rank higher.

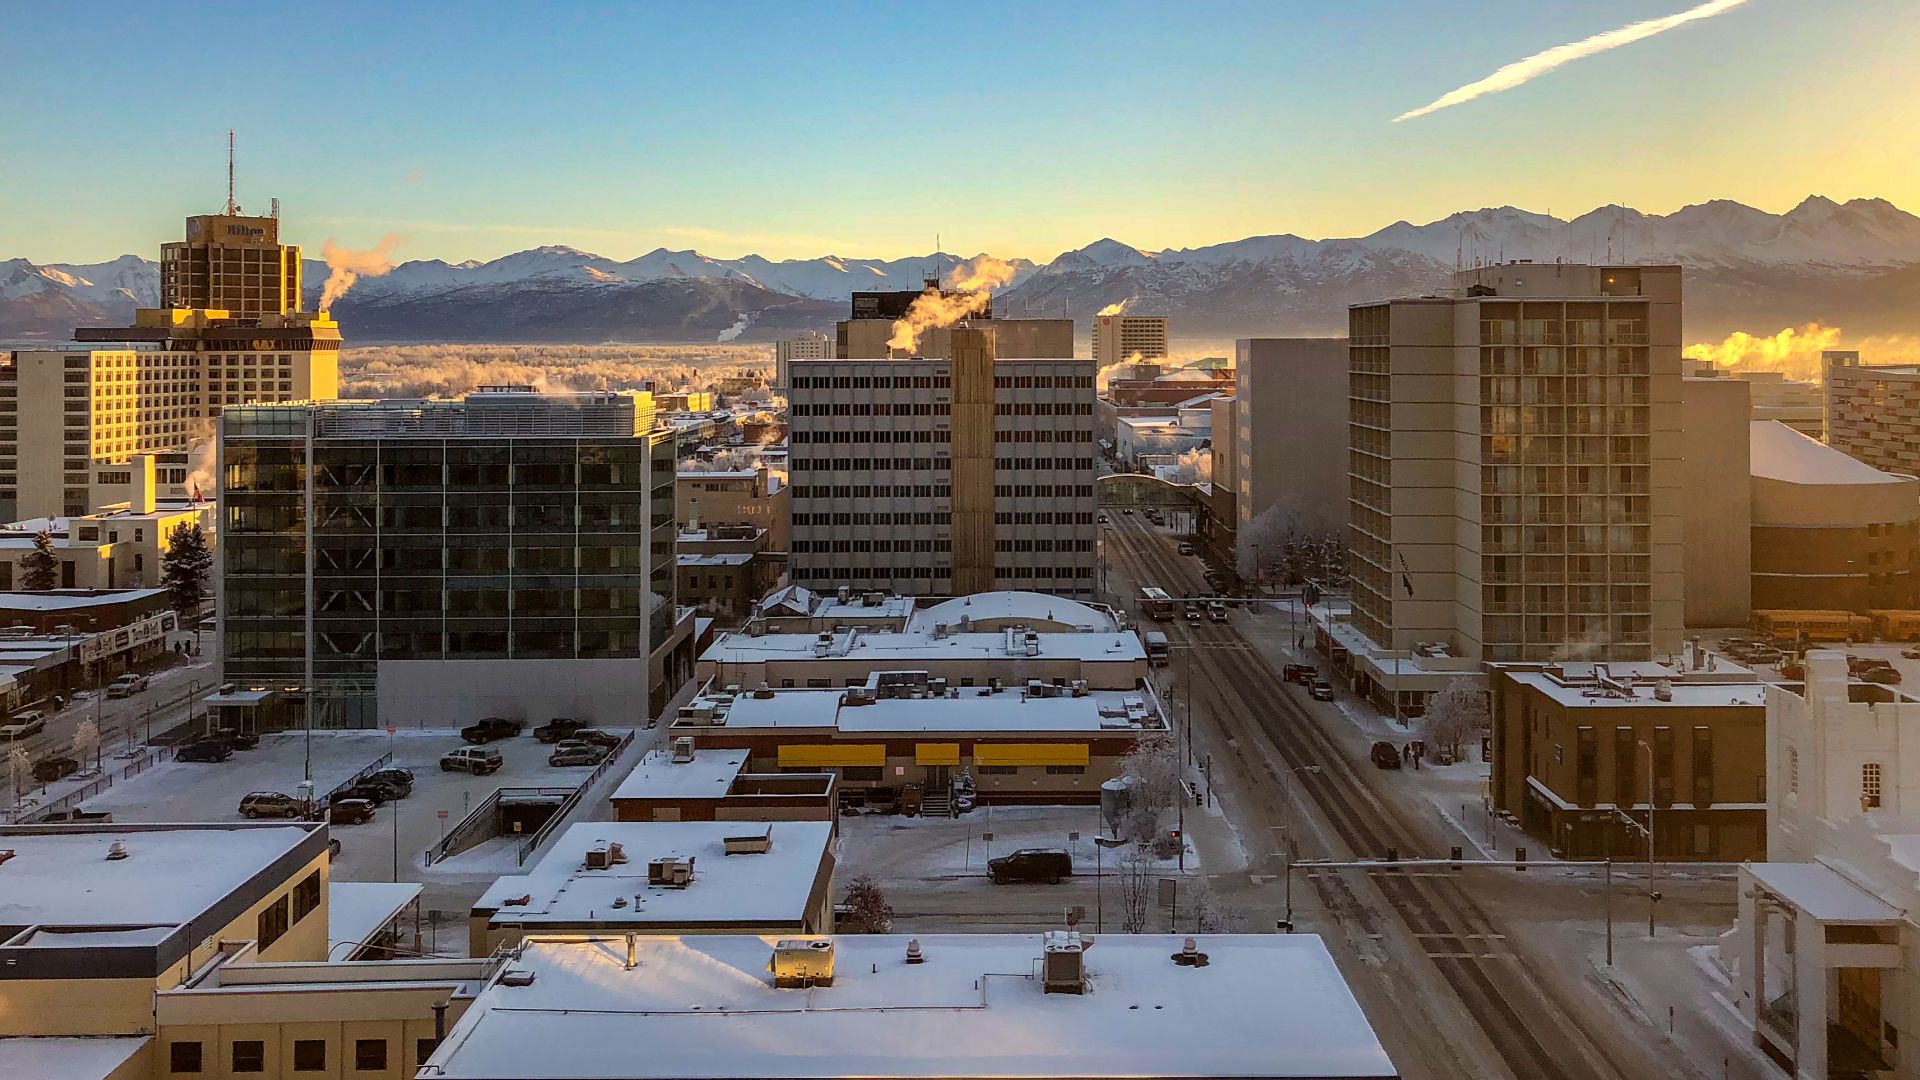
37: Alaska (75.8 Years)
Male: 73.7 years
Female: 78.3 years
Alaska is one of the most unique states in the country, but this ranking is not exactly a postcard moment. Remote geography matters here. When medical care can mean long flights, harsh weather, and limited specialist access, the numbers are going to feel that distance.
 Will Buckner, Wikimedia Commons
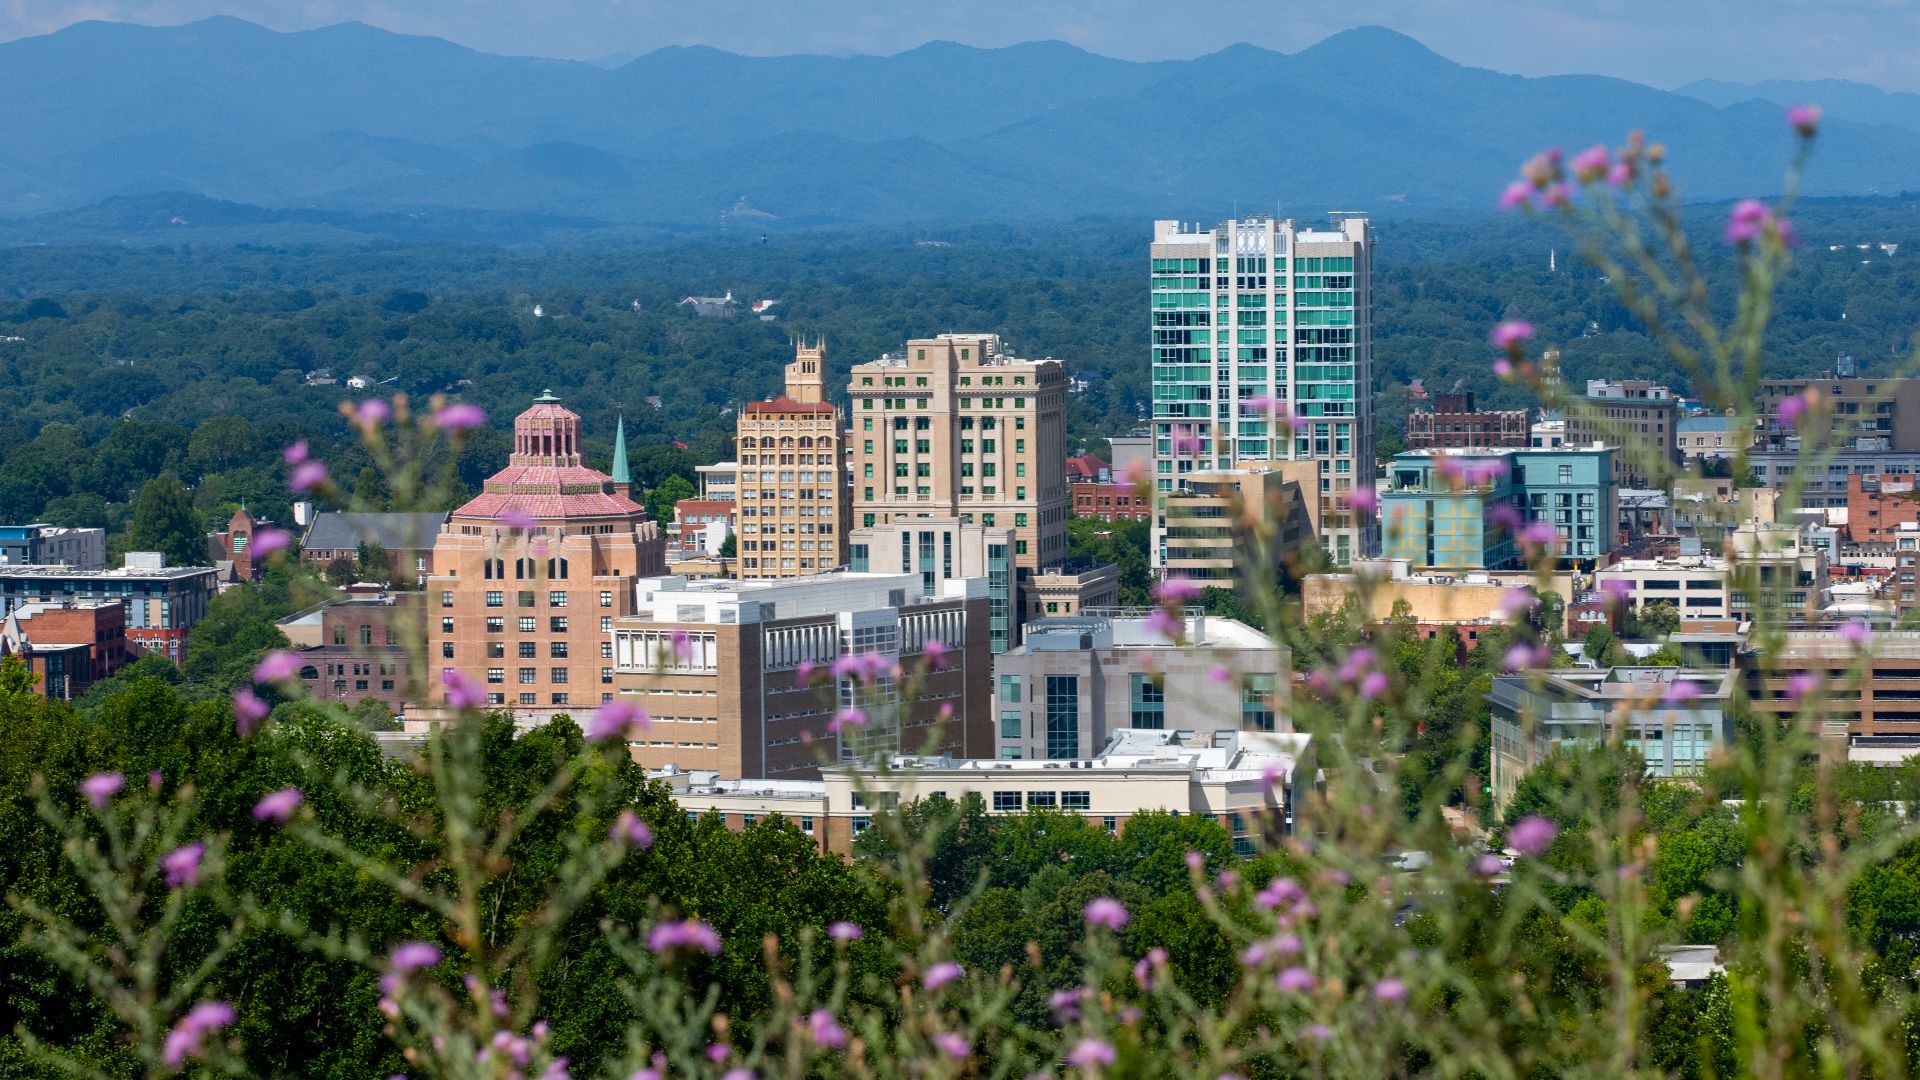
36: North Carolina (75.9 Years)
Male: 73.0 years
Female: 78.7 years
North Carolina has been booming for years, but life expectancy has not exactly kept pace with the relocation hype. The state’s number likely reflects a divide between growing metro areas and communities facing rural access issues, income gaps, and chronic health challenges.
 Asheville Photography, Wikimedia Commons
35: Georgia (75.9 Years)
Male: 73.1 years
Female: 78.6 years
Georgia’s economy may be huge, but the statewide life expectancy number shows how much Atlanta cannot carry the whole map by itself. Rural hospital access, income gaps, chronic disease rates, and uneven preventive care likely keep the state from climbing higher.
 JJonahJackalope, Wikimedia Commons
34: Nevada (76.4 Years)
Male: 74.0 years
Female: 79.1 years
Nevada always feels a little hard to categorize, and this ranking fits that perfectly. Las Vegas and Reno are one story. Remote communities are another. Rapid growth, cost-of-care issues, and big regional differences likely all show up in the final number.
 Reinhard Link from Germany, Wikimedia Commons
33: Kansas (76.5 Years)
Male: 74.1 years
Female: 78.9 years
Kansas is almost exactly where “middle of the pack” starts to feel generous. The state likely benefits from solid health systems in some areas, but rural access challenges, chronic health conditions, and transportation barriers keep it from feeling like a true longevity standout.
 Dean Hochman from Overland Park, Kansas, U.S., Wikimedia Commons
32: Delaware (76.5 Years)
Male: 73.6 years
Female: 79.5 years
Delaware is small, but the number is not simple. The female figure is fairly strong, while the male number pulls the total down. That kind of gap points to very different health stories inside a state people often treat like one compact little footnote.
 Tim Kiser (User:Malepheasant), Wikimedia Commons
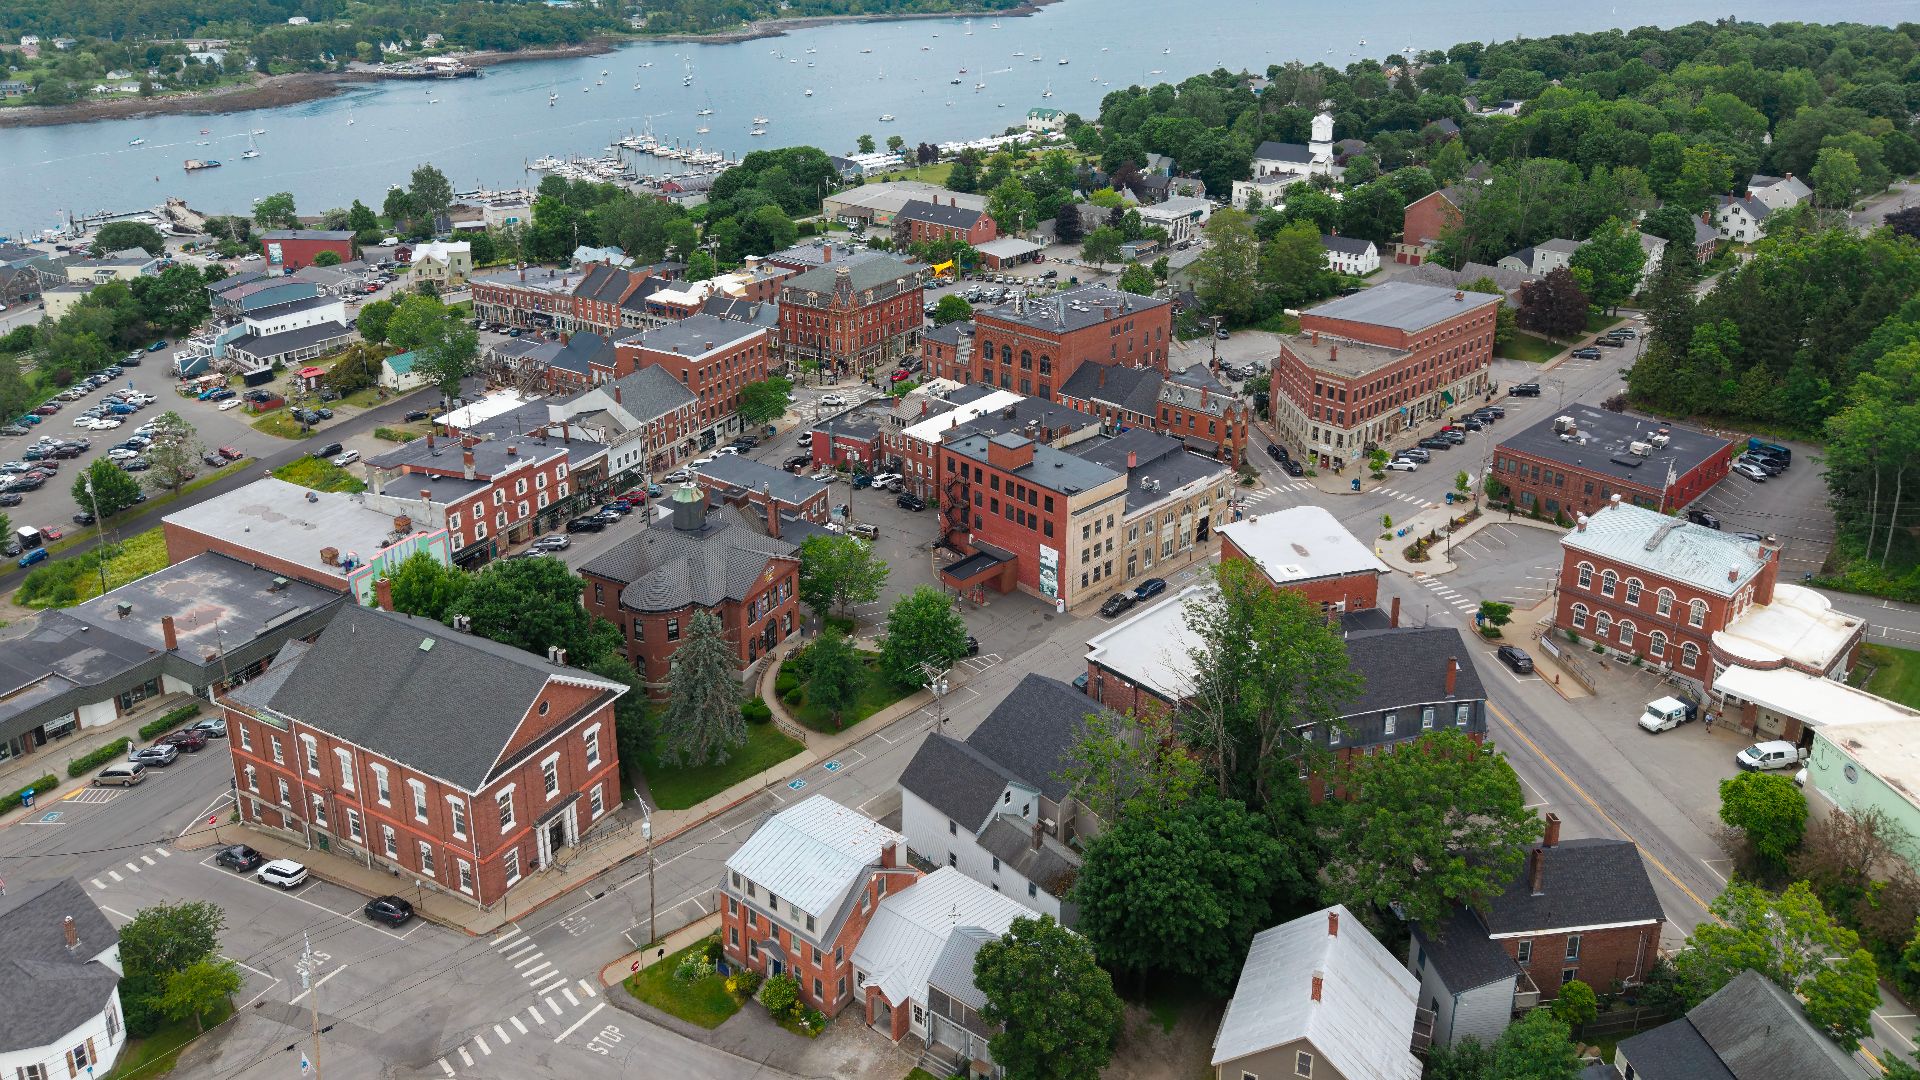
31: Maine (76.6 Years)
Male: 73.9 years
Female: 79.6 years
Maine is a good example of how “beautiful place to retire” does not automatically mean top-tier life expectancy. The state’s older population, rural geography, and long drives to specialized care probably keep it from ranking higher, even with all that coastal charm.
 Quintin Soloviev, Wikimedia Commons
30: Arizona (76.7 Years)
Male: 73.7 years
Female: 79.9 years
Arizona is a major retirement magnet, but the life expectancy number does not quite match the snowbird fantasy. Rapid growth, heat-related health pressures, cost-of-care issues, and big gaps between urban, rural, and tribal communities likely make the state harder to sum up.
 tifoultoute, Wikimedia Commons
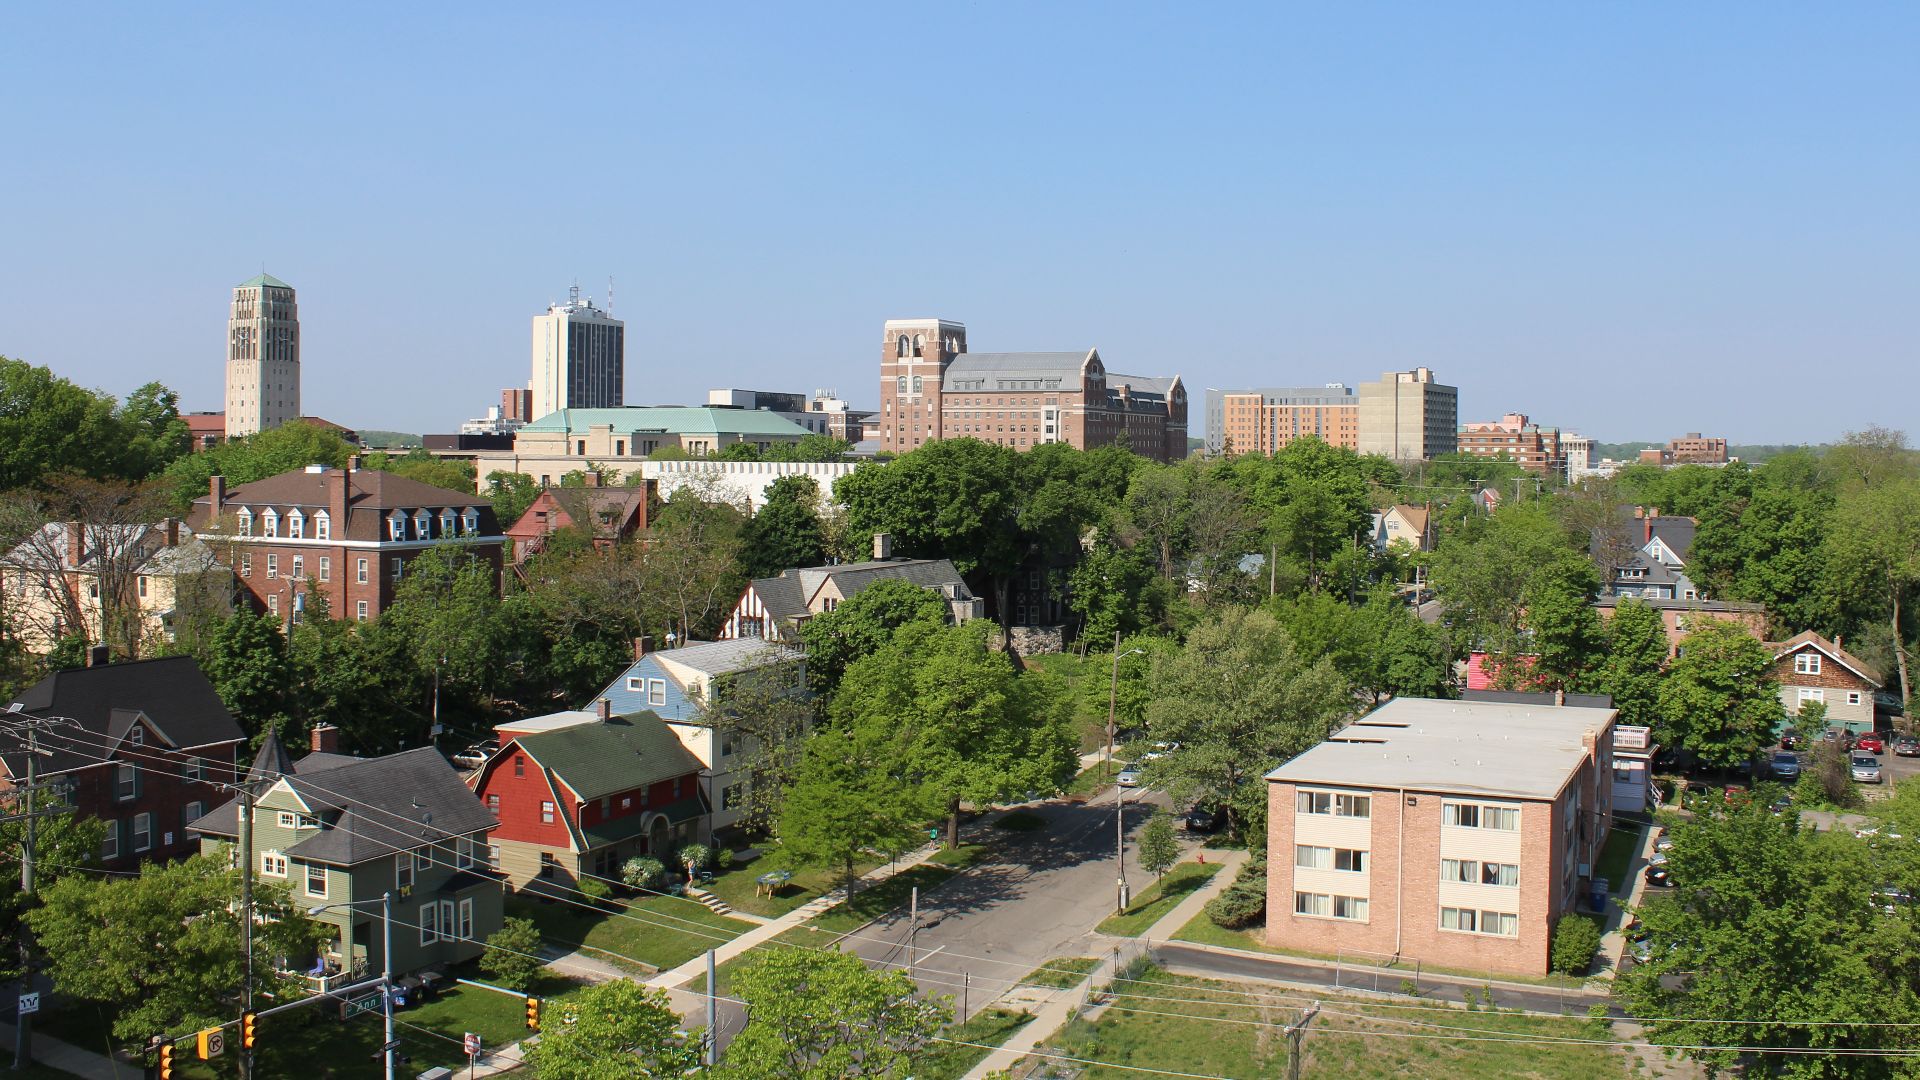
29: Michigan (76.8 Years)
Male: 74.3 years
Female: 79.3 years
Michigan sits near the middle, but still on the lower side of it. The number likely reflects a complicated mix of older industrial communities, income gaps, chronic health challenges, and better access around major metro areas than in some rural regions.
 Dwight Burdette, Wikimedia Commons
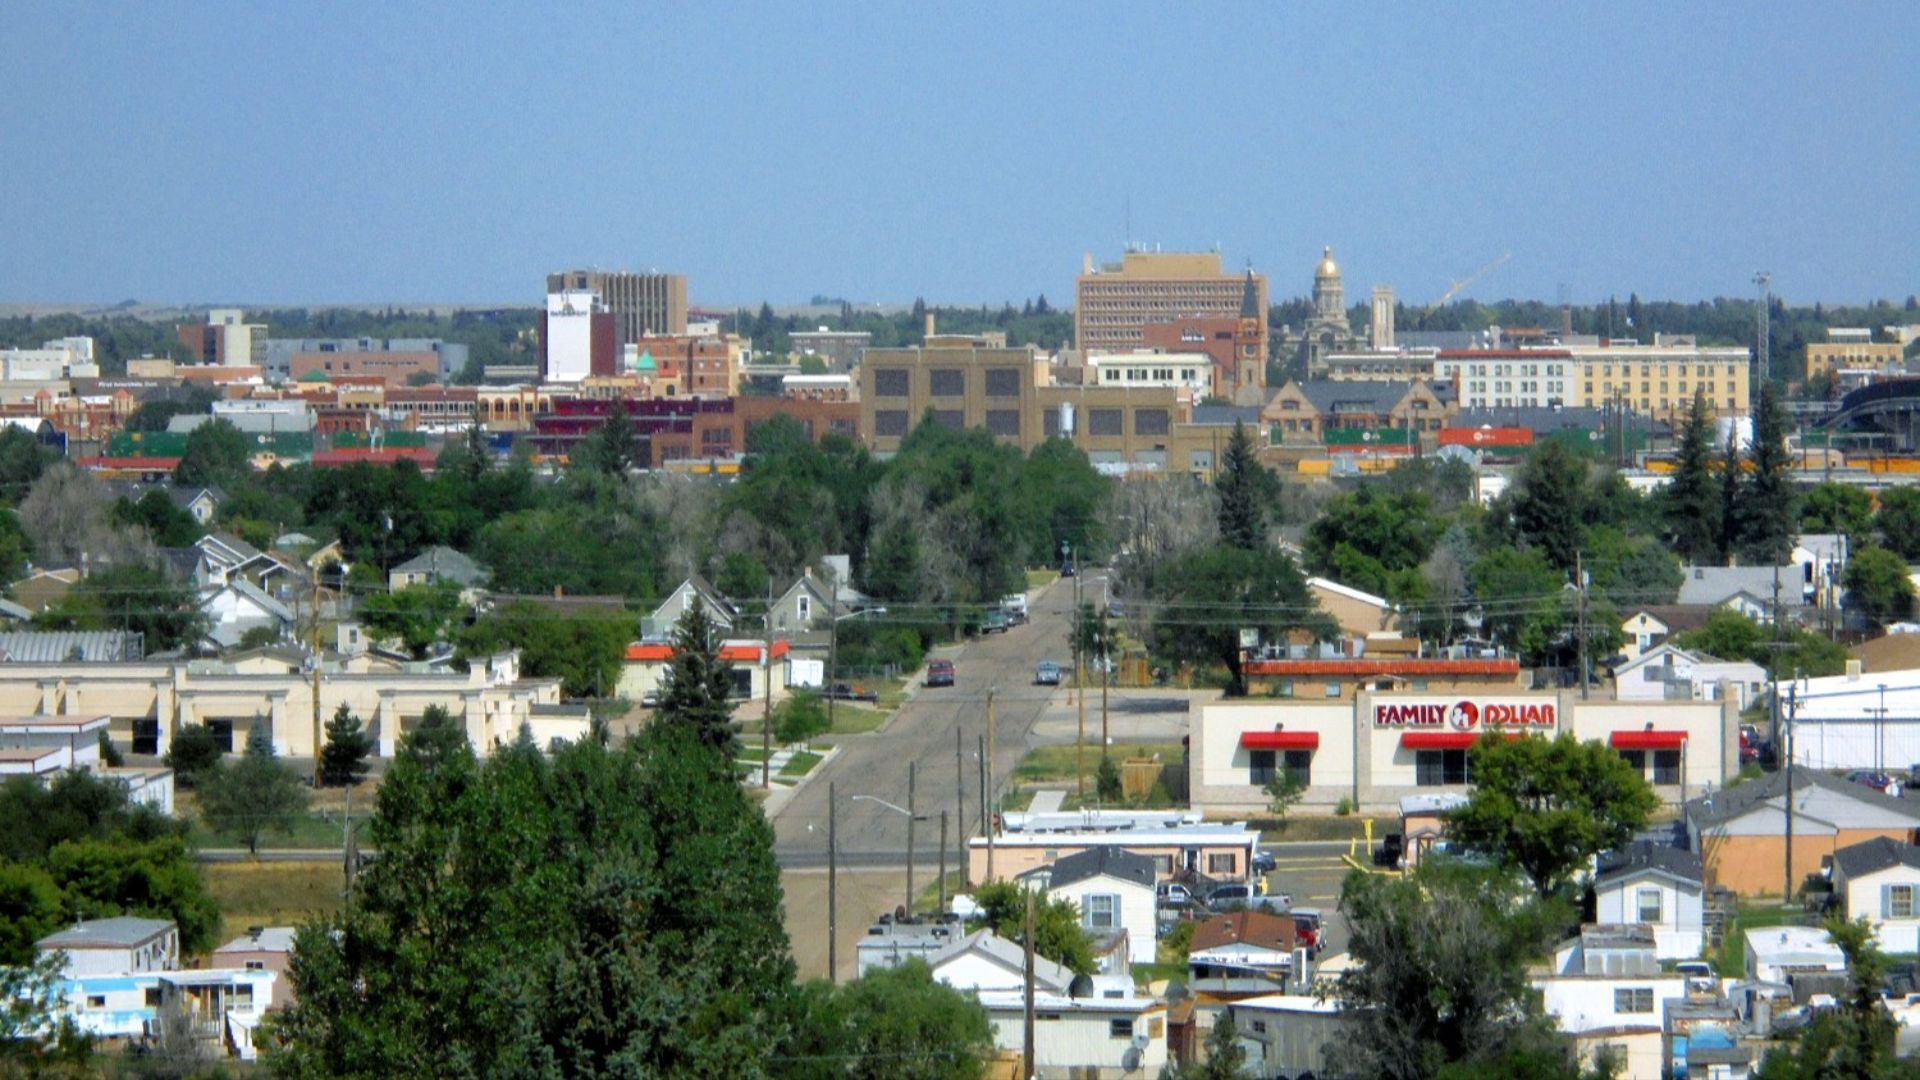
28: Wyoming (76.8 Years)
Male: 74.6 years
Female: 79.3 years
Wyoming has the open space, the scenery, and the postcard version of rugged living. But those same distances can make health care harder to reach. Limited specialist access and long drives likely keep the state from ranking as high as its views deserve.
 Vasiliymeshko, Wikimedia Commons
27: Texas (77.1 Years)
Male: 74.6 years
Female: 79.8 years
Texas lands just below the middle of the pack, which may surprise people given its size, wealth, and nonstop confidence. The state’s number likely reflects huge differences between regions, insurance coverage gaps, rural access issues, and fast-growing cities that do not all share the same health profile.
 Jason Villanueva, Wikimedia Commons
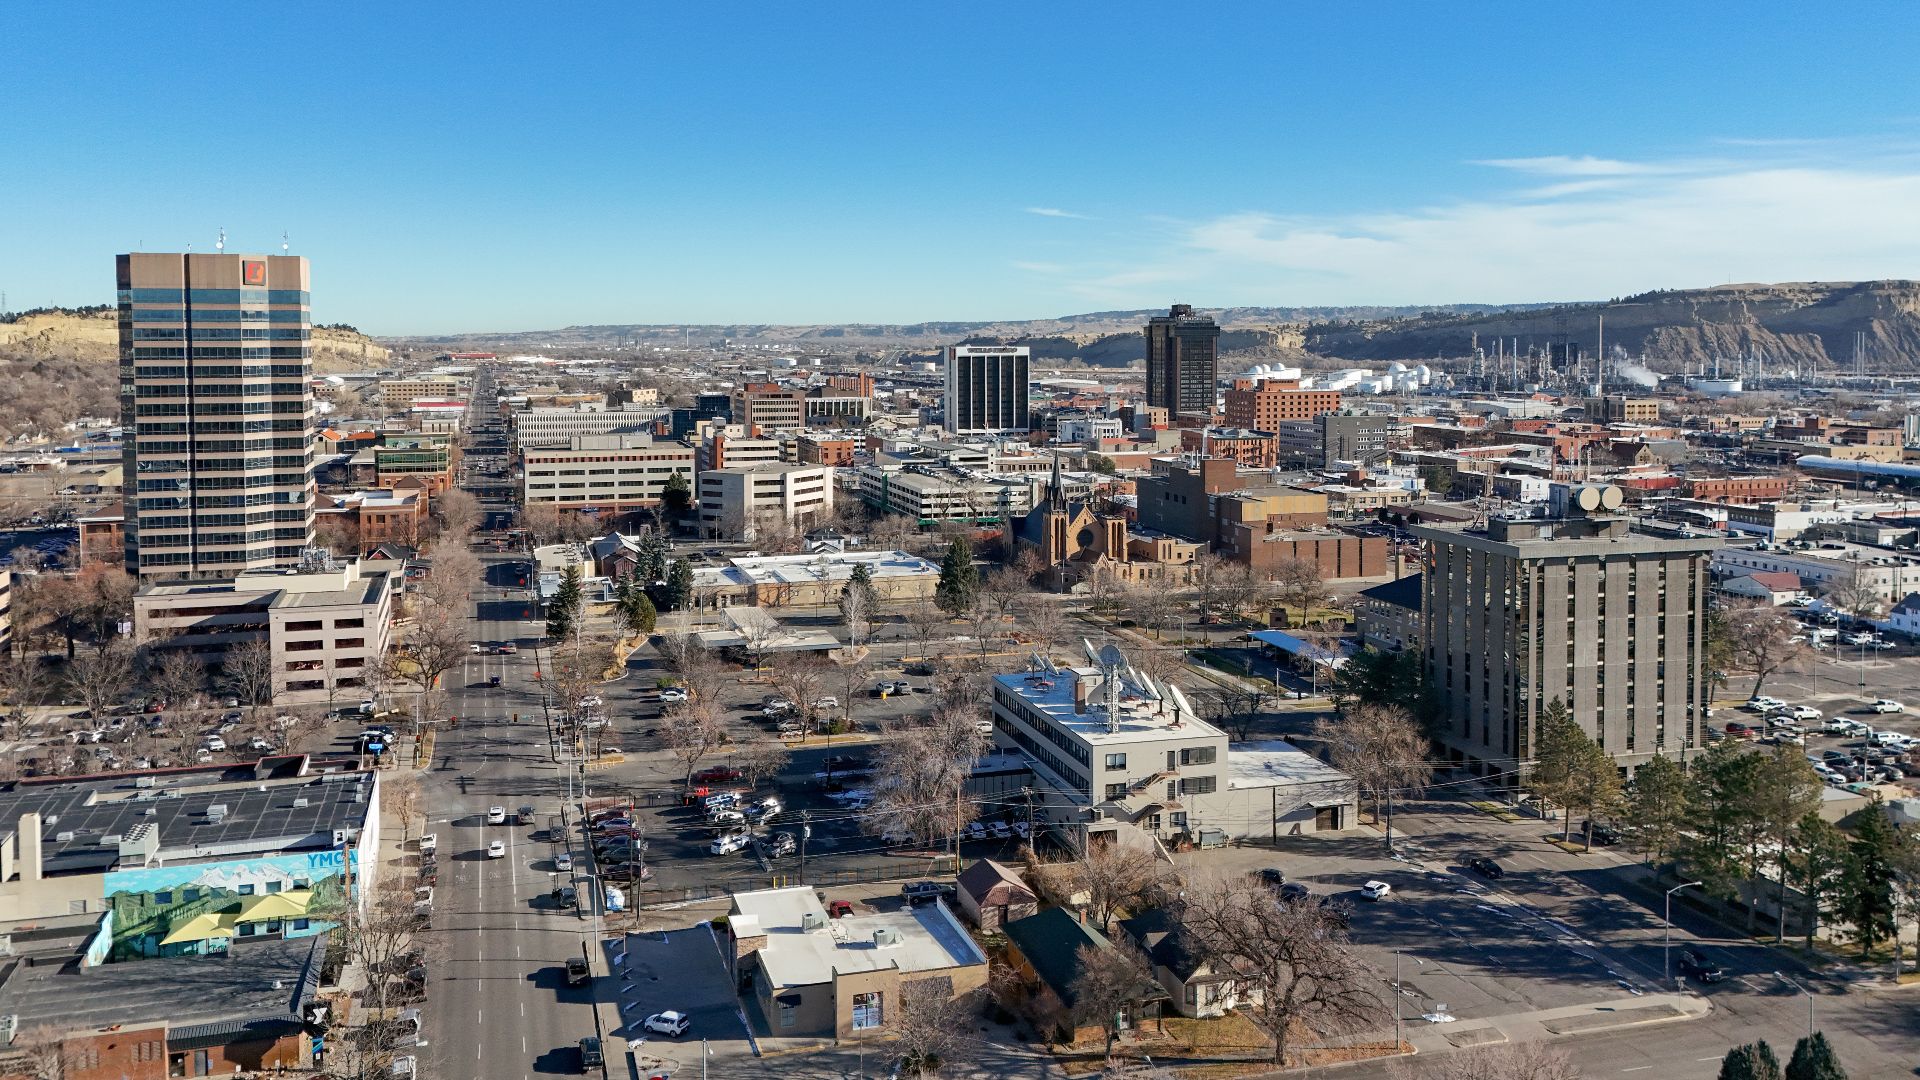
26: Montana (77.3 Years)
Male: 74.9 years
Female: 80.0 years
Montana’s number feels like a tradeoff. Outdoor lifestyle and smaller communities may help, but rural reality still matters. Long travel distances, limited specialist access, and smaller hospital networks can make life in Big Sky Country more complicated than the tourism ads suggest.
 Quintin Soloviev, Wikimedia Commons
25: South Dakota (77.3 Years)
Male: 75.2 years
Female: 79.5 years
South Dakota lands almost perfectly in the middle, and the male-female gap is narrower than in many lower-ranked states. That does not make the story simple, though. Rural access, harsh weather, community stability, and regional health gaps all likely pull in different directions.
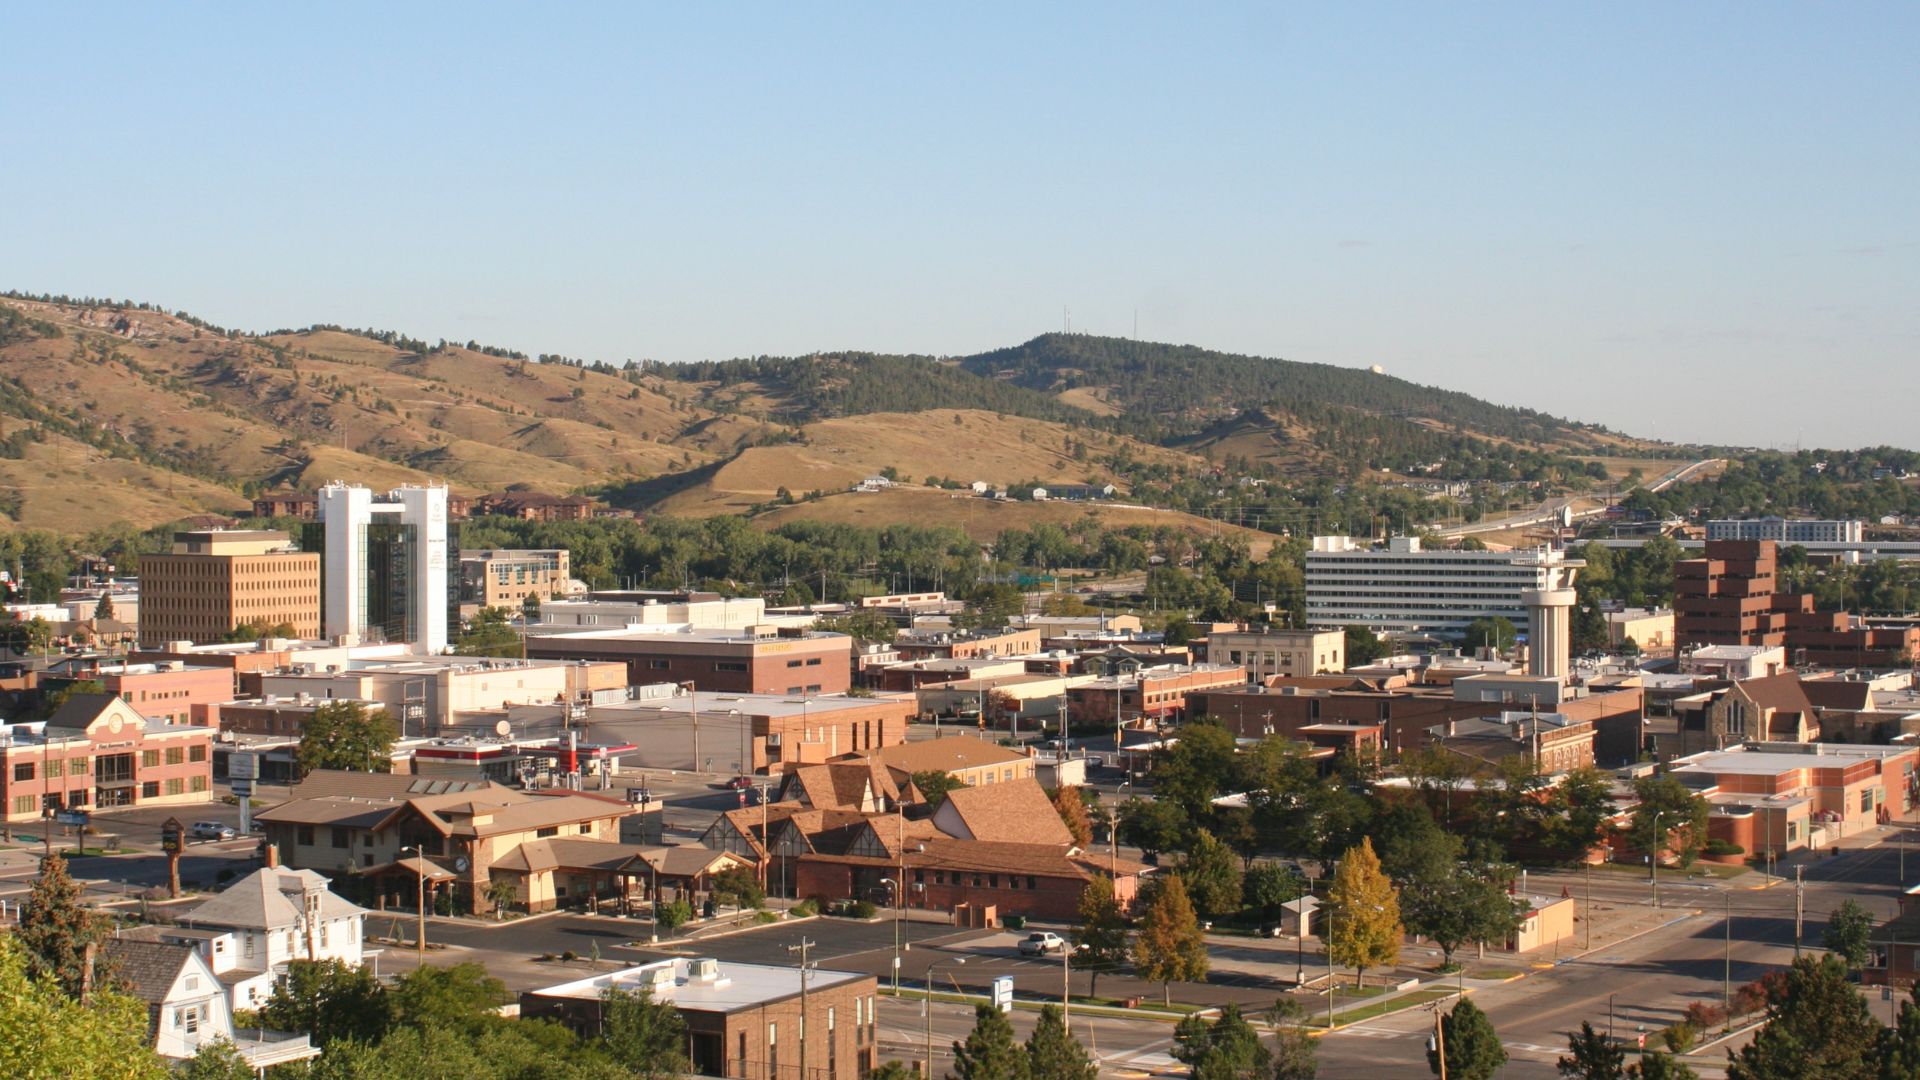 WeaponizingArchitecture, Wikimedia Commons
24: Pennsylvania (77.3 Years)
Male: 74.7 years
Female: 79.9 years
Pennsylvania’s number feels very Pennsylvania: important, complicated, and hard to sum up neatly. Strong medical centers help in some regions, while older industrial communities, rural access issues, and income gaps keep the state from joining its higher-ranked Northeastern neighbors.
 Popscreenshot, Wikimedia Commons
23: Virginia (77.5 Years)
Male: 75.0 years
Female: 79.9 years
Virginia sits right at the national life expectancy figure, which was 77.5 years in the same CDC table. That makes it one of the cleanest “middle America” markers in the ranking, with wealthy suburbs, rural communities, military towns, and smaller cities all pulling the number in different directions.

22: Illinois (77.5 Years)
Male: 74.9 years
Female: 80.3 years
Illinois also matches the national figure when rounded, but the female number clears 80 while the male number stays under 75. That gap gives the state a little extra texture. Strong health systems and high-income suburbs help, but regional differences still show up.
 Diego Delso, Wikimedia Commons
21: Oregon (77.7 Years)
Male: 75.2 years
Female: 80.4 years
Oregon just misses the top 20, but it is still above the national mark. The state likely benefits from health-conscious communities and outdoor access in some areas, while housing costs, rural care access, and regional income gaps keep it from climbing higher.

20: Maryland (77.8 Years)
Male: 75.1 years
Female: 80.5 years
Maryland cracks the top 20, which makes sense when you look at its strong medical institutions and high-income communities. But the state also has deep gaps between counties, cost-of-care issues, and uneven access to preventive services. It is strong, but not simple.
 Quintin Soloviev, Wikimedia Commons
19: Florida (77.9 Years)
Male: 75.2 years
Female: 80.7 years
Florida’s number is interesting because it has so many older residents, yet still lands above the national mark. Strong health care access in major metro areas likely helps, but the state’s wide income gaps and uneven regional outcomes keep it from climbing much higher.
 Andrew Heneen, Wikimedia Commons
18: Iowa (77.9 Years)
Male: 75.6 years
Female: 80.4 years
Iowa is not flashy, which is maybe the most Iowa thing possible, but the number is quietly solid. Stable communities, decent health access in many areas, and a relatively strong female life expectancy help the state land in the upper half.
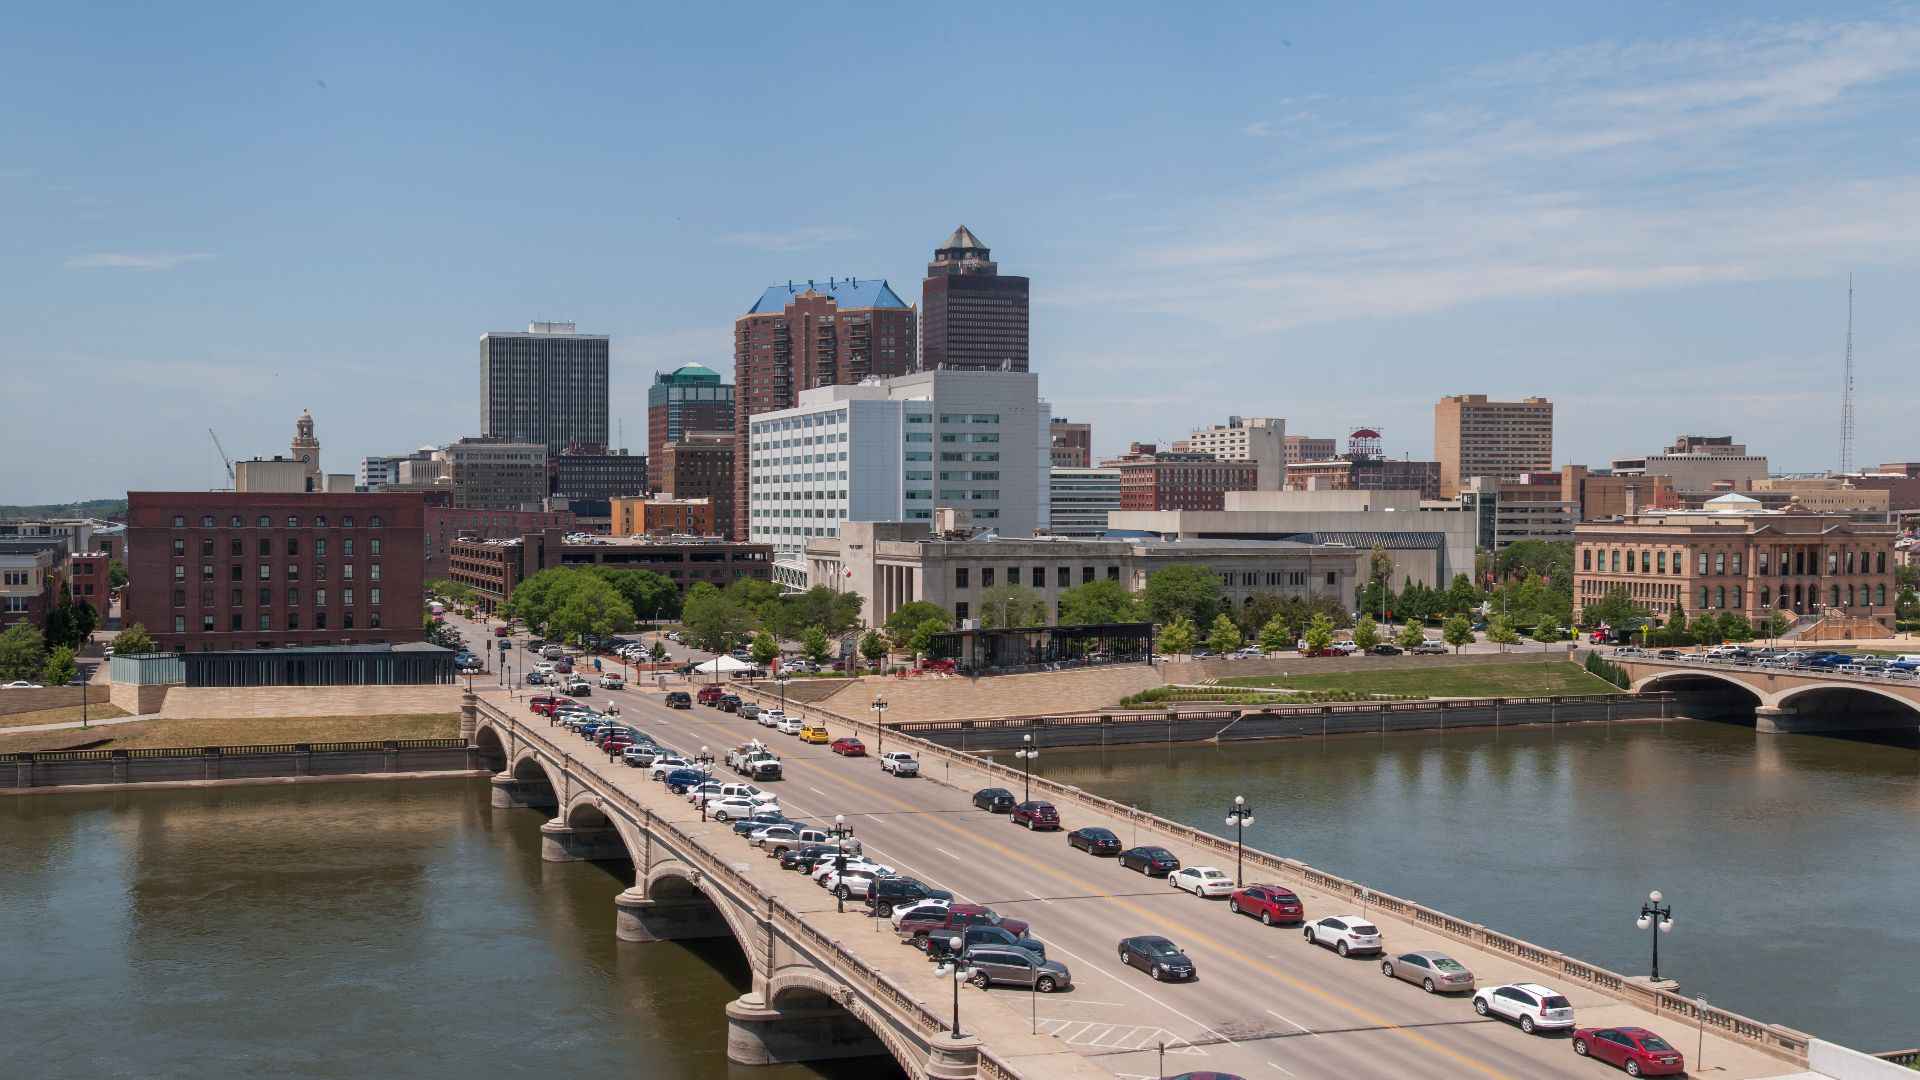 Carl Wycoff from Nevada, USA, Wikimedia Commons
17: North Dakota (77.9 Years)
Male: 75.4 years
Female: 80.8 years
North Dakota lands in the upper-middle tier, and the female number is stronger than the total might suggest. The state likely reflects a mix of smaller communities, employment stability, rural access challenges, harsh weather, and long distances for more specialized care.
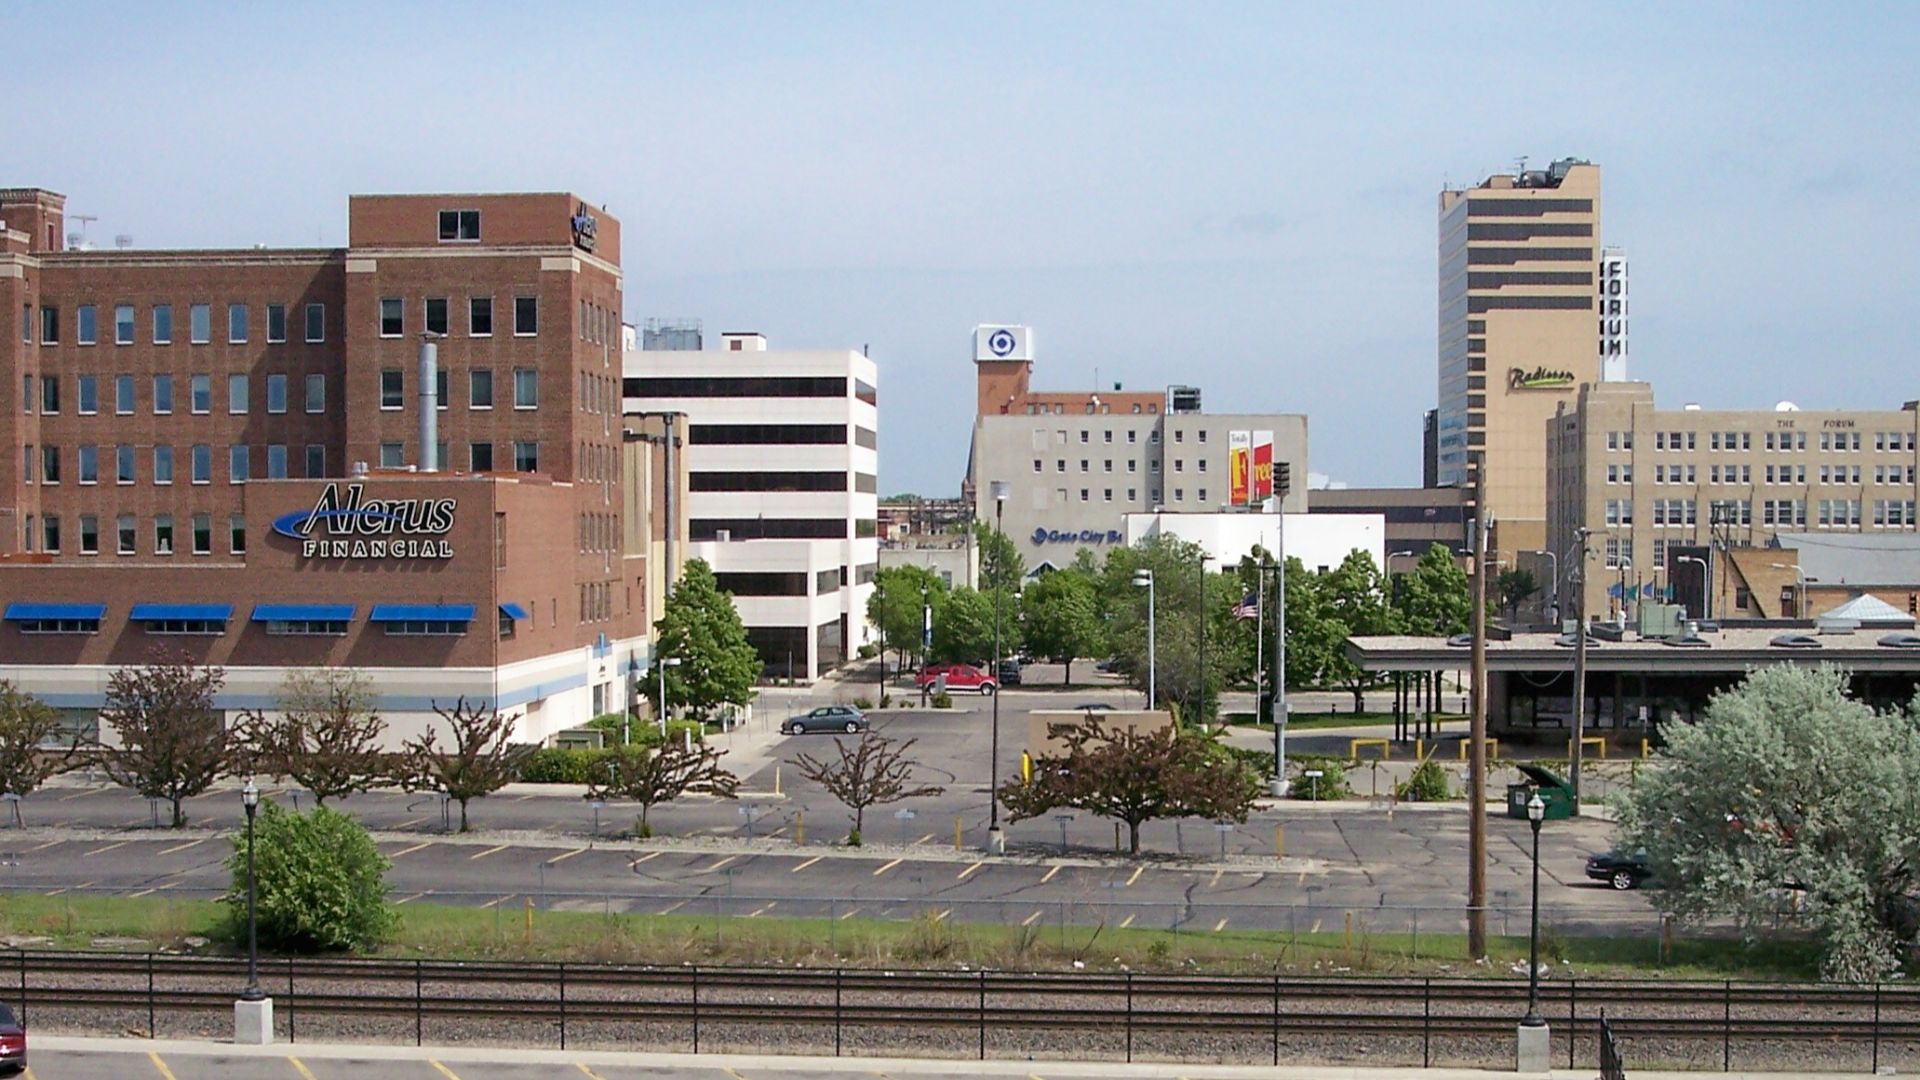 Tim Kiser (w:User:Malepheasant), Wikimedia Commons
16: Wisconsin (78.1 Years)
Male: 75.7 years
Female: 80.7 years
Wisconsin breaks past 78 years, which is enough to move it into stronger territory. Relatively solid health access, community stability, and better-than-average outcomes in many areas probably help. Cheese curds may not be a health food, but apparently the state is doing something right.
 Michael Barera, Wikimedia Commons
15: Vermont (78.3 Years)
Male: 75.8 years
Female: 80.8 years
Vermont ranking this high feels very on brand for a state associated with fresh air, small towns, and people who own suspiciously good hiking boots. Higher education levels, outdoor lifestyles, and community stability likely help, even though rural medical access still matters.
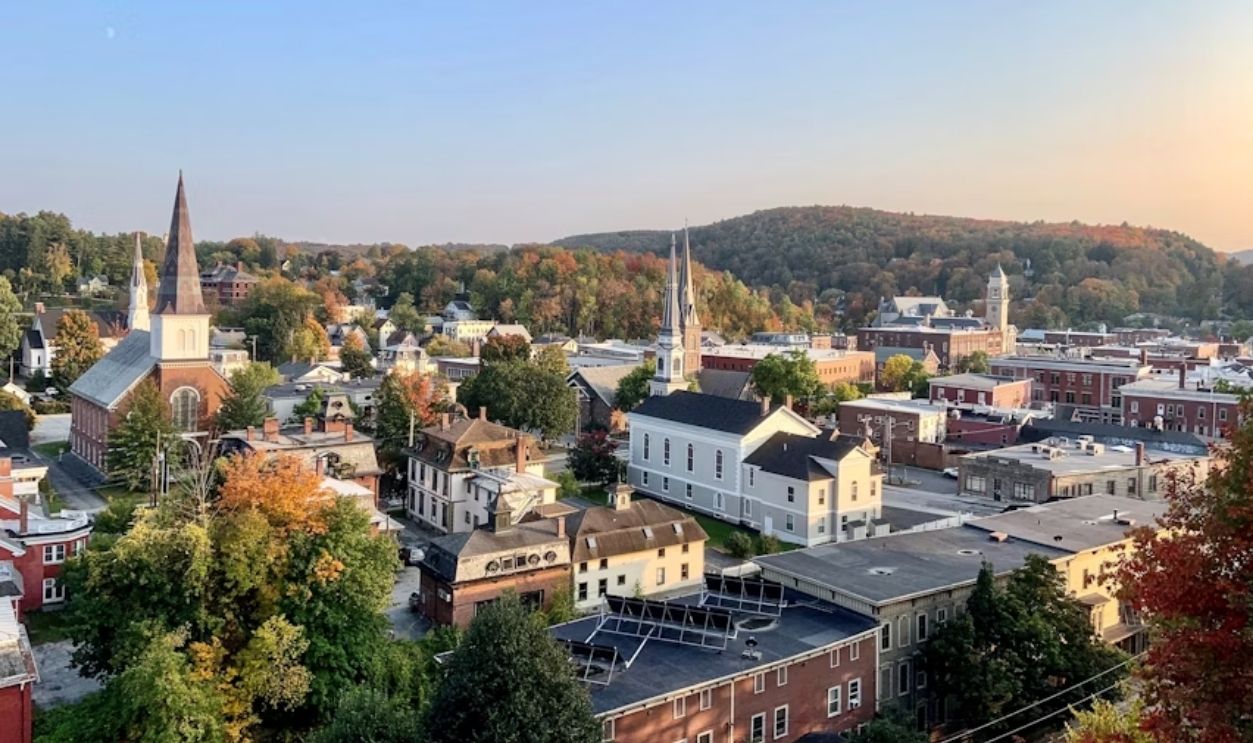
14: Nebraska (78.3 Years)
Male: 76.0 years
Female: 80.7 years
Nebraska’s result is quietly strong, which is probably exactly how Nebraska would want it. Stable communities, decent health systems around population centers, and a male number that holds up better than in many lower-ranked states all help push it into the top 15.
 Tony Webster from Minneapolis, Minnesota, United States, Wikimedia Commons
13: Washington (78.4 Years)
Male: 76.1 years
Female: 80.9 years
Washington lands just outside the top dozen, and the ingredients are not hard to see: higher-income metro areas, strong medical systems, outdoor culture, and high education levels. Housing costs and rural access gaps keep the story from being too neat, though.
 GyozaDumpling, Wikimedia Commons
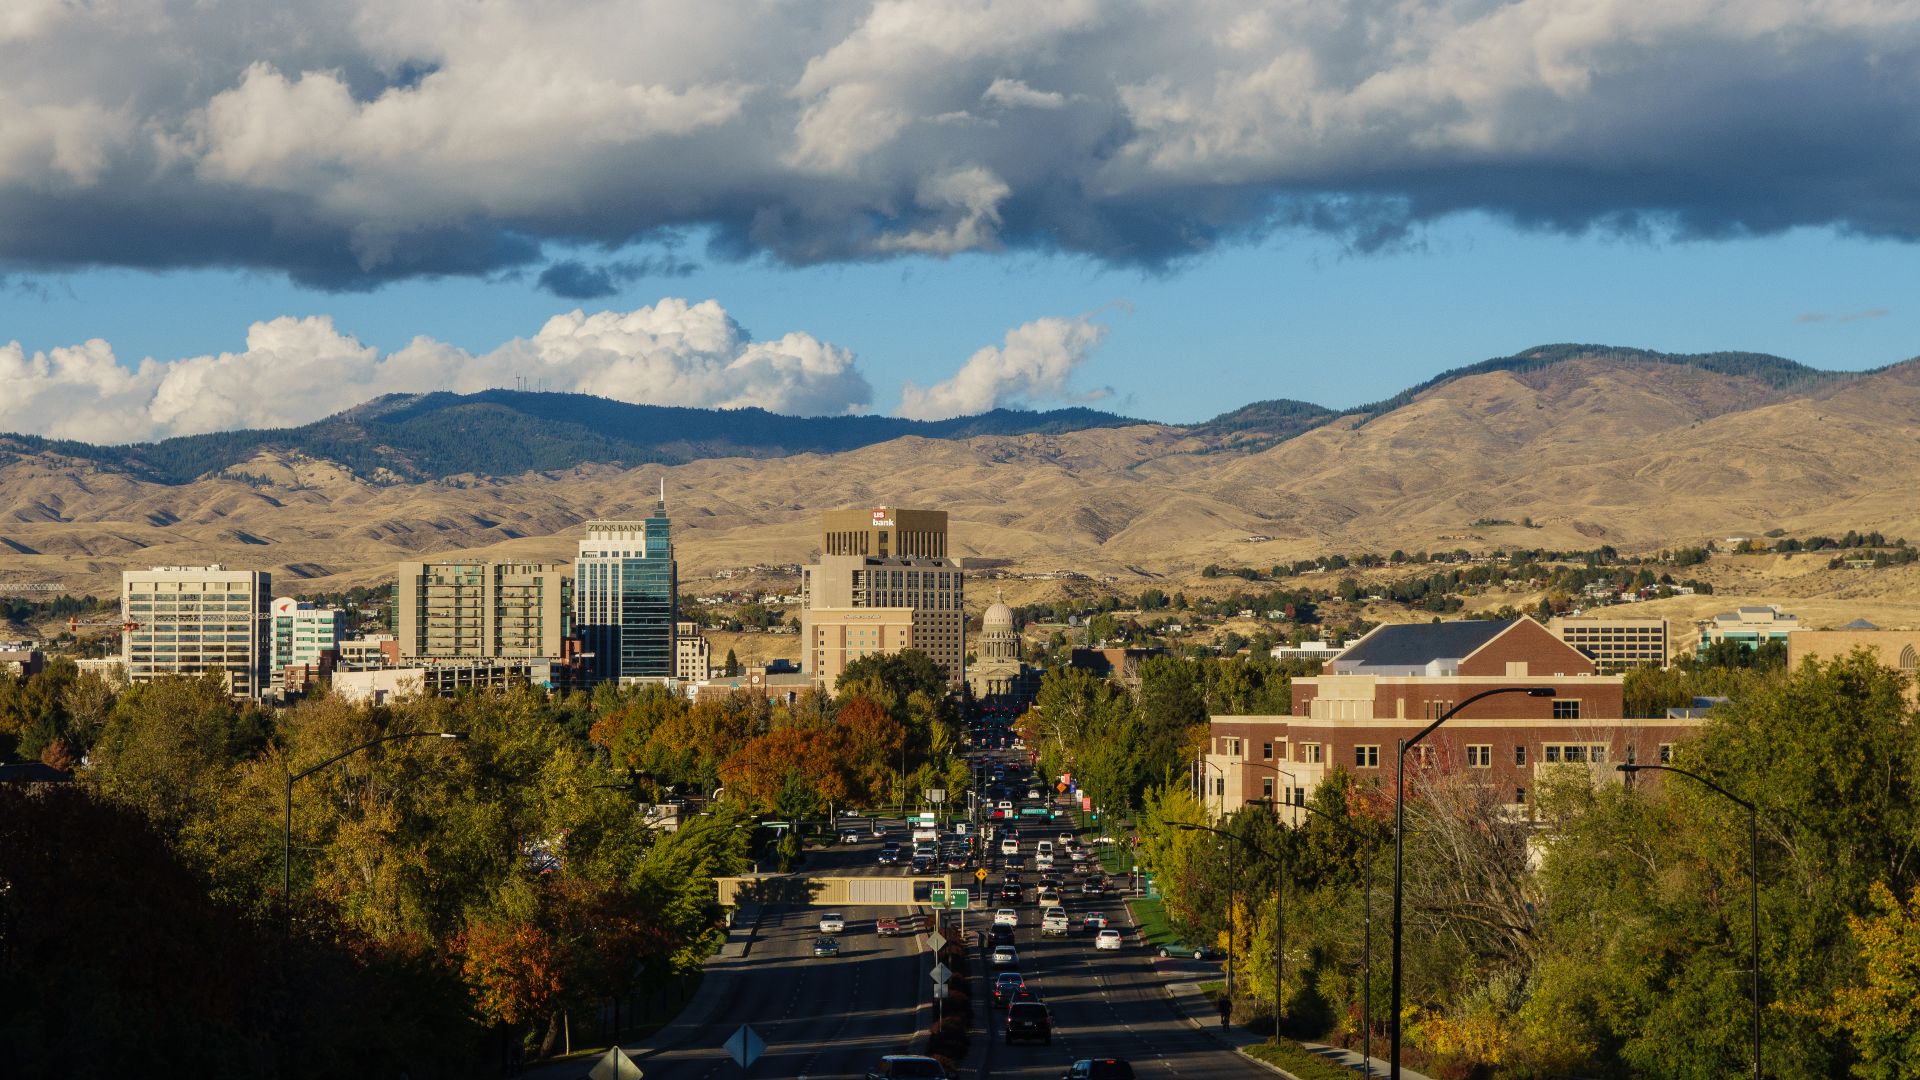
12: Idaho (78.4 Years)
Male: 76.4 years
Female: 80.6 years
Idaho’s number is strong, and the male-female gap is smaller than in many states below it. That helps the overall number hold up. A relatively active population and smaller communities may help, even as rapid growth and rural access challenges complicate the picture.
11: Colorado (78.5 Years)
Male: 76.1 years
Female: 81.0 years
Colorado nearly cracks the top 10, which will surprise absolutely no one who has ever heard a Coloradan mention hiking within three minutes of meeting them. Higher activity levels, income, education, and strong metro health systems likely help keep the state near the top.
 Quintin Soloviev, Wikimedia Commons
10: New Hampshire (78.7 Years)
Male: 76.5 years
Female: 81.0 years
New Hampshire opens the top 10 with a strong number and a relatively sturdy male figure. Higher incomes, education levels, access to care, and proximity to major Northeastern medical networks likely help, even if rural access still matters in parts of the state.
 Quintin Soloviev, Wikimedia Commons
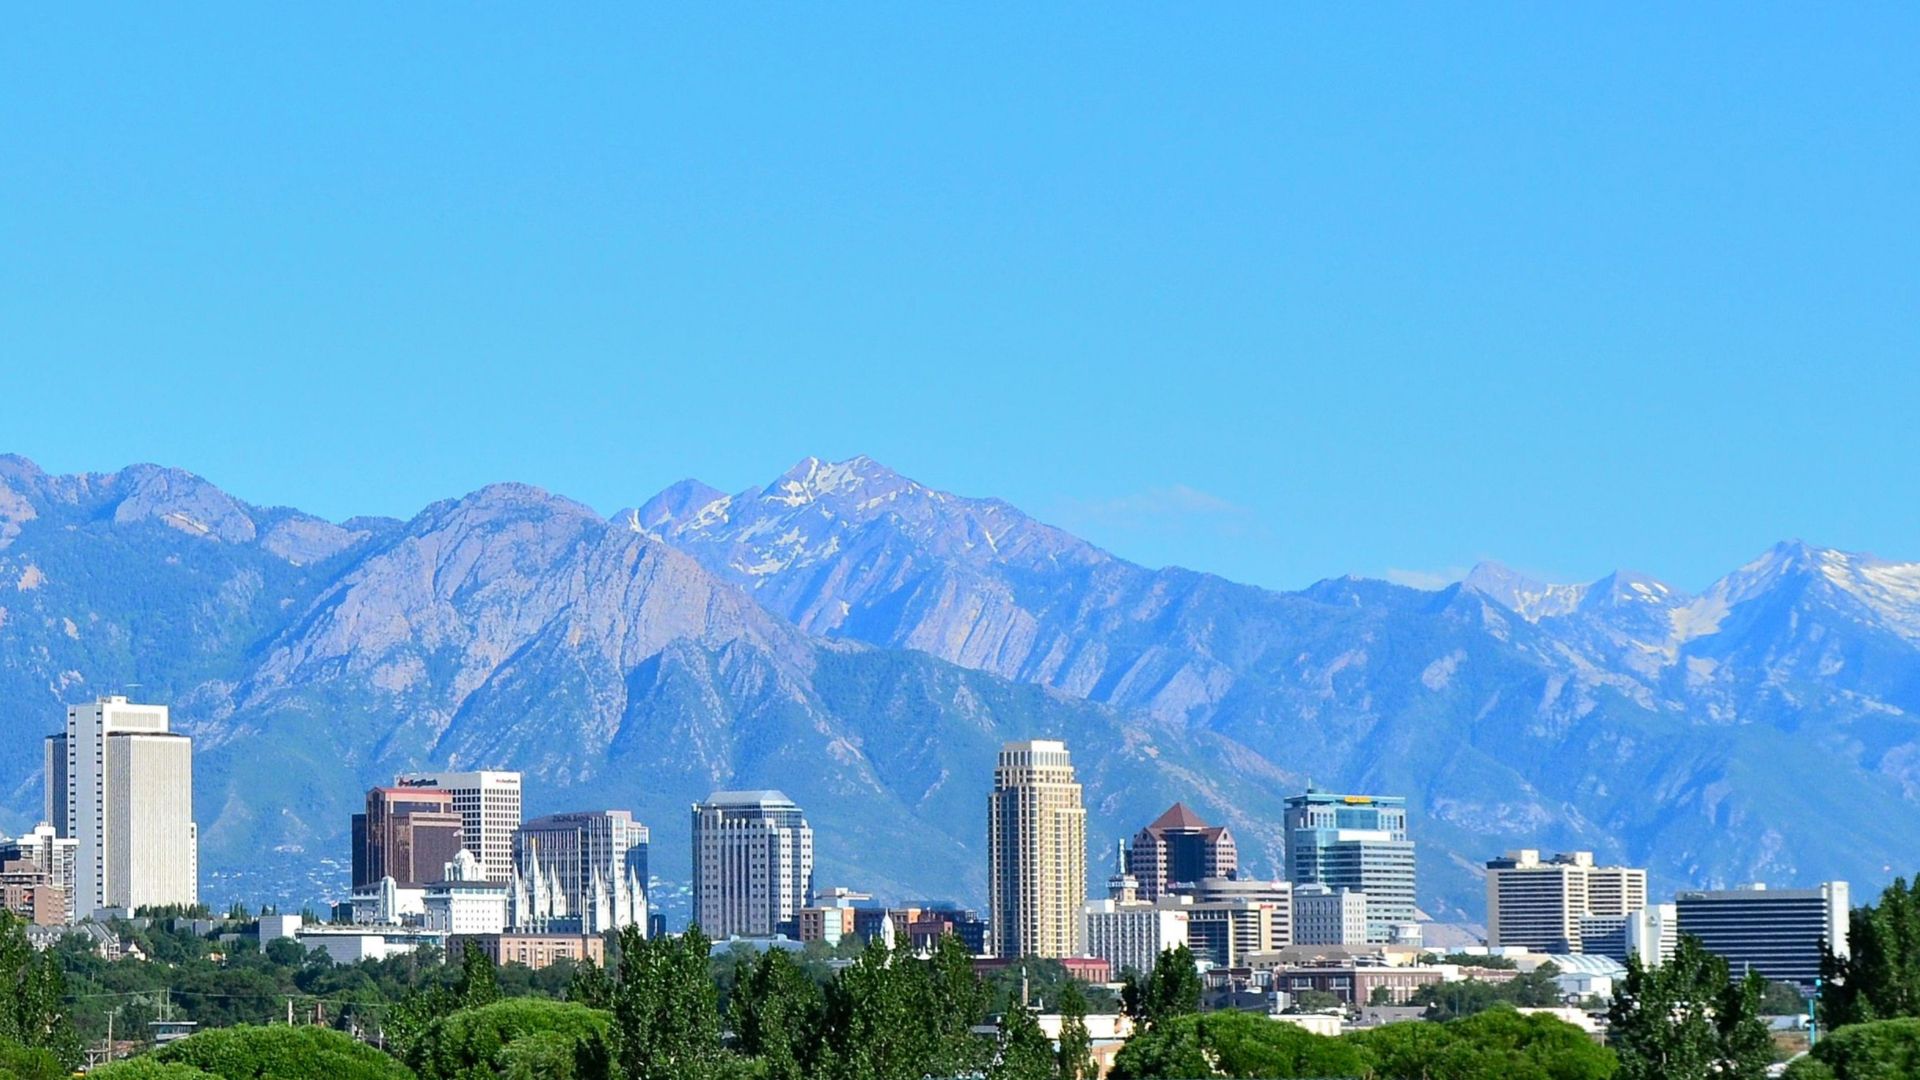
9: Utah (79.0 Years)
Male: 77.3 years
Female: 80.9 years
Utah has the smallest male-female gap in the CDC table, and that is a major reason its overall number is so high. The state’s younger population mix, active lifestyles, family networks, and strong male life expectancy all make it stand out.
 Garrett from Salt Lake City, Wikimedia Commons
8: Rhode Island (79.2 Years)
Male: 76.6 years
Female: 81.8 years
Rhode Island may be tiny, but it does not get tiny results here. Dense access to medical care, proximity to strong regional health systems, and Northeastern income and education patterns likely help. Small state, big life expectancy energy.
 Kenneth C. Zirkel, Wikimedia Commons
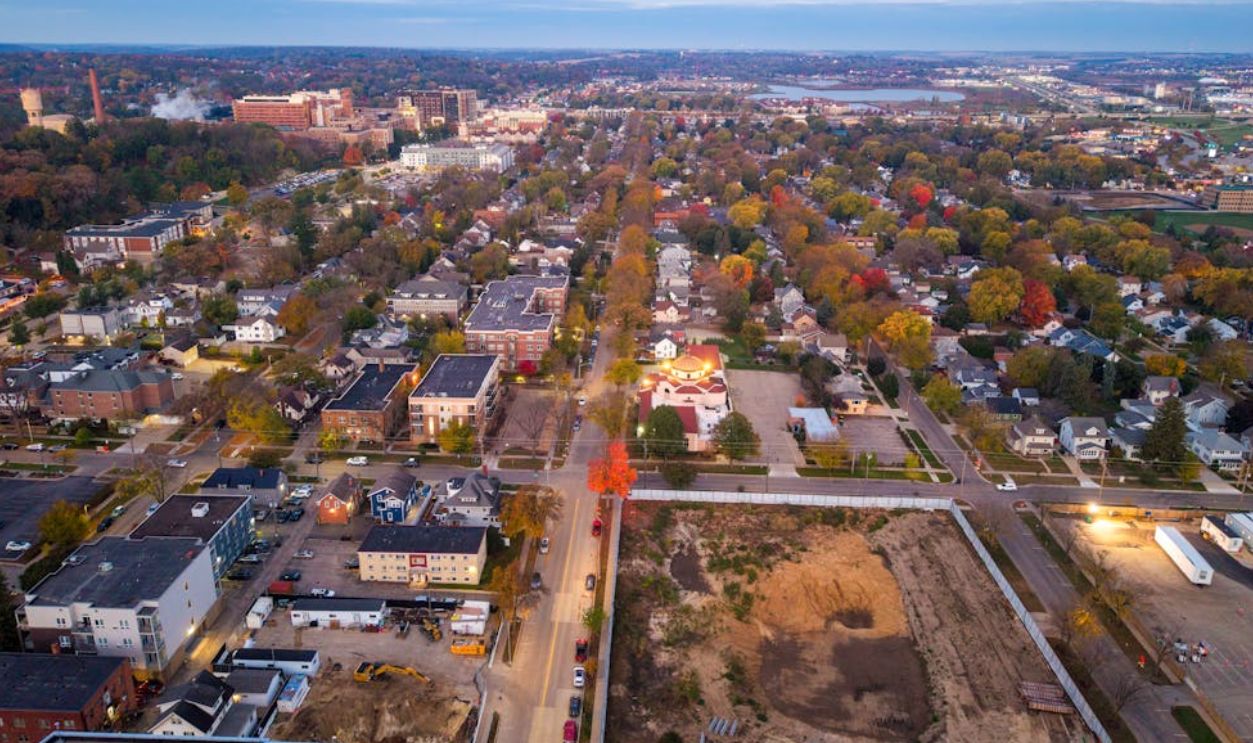
7: Minnesota (79.3 Years)
Male: 77.0 years
Female: 81.6 years
Minnesota is the upper Midwest’s big entry near the top, and it earns the spot. Strong health systems, higher education levels, active communities, and relatively good access to preventive care likely help—even if winter keeps trying to ruin everyone’s plans.
6: California (79.3 Years)
Male: 76.7 years
Female: 82.1 years
California has huge income and health divides, but the overall number remains one of the best in the country. Strong medical systems, higher-income coastal regions, active lifestyles, and a massive, diverse population all likely help keep the state near the top.
 Quintin Soloviev, Wikimedia Commons
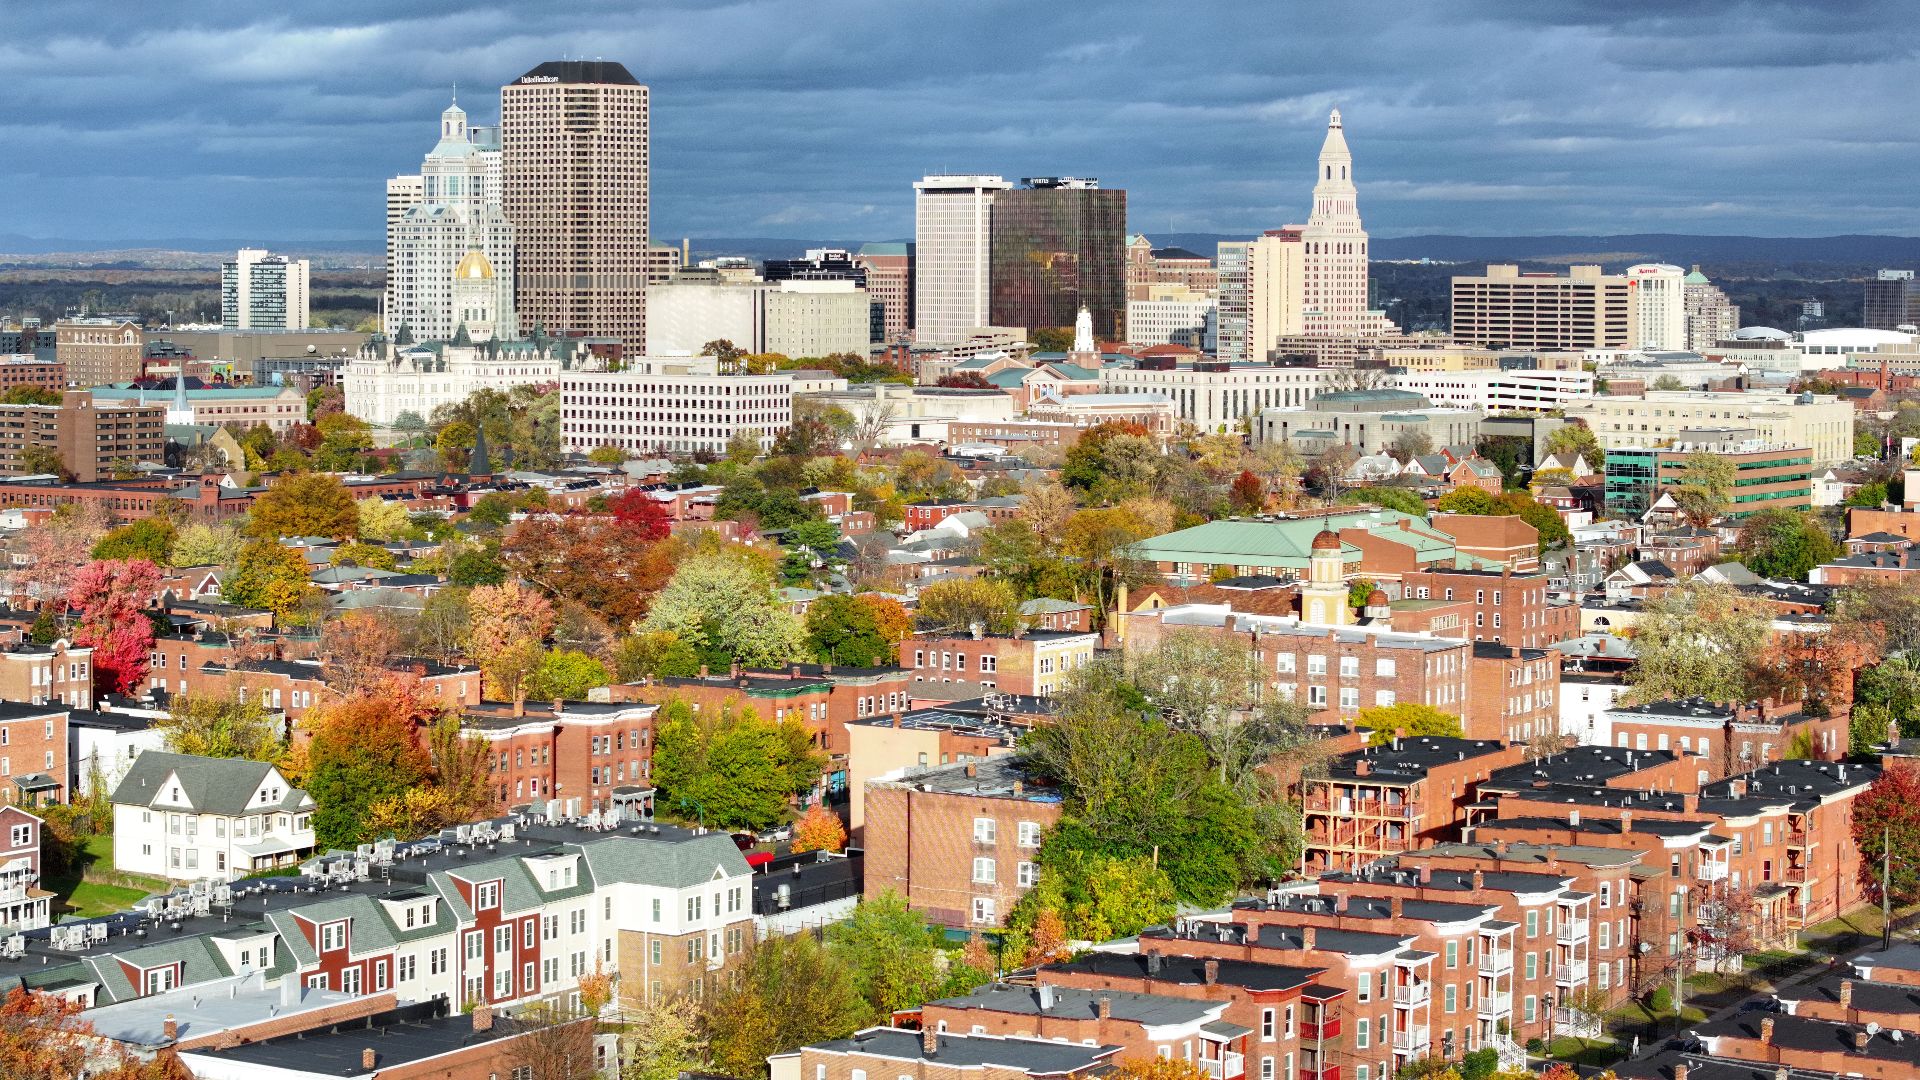
5: Connecticut (79.4 Years)
Male: 76.8 years
Female: 82.1 years
Connecticut breaks into the top five, which fits the broader Northeastern pattern. High incomes, education levels, access to major medical systems, and strong preventive care in many communities all likely help. Not bad for a place people mostly discuss through property taxes and train schedules.
 Quintin Soloviev, Wikimedia Commons
4: New York (79.5 Years)
Male: 76.9 years
Female: 82.1 years
New York ranking this high is impressive given how huge and varied the state is. Dense medical access, high-performing health systems, walkable urban living in some areas, and strong outcomes in many communities likely help, even with major inequality across regions.
 King of Hearts, Wikimedia Commons
3: New Jersey (79.6 Years)
Male: 77.1 years
Female: 82.0 years
New Jersey gets mocked constantly, but the life expectancy ranking gives it a serious comeback line. Higher incomes, strong access to medical care, dense communities, and proximity to major health systems in both New York and Philadelphia likely all help. Turnpike jokes can wait.
 Jakub Halun, Wikimedia Commons
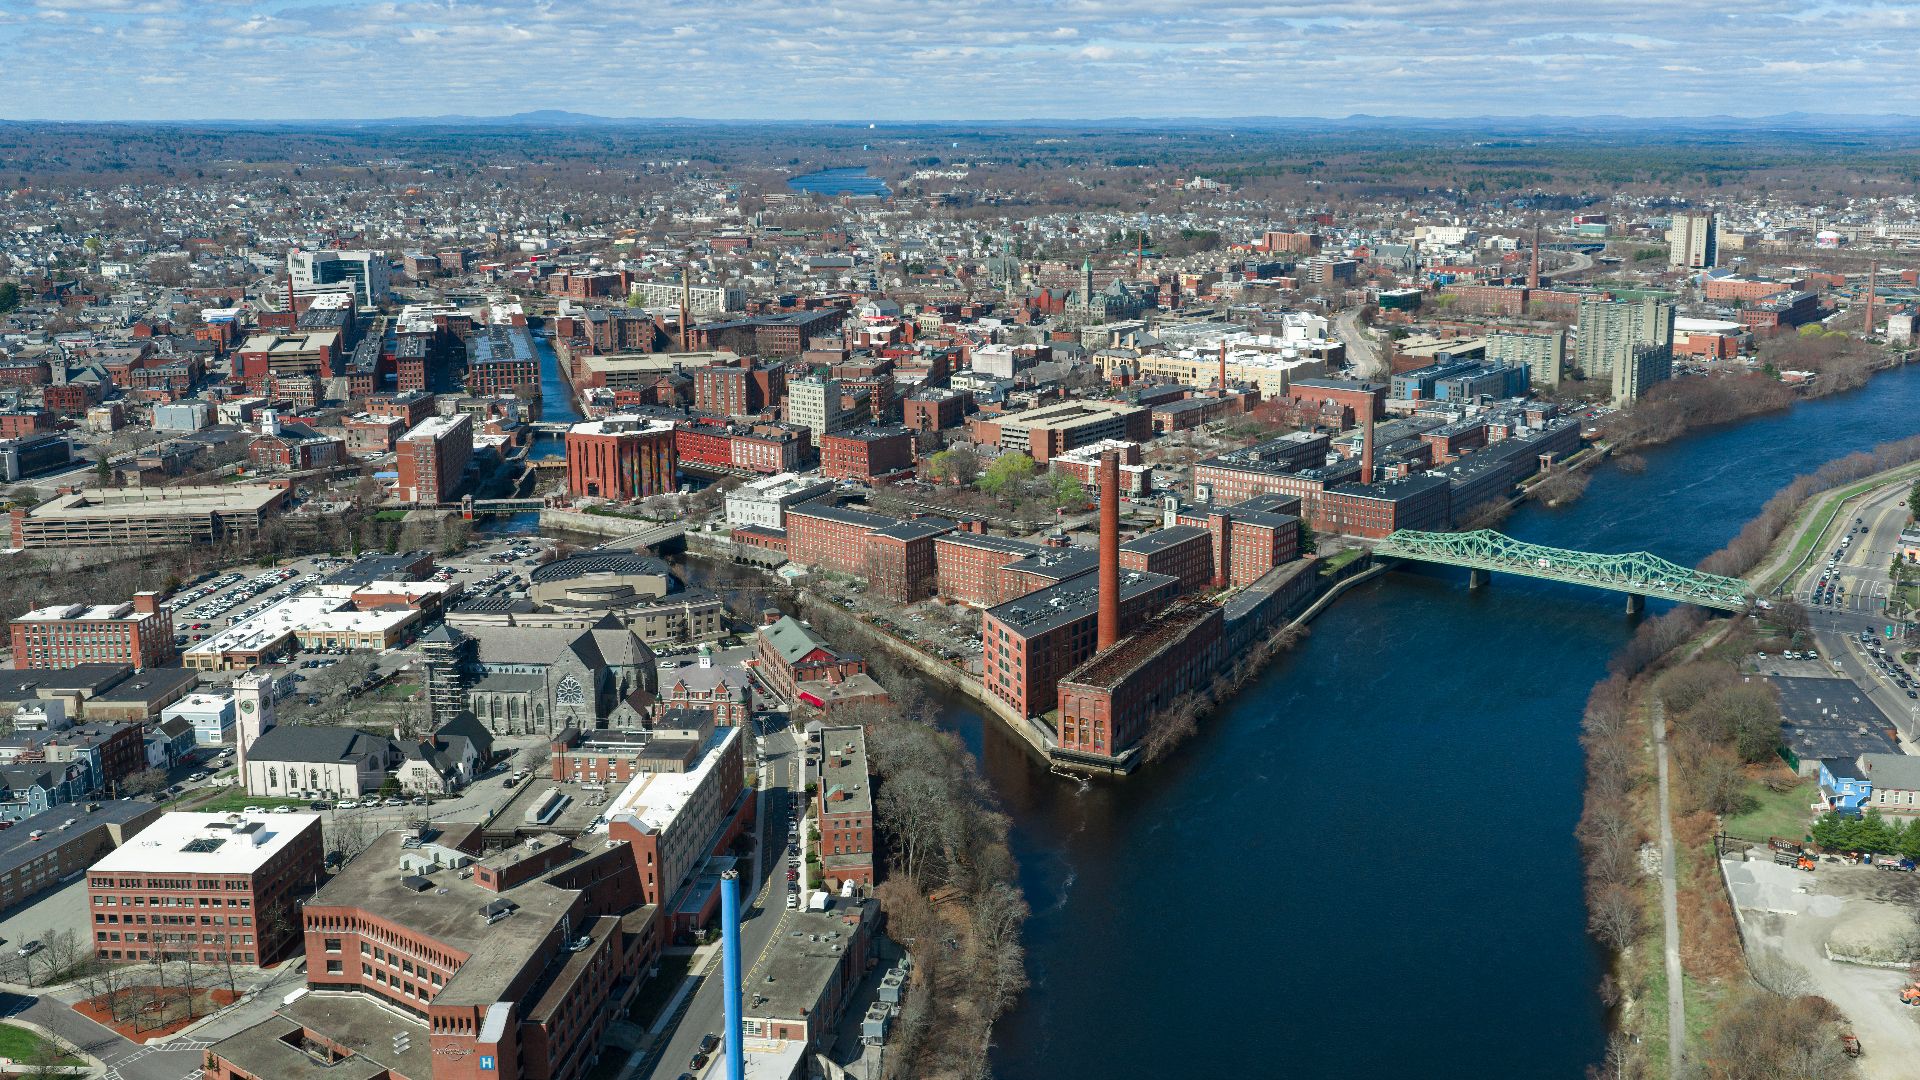
2: Massachusetts (79.8 Years)
Male: 77.4 years
Female: 82.2 years
Massachusetts comes within striking distance of the top spot, and it actually ranks first for male life expectancy in the CDC table. High education levels, strong insurance coverage, world-class medical systems, and a deep network of hospitals and specialists make this very Massachusetts: annoyingly good at the test.
 Quintin Soloviev, Wikimedia Commons
1: Hawaii (80.0 Years)
Male: 77.1 years
Female: 83.0 years
Hawaii takes the top spot, and honestly, it almost feels unfair. The state also ranks first for female life expectancy, with women reaching 83.0 years. Lifestyle, climate, community ties, diet patterns, and strong outcomes among older residents likely all help. That is not a ranking—it is a flex.

The Gap Is The Real Story
The biggest takeaway is not just who ranks first or last. It is the size of the spread: 7.8 years between the highest and lowest states. That is enormous. As a snapshot of population health, it says a lot.

You Might Also Like:
Every State Has A Sandwich Personality—These Are The Best Ones
The Most Peaceful Countries In The World—Ranked According To Data
Ranking The Top 50 Universities In America In 2026 From Worst To Best—According To Data