


Everybody Has An Opinion
Ask Americans where the country's best drivers live and you'll get wildly different answers. Surveys measuring courtesy, insurance claims, crashes, speeding and fatalities rarely crown the same state as the victor. That's actually encouraging news: depending on the metric, plenty of states have something worth celebrating about how their residents drive.
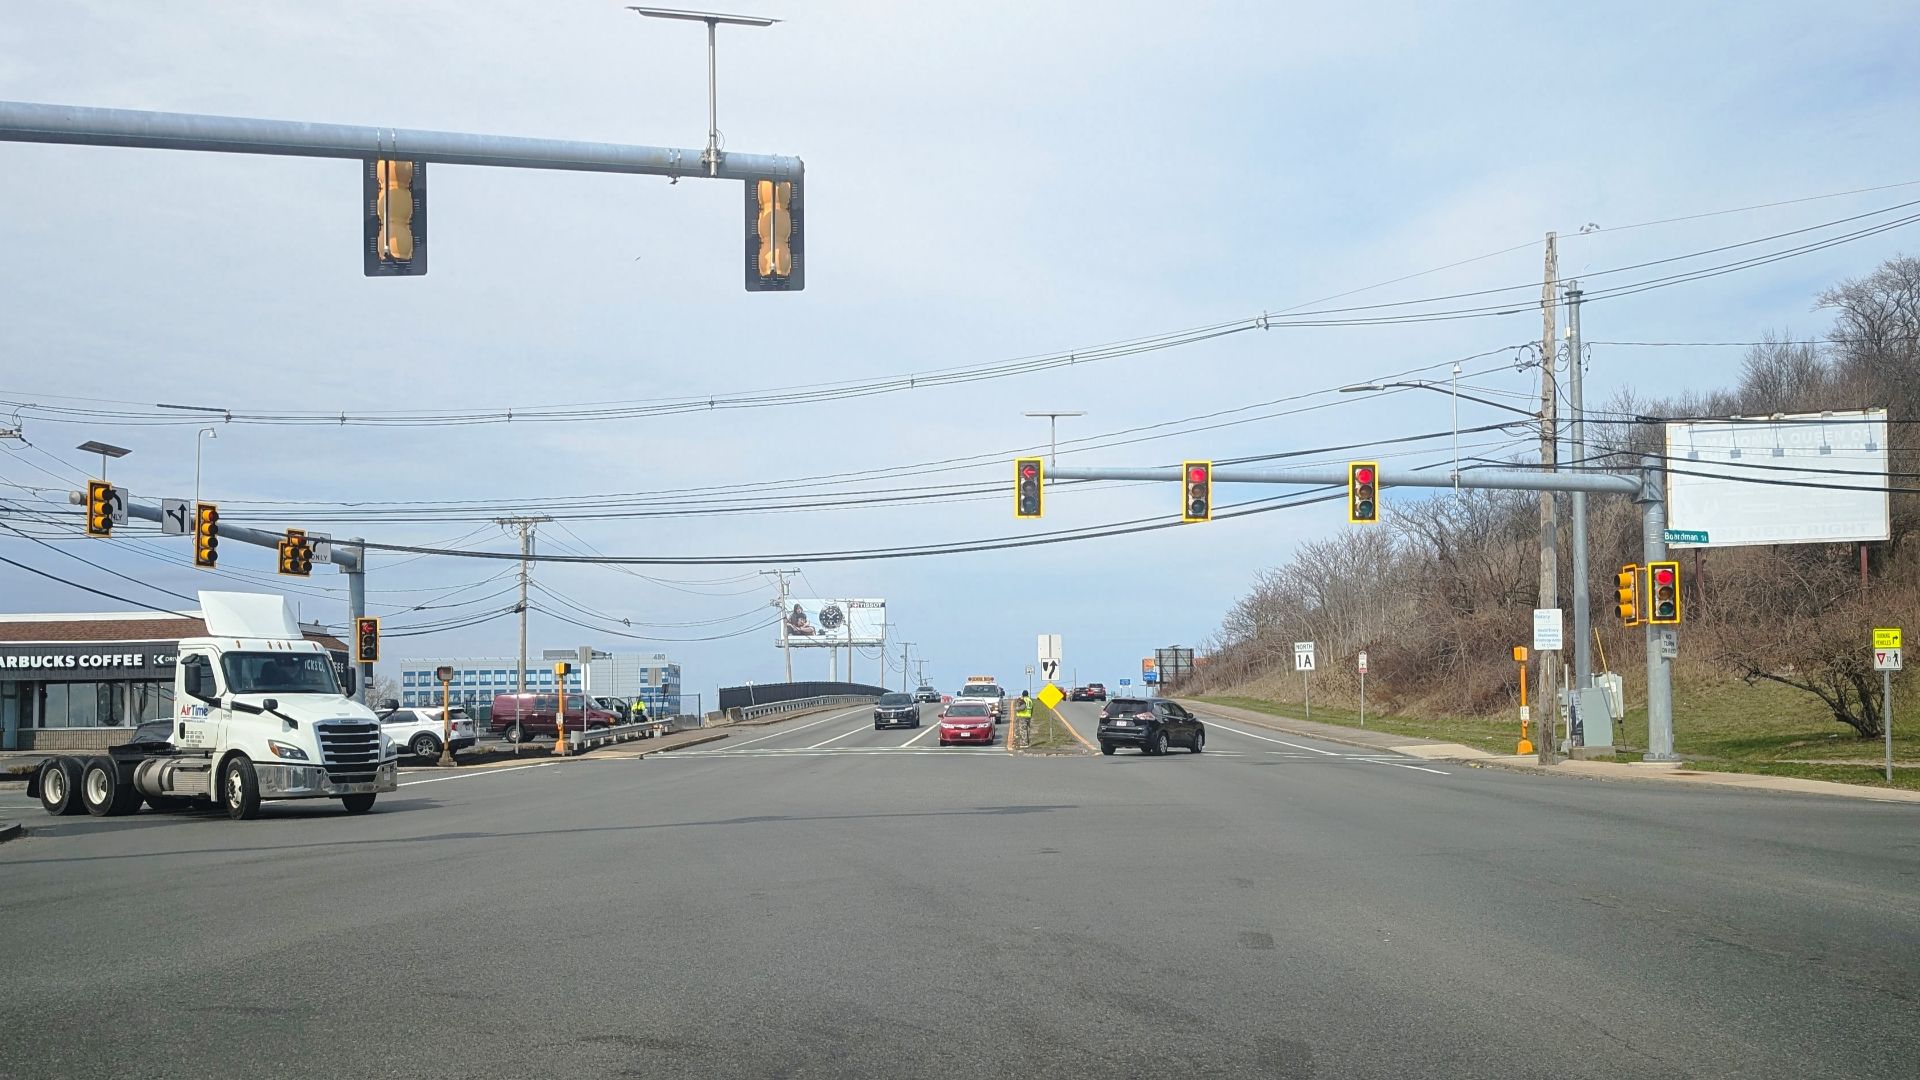
Massachusetts
Massachusetts makes a surprisingly strong case when you focus on serious crashes. IIHS recorded just 4.9 motor-vehicle deaths per 100,000 residents in 2024, the lowest rate among the states. Considering the traffic around Boston, that's an impressive result and a reminder that congestion doesn't necessarily equal dangerous driving.
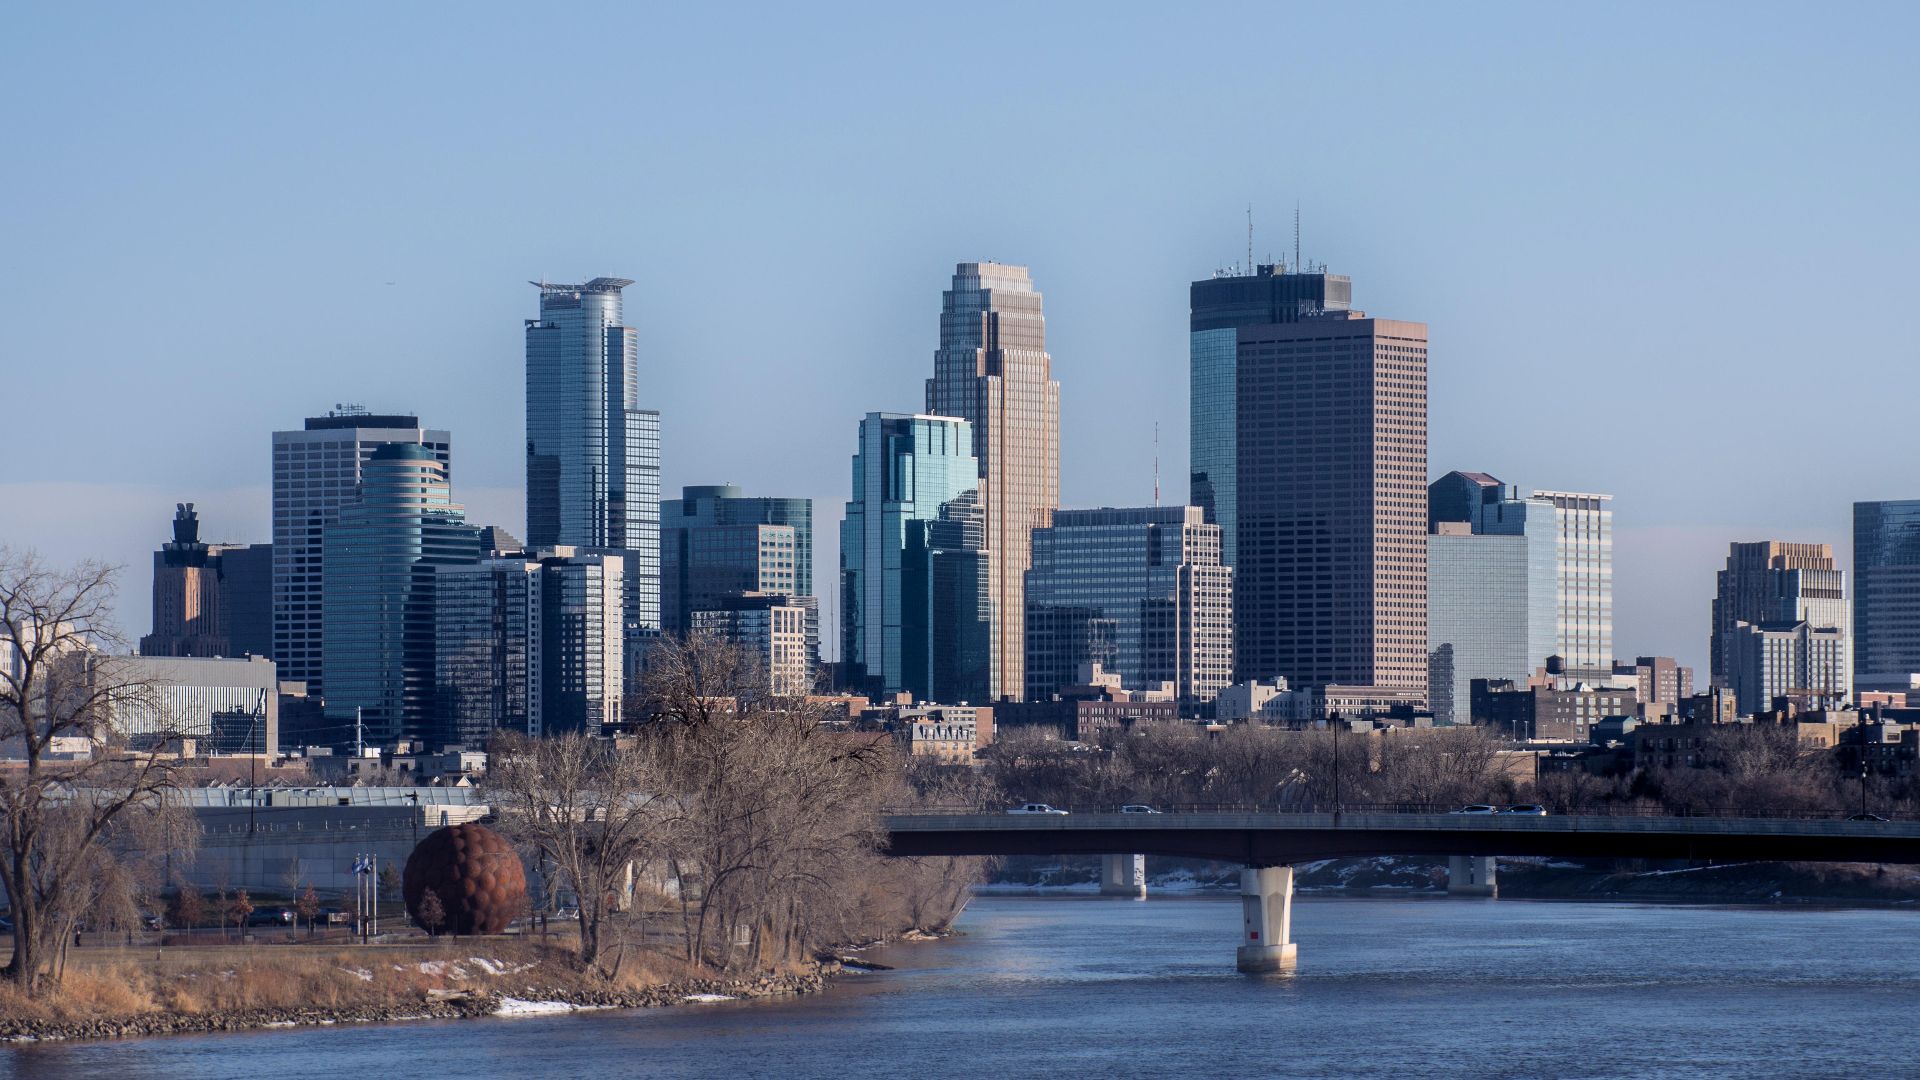
Minnesota
Minnesota routinely performs well in road-safety comparisons. IIHS recorded 7.1 motor-vehicle deaths per 100,000 residents in 2024, among America's lowest rates. That's particularly noteworthy in a state where drivers routinely contend with snow, ice and bitter winter temperatures that can turn an ordinary commute into a genuine challenge.
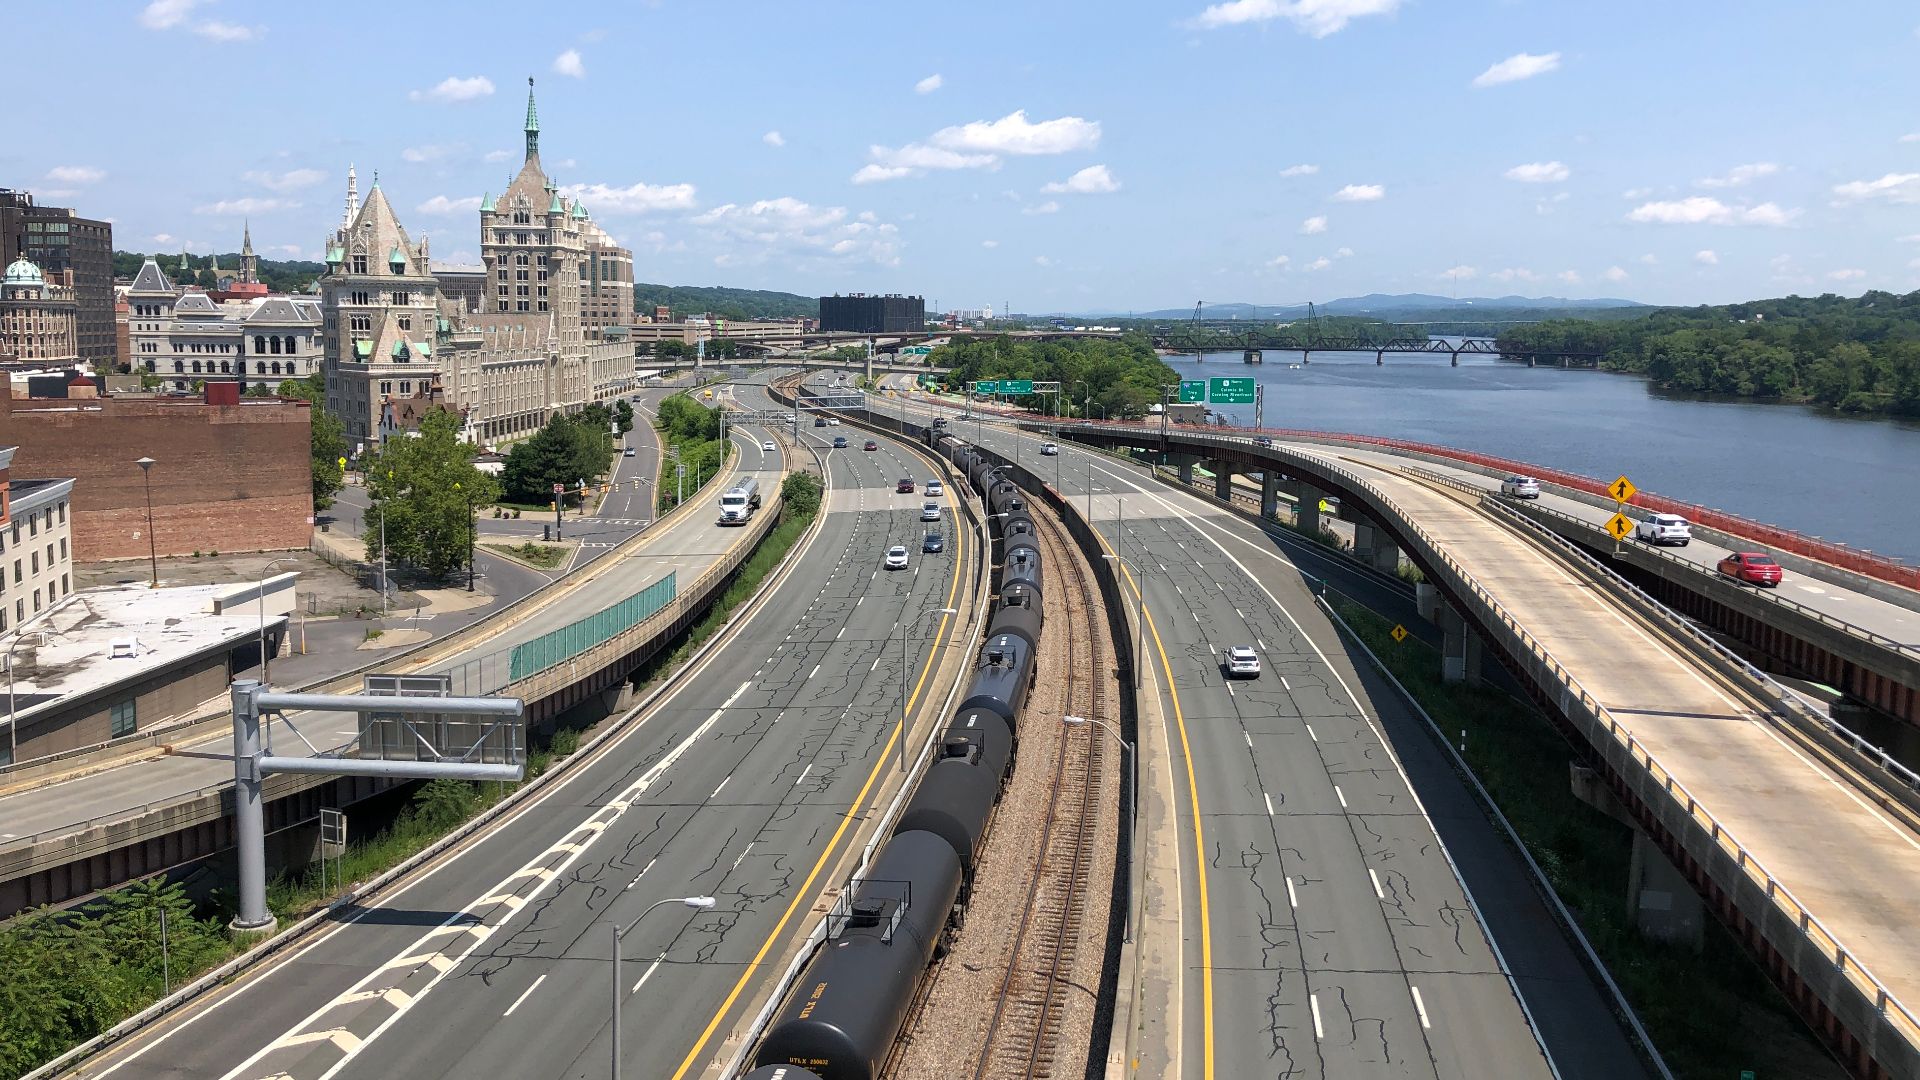
Rhode Island
Tiny Rhode Island deserves some recognition. Its 2024 motor-vehicle death rate was 6.3 per 100,000 residents, according to IIHS, putting it among America's safest states by that measure. Rhode Islanders may complain about one another's driving, but the most consequential statistic paints an encouraging statewide picture.
 Kenneth C. Zirkel, Wikimedia Commons
New Jersey
Yes, New Jersey. The state that routinely becomes a punchline in arguments about aggressive driving also recorded just 6.2 motor-vehicle deaths per 100,000 residents in 2024. LendingTree additionally found only 0.2 speeding-related incidents per 1,000 analyzed drivers, the lowest rate in its 2025 study.

New York
New Yorkers might be surprised to find themselves here after Nationwide's 2026 survey named their state the country's worst for perceived driving. Yet IIHS calculated only 5.6 motor-vehicle deaths per 100,000 residents in 2024, America's second-lowest state rate. Reputation and measurable safety clearly aren't the same thing.
Hawaii
Hawaii's drivers scored extremely well in LendingTree's 2025 analysis, with only 22.6 incidents per 1,000 drivers, the lowest figure in the country. Its drivers also had the second-lowest accident rate in the study. Maybe island time really does encourage motorists to approach the road a little differently.

Florida
Florida may inspire plenty of driving jokes, but LendingTree's numbers tell a much friendlier story. Its 23.1 incidents per 1,000 drivers were second-lowest nationally in the company's 2025 analysis. That's quite a contrast with Nationwide's survey, where Americans ranked Florida among the states with the worst drivers.
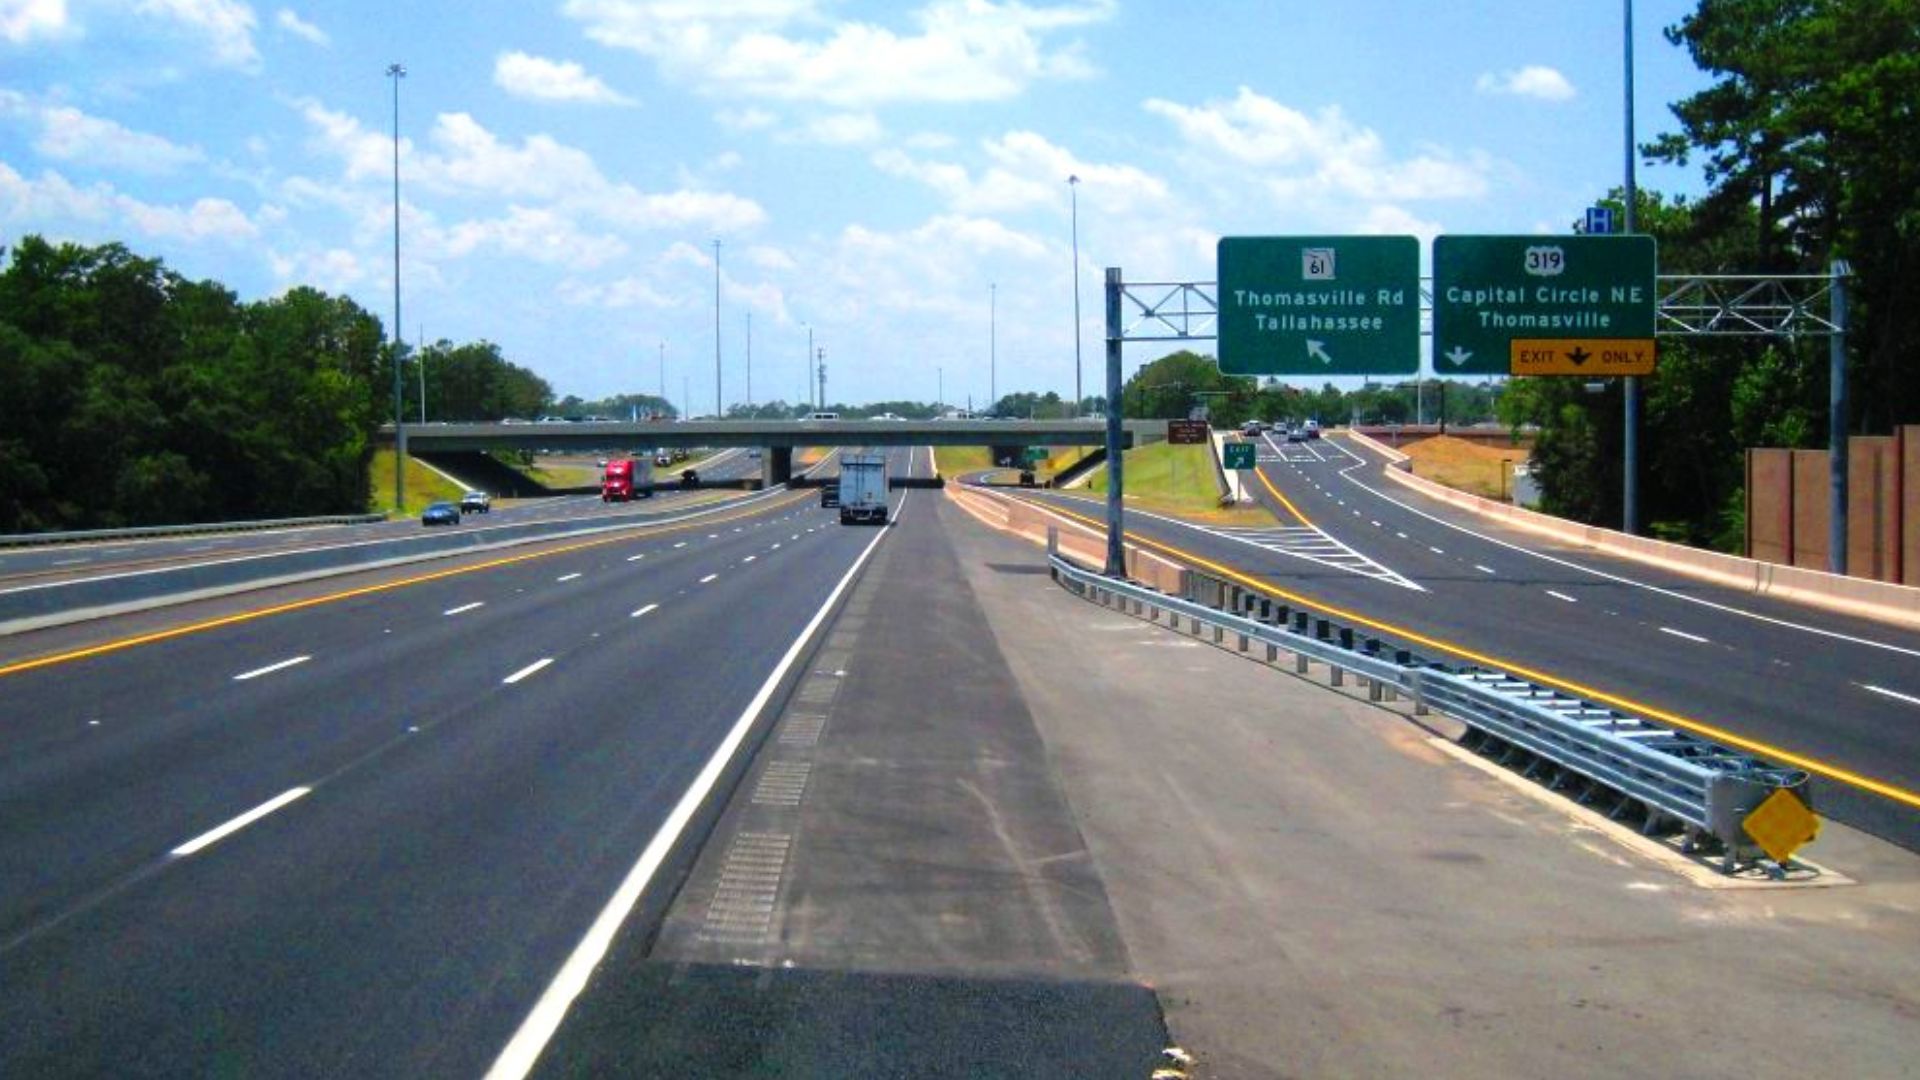 Urbantallahassee, Wikimedia Commons
Michigan
Michigan performed remarkably well in LendingTree's 2025 rankings, recording 23.3 incidents per 1,000 drivers, third-lowest nationally. That's especially appropriate for the state that put America on wheels. Michigan motorists also deal with snow, ice, construction and famously battered pavement, making the result more impressive.
 Michael Barera, Wikimedia Commons
Connecticut
Connecticut had one of America's lowest traffic fatality rates in 2024, with IIHS reporting 7.4 motor-vehicle deaths per 100,000 residents. Its densely traveled highways certainly don't always feel serene, but the numbers offer Connecticut drivers something more meaningful to celebrate than merely having fewer traffic jams.
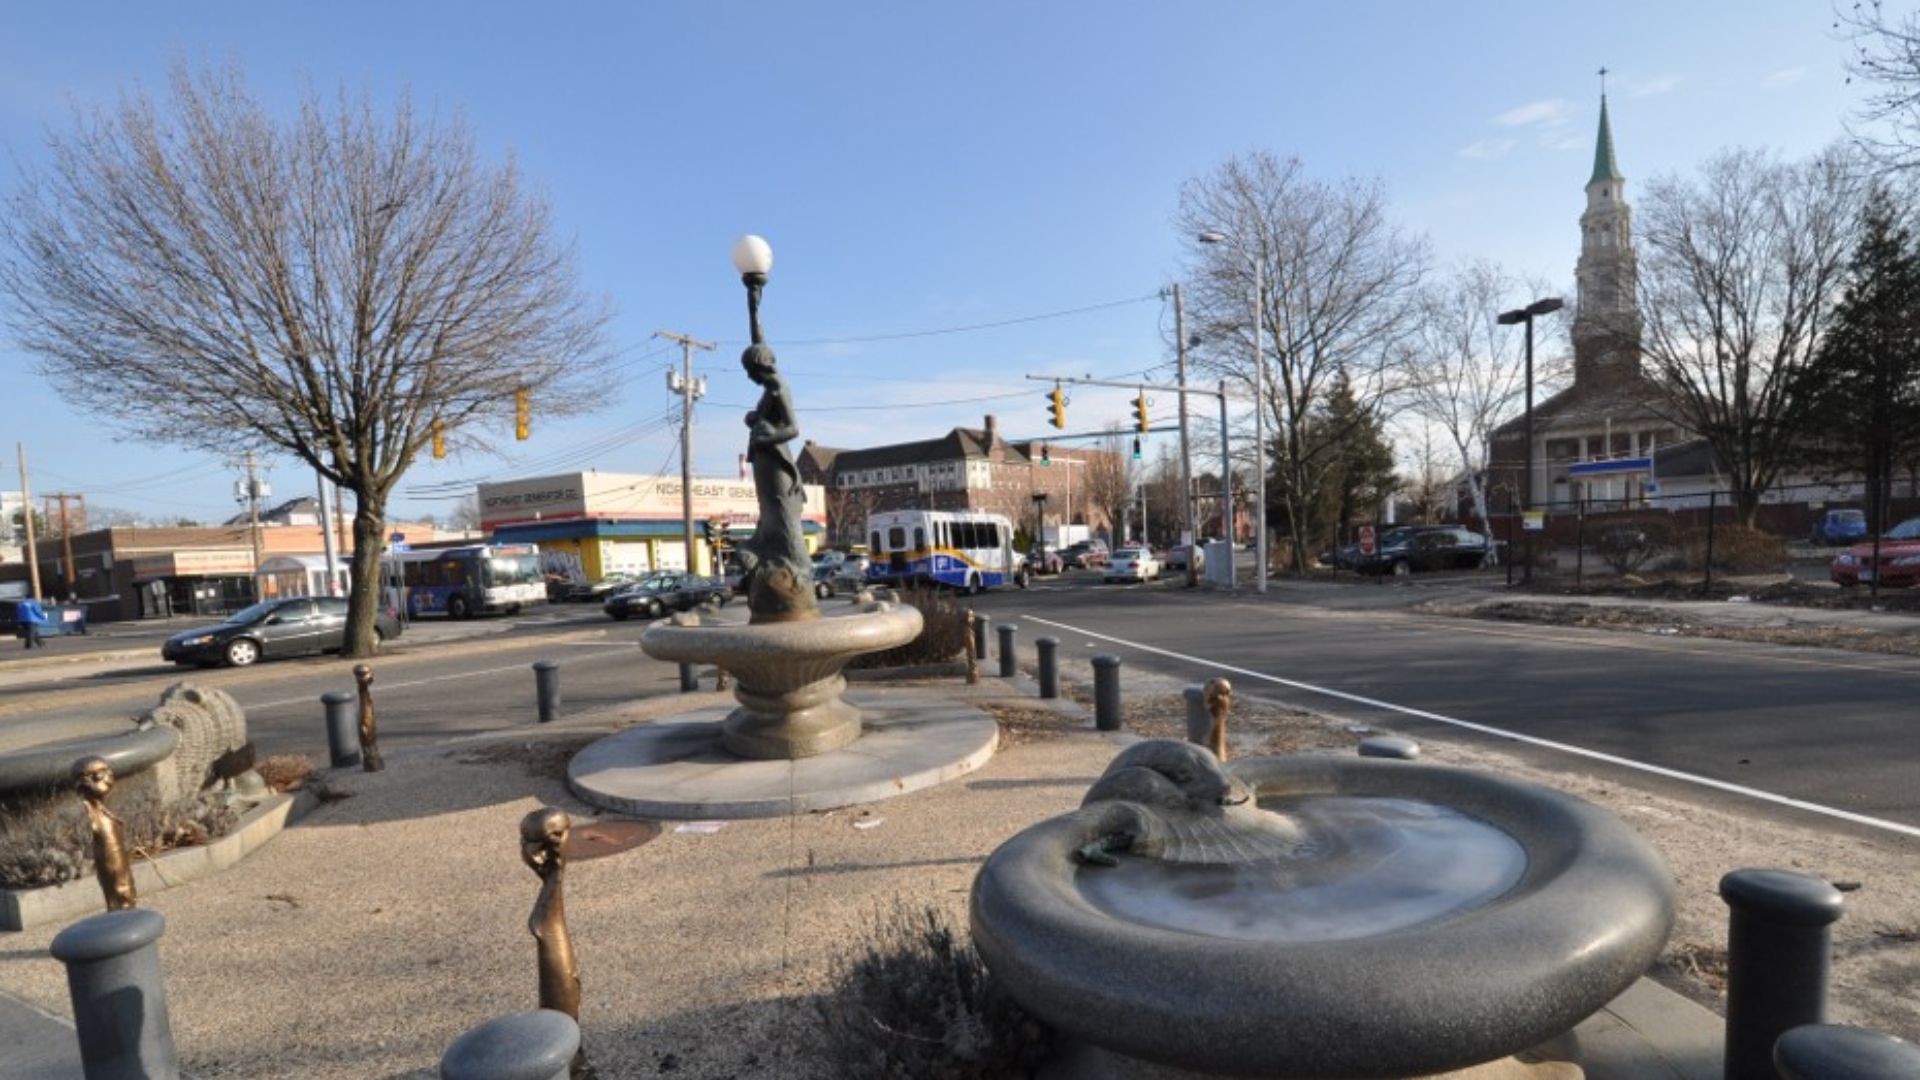 User:Magicpiano, Wikimedia Commons
Washington
Washington ranked among the better-performing states in LendingTree's 2025 analysis, with 28.3 incidents per 1,000 drivers. The state also recorded relatively few speeding-related incidents. From Seattle congestion to mountain passes and rainy highways, Washington drivers encounter an unusually broad assortment of conditions while generally keeping things under control.

Pennsylvania
Pennsylvania's 2024 motor-vehicle death rate stood at 8.7 per 100,000 residents, according to IIHS, comfortably below the national rate. That's encouraging for a state combining dense northeastern cities, busy interstate corridors, winding rural highways and winter weather. Pennsylvania motorists have to be adaptable, and many apparently are.
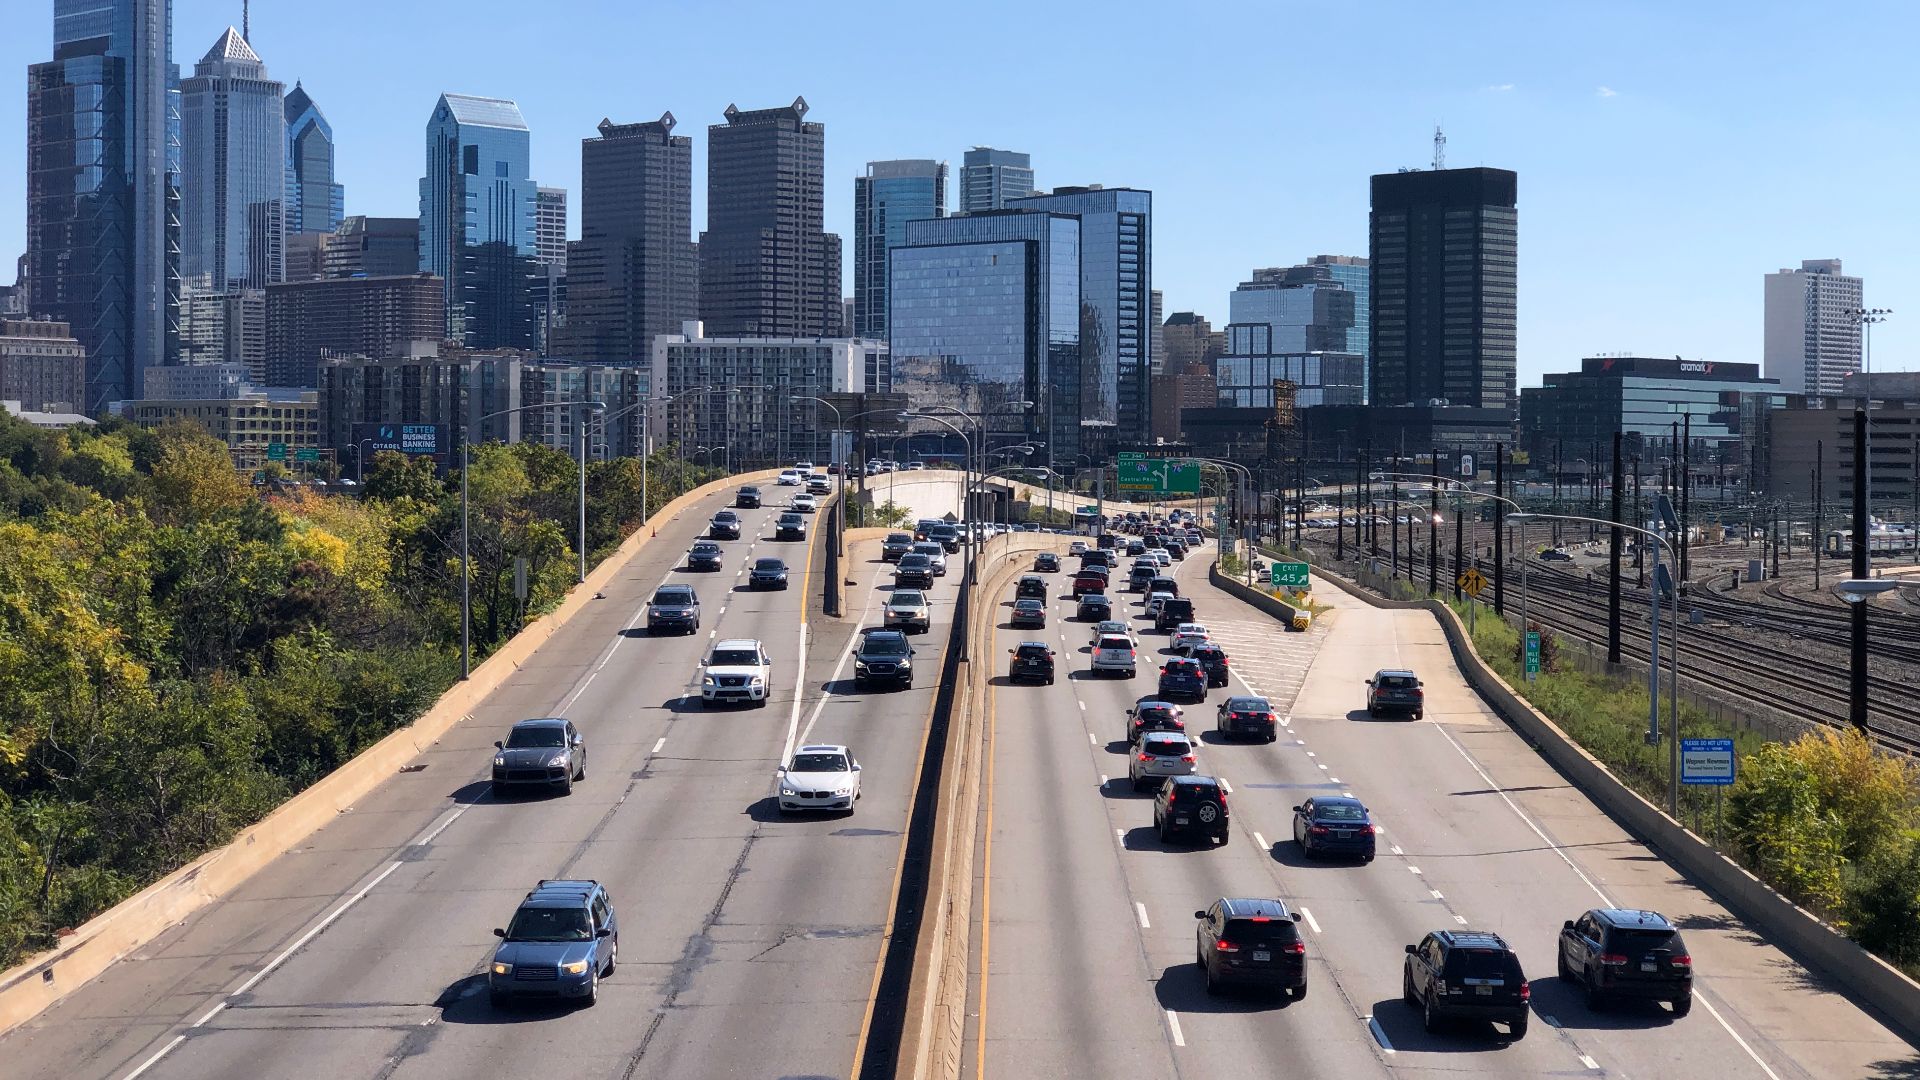
Maryland
Maryland also performs well when road safety is measured by population. IIHS recorded 9.1 motor-vehicle deaths per 100,000 residents during 2024, below the national figure. That's notable given the state's combination of Baltimore-Washington traffic, heavily traveled interstates, suburban congestion and quieter rural roads farther west and east.
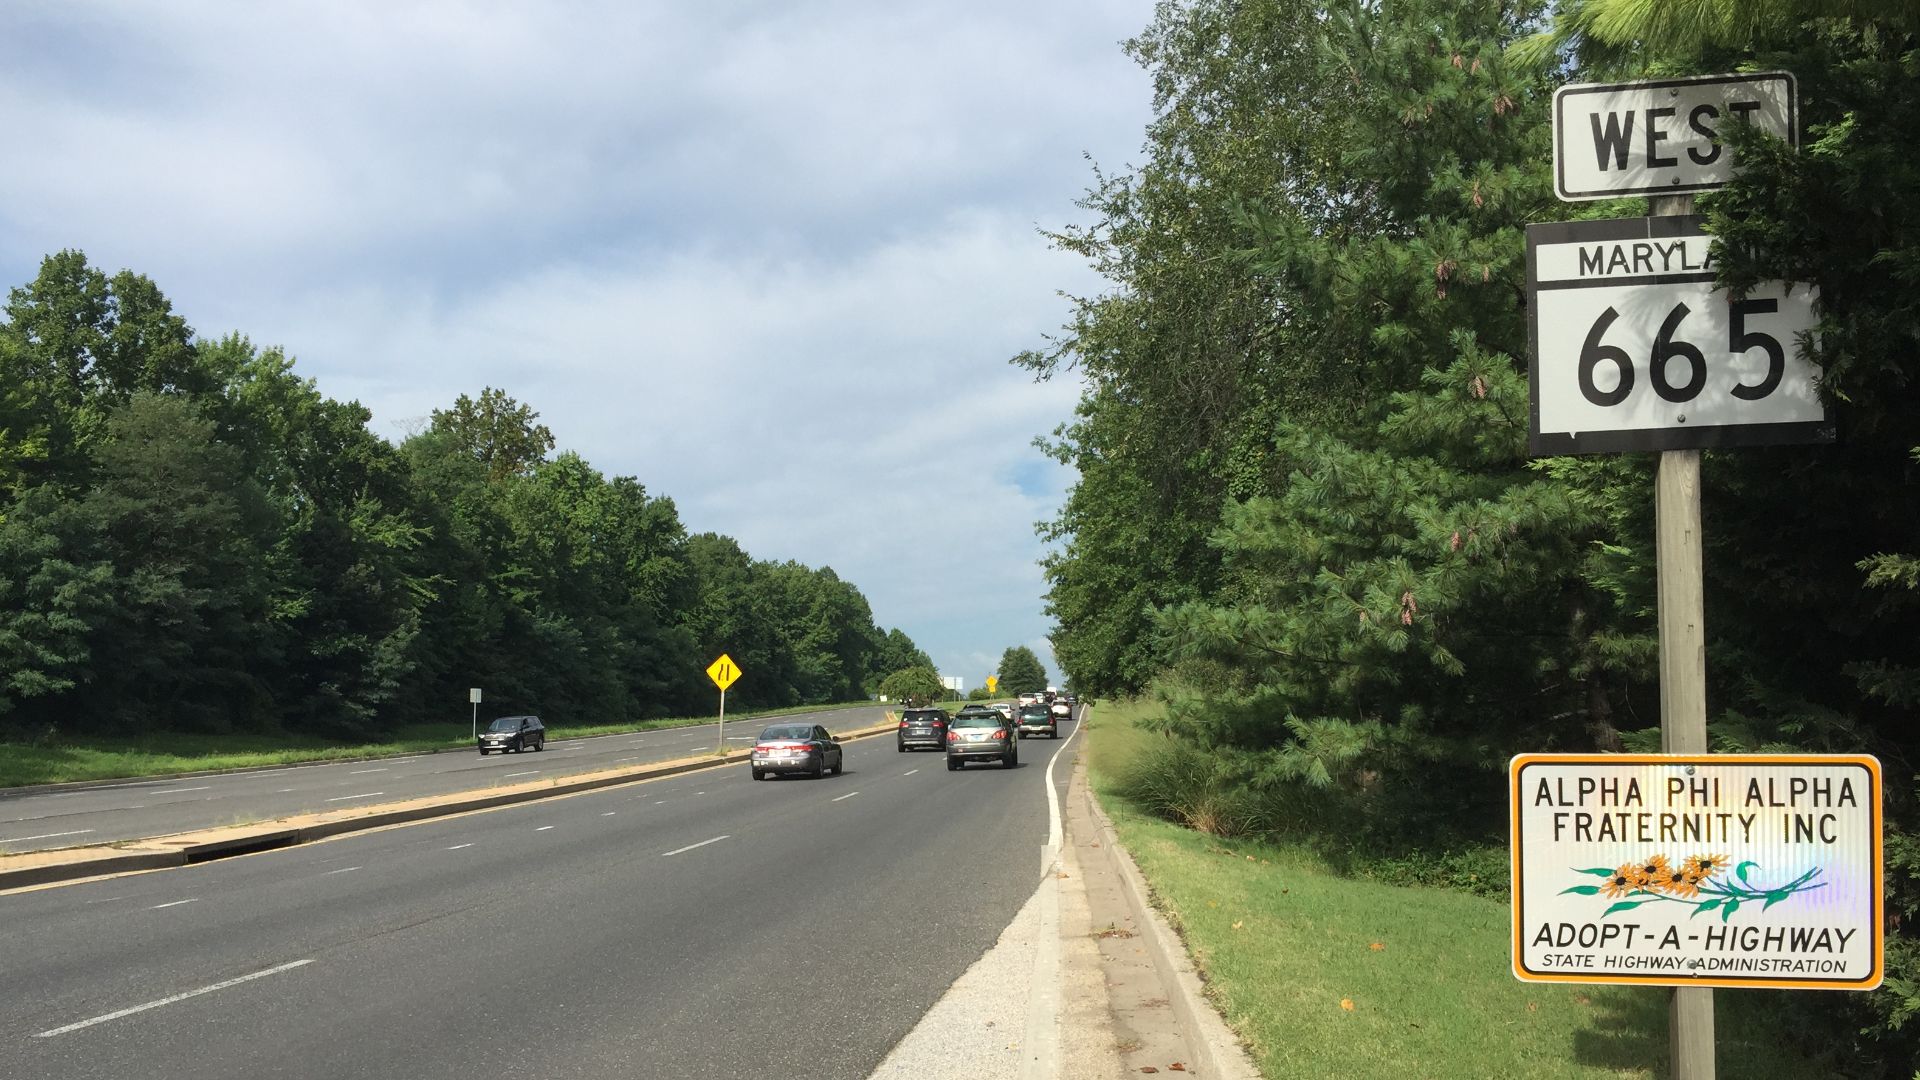
Virginia
Virginia's drivers can point to an encouraging statewide safety record. IIHS calculated 9.5 motor-vehicle deaths per 100,000 residents in 2024, below the national rate. Navigating Northern Virginia congestion may occasionally test everyone's patience, but statewide fatality statistics provide a considerably more positive picture of driving behavior.
 Quidster4040, Wikimedia Commons
Wisconsin
Wisconsin's 2024 motor-vehicle death rate was 9.9 per 100,000 residents, according to IIHS, placing it below the national average. That's no small achievement considering the state's long winters, icy roads and substantial rural mileage. Driving safely through a Wisconsin January requires skills that motorists elsewhere rarely need.

Illinois
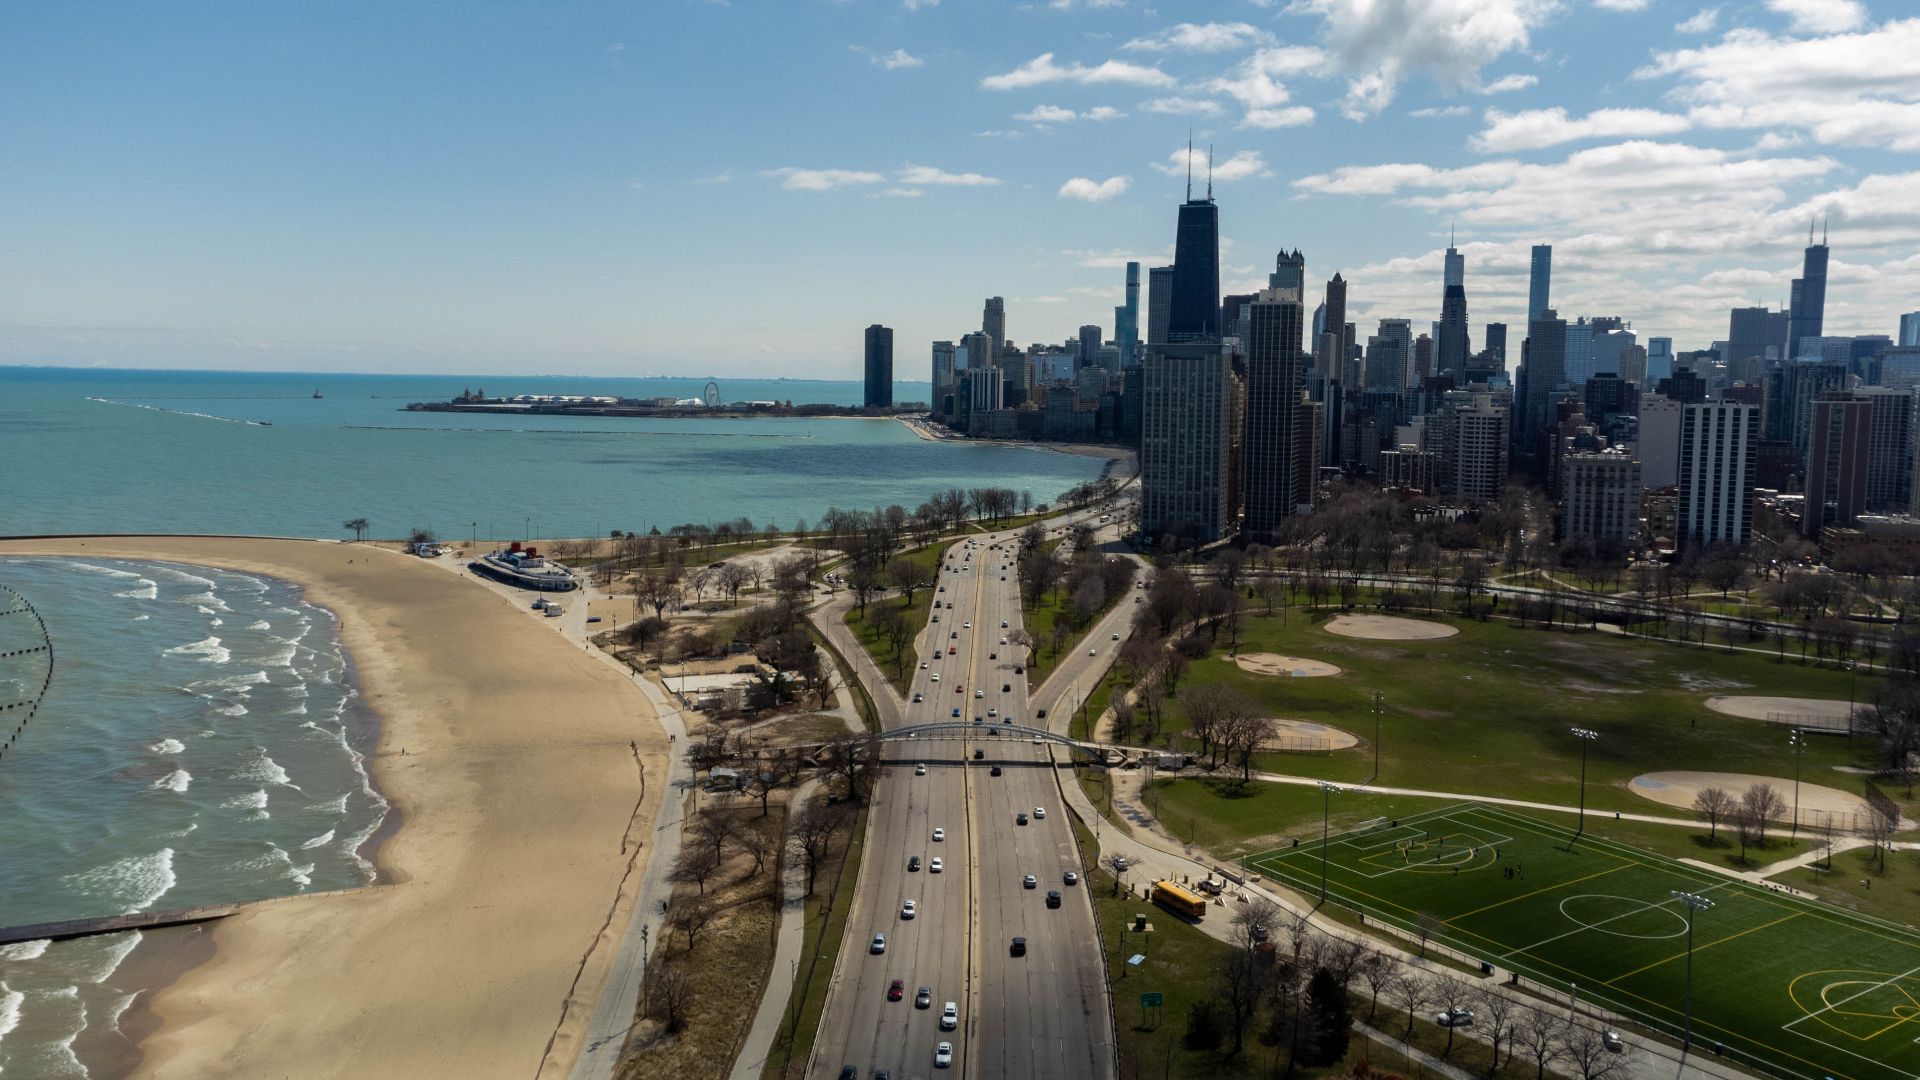
Illinois recorded 1,173 motor-vehicle deaths in 2024, but population changes the perspective considerably. IIHS calculated a rate of 9.2 deaths per 100,000 residents, below the national figure. Between Chicago traffic and long stretches of interstate, Illinois drivers encounter almost every kind of American driving environment.
Vermont
Vermont's small population means annual totals can fluctuate considerably, but its 2024 motor-vehicle death rate remained below the national figure at 9.7 per 100,000 residents. Mountain roads, winter snow and rural travel create genuine challenges, so Vermont drivers certainly aren't earning their results under easy conditions.
 John Phelan, Wikimedia Commons
California
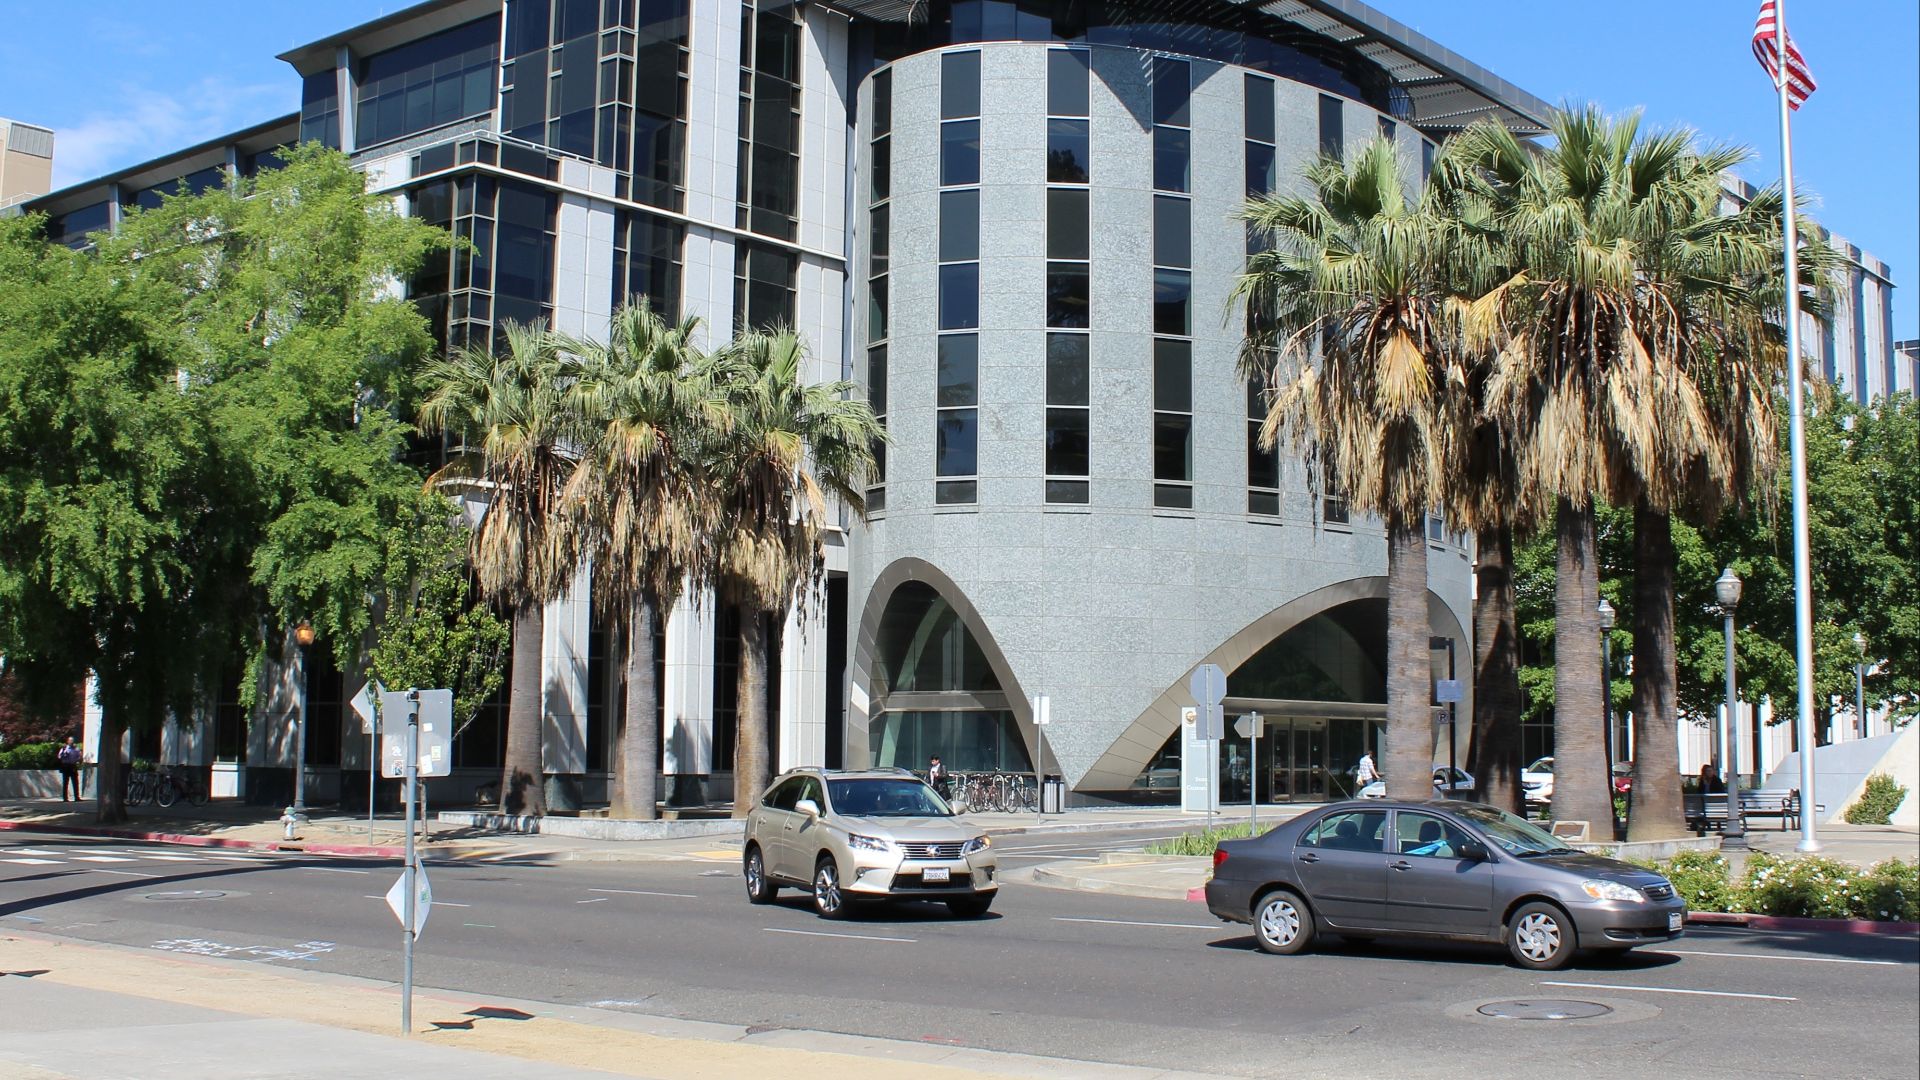
California's reputation for crowded freeways can overshadow a more encouraging statistic. IIHS recorded 3,807 motor-vehicle deaths in 2024, but because of the state's enormous population, that represented 9.7 deaths per 100,000 residents. California also saw fatalities fall 8% from 2023, according to NHTSA estimates.
 Sarbjit Bahga, Wikimedia Commons
Tennessee
Here's where things get interesting. The Zebra's survey-based analysis rated Tennessee drivers the best behaved among the states it examined, even though other statistical rankings have been less complimentary. Rather than proving one side wrong, the disagreement demonstrates how dramatically "best drivers" changes depending on what researchers choose to measure.
 Quintin Soloviev, Wikimedia Commons
Kentucky
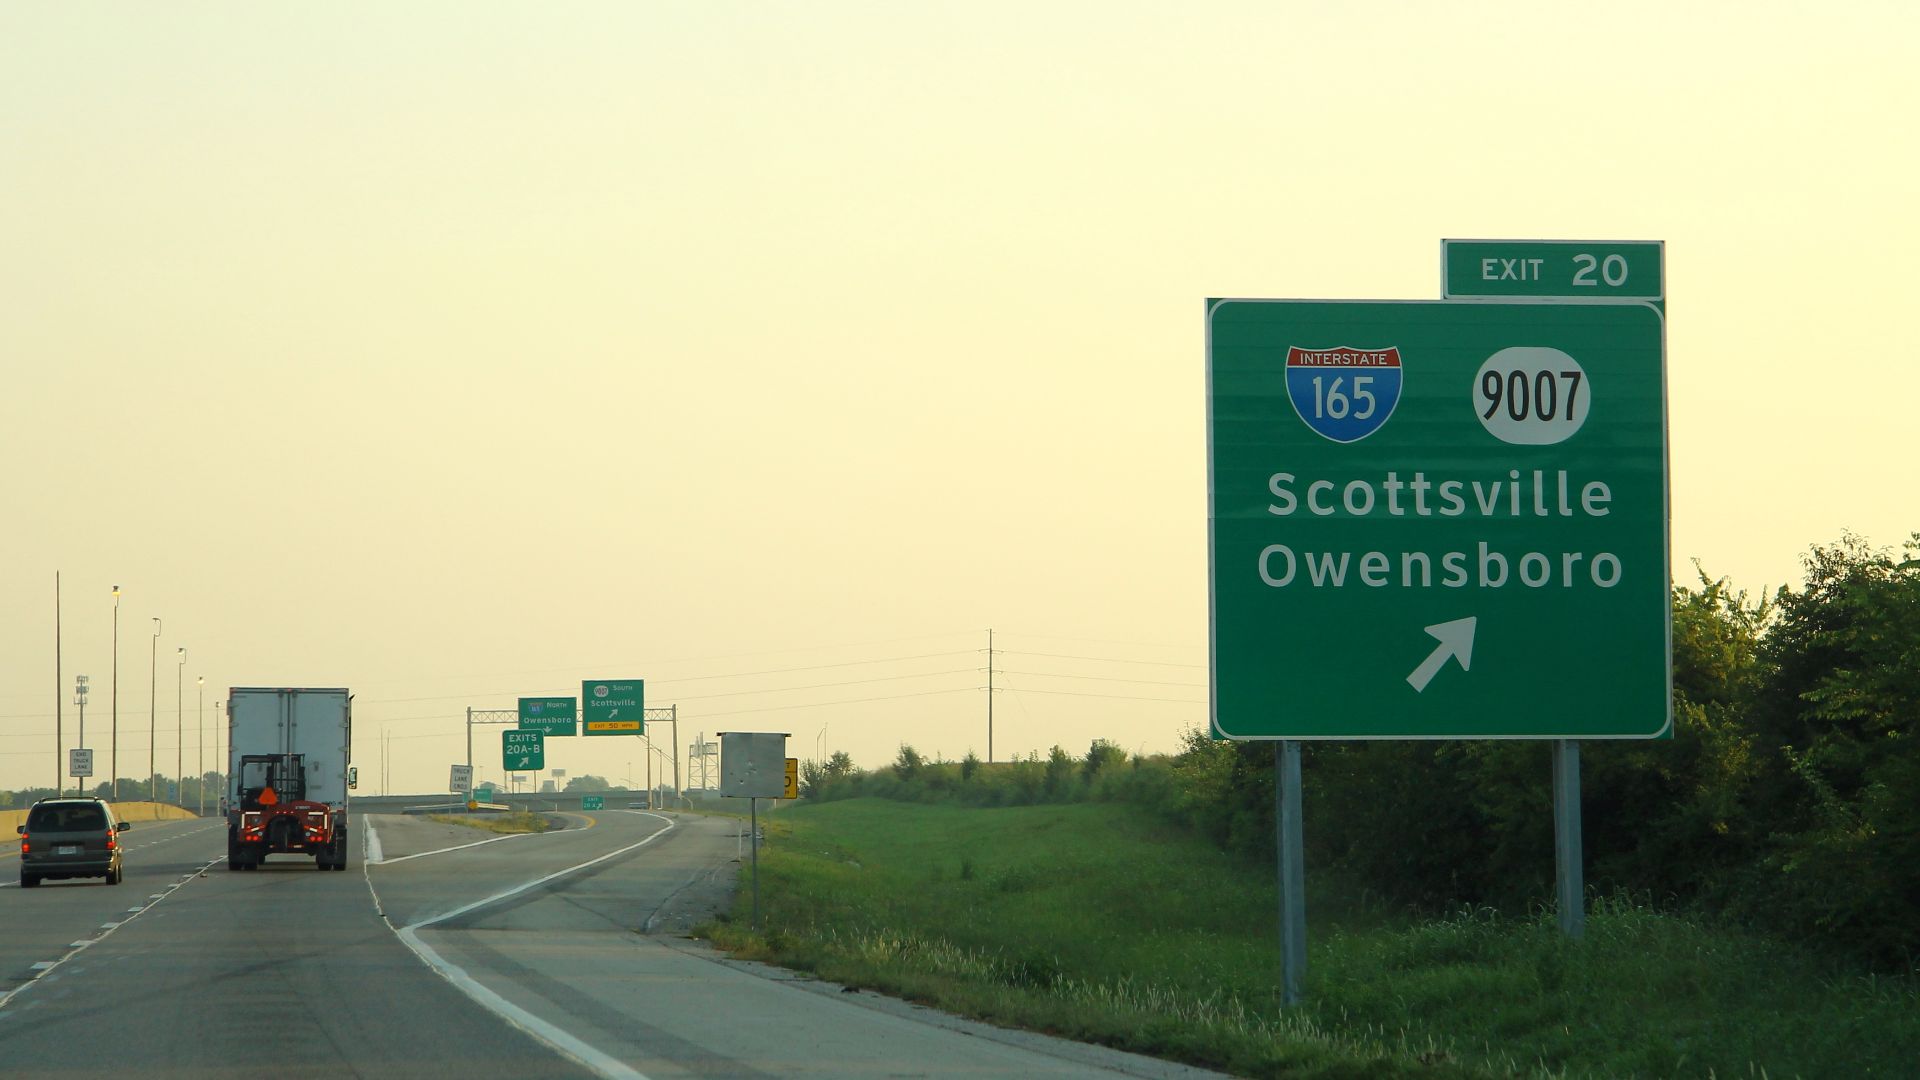
Kentucky earned first place in CarInsurance.com's 2025 ranking of America's best states for driving. That analysis considered several measures rather than relying on one statistic, producing a result many Americans probably wouldn't predict. It's another reason the familiar Northeast-versus-South-versus-West driving arguments rarely survive closer examination.
 formulanone, Wikimedia Commons
West Virginia
West Virginia finished second in CarInsurance.com's 2025 best-states-for-driving ranking. Anyone who has driven its twisting mountain highways knows motorists there don't exactly get easy practice. Whatever your preferred measurement, successfully navigating steep grades, sharp curves, winter weather and rural roads requires plenty of attention behind the wheel.
 Josh Stapler from Charleston, United States, Wikimedia Commons
The Map Keeps Changing
So where are America's best drivers? Massachusetts wins on 2024 population-based fatality rates, Hawaii tops LendingTree's overall incident measure, Tennessee shines in The Zebra's behavior survey, and Kentucky leads CarInsurance.com's ranking. That's a much nicer argument to have: nearly every methodology gives another state something to brag about.

You May Also Like:
The Best Thing About Every State—According To Americans From The Other 49 States
Ranking The States That Treat Older Americans The Best—According To Baby Boomers
Ranking The States That Make People Feel The Most Welcome—According To Other Americans