

Let’s See Who’s Crushing Graduation—And Who’s Slipping
We crunched the latest graduation numbers to see which states are best at getting seniors to the finish line—and where too many stall out. The gaps are razor-thin at the top, and the stories behind the numbers are fascinating. Stick around for the twist: the states struggling most.

#10: New Hampshire — 92.4%
New Hampshire edges into the top tier thanks to small, well-coordinated districts and steady supports that keep seniors on track. Strong community involvement and clear graduation pathways help students finish on time without sacrificing rigor. The margin from #10 to the top is slim—just a couple of percentage points separate these leaders.
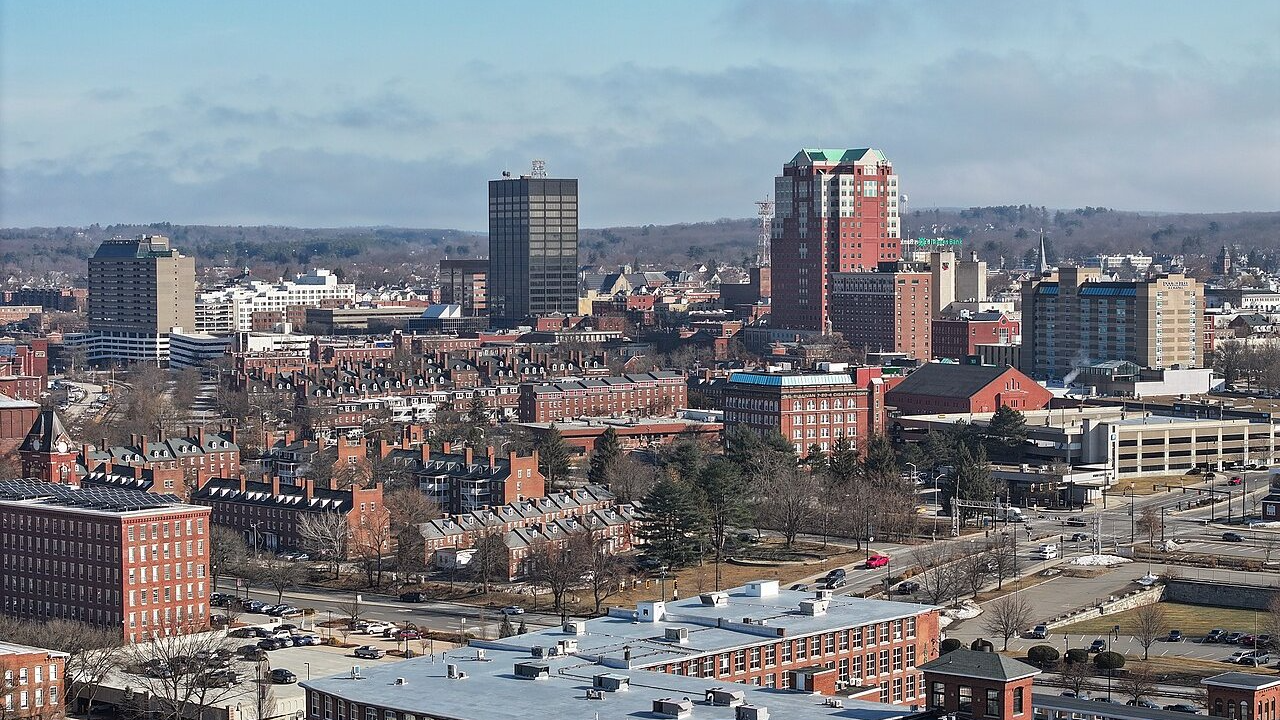 Quintin Soloviev, CC BY 4.0, Wikimedia Commons
#9: Iowa — 92.5%
Iowa’s consistency is its superpower. Many districts operate at or above the statewide average, so there aren’t big drop-off pockets pulling the number down. Clear counseling, credit-recovery options, and career/tech programs keep students engaged from freshman year to the finish line—nudging the rate into the low-90s.
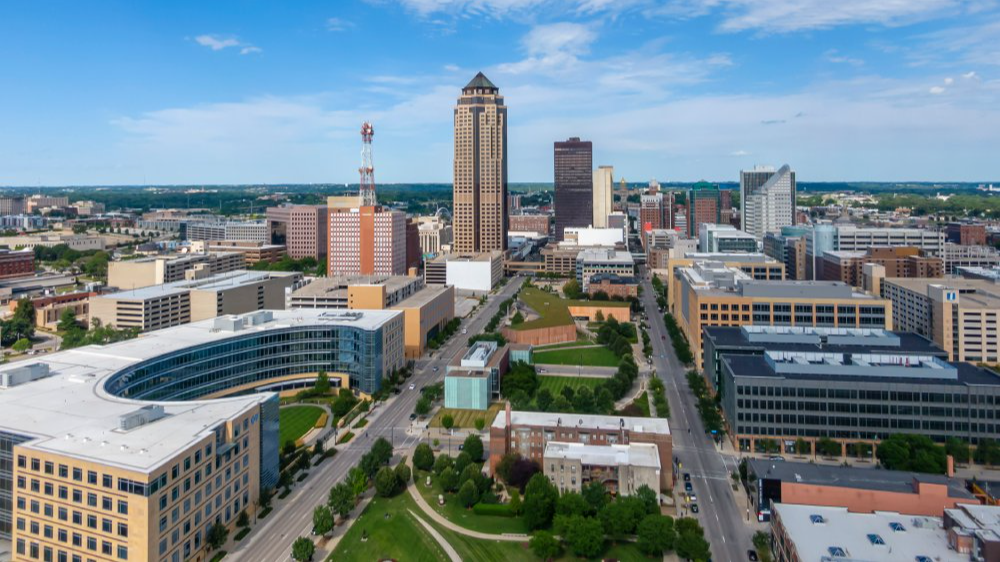 Grindstone Media Grp, Adobe Stock
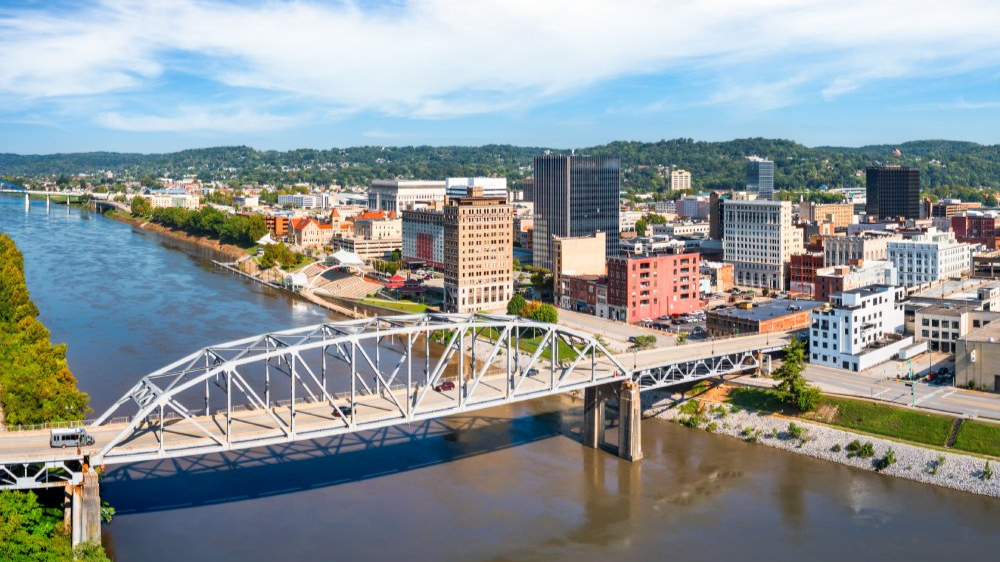
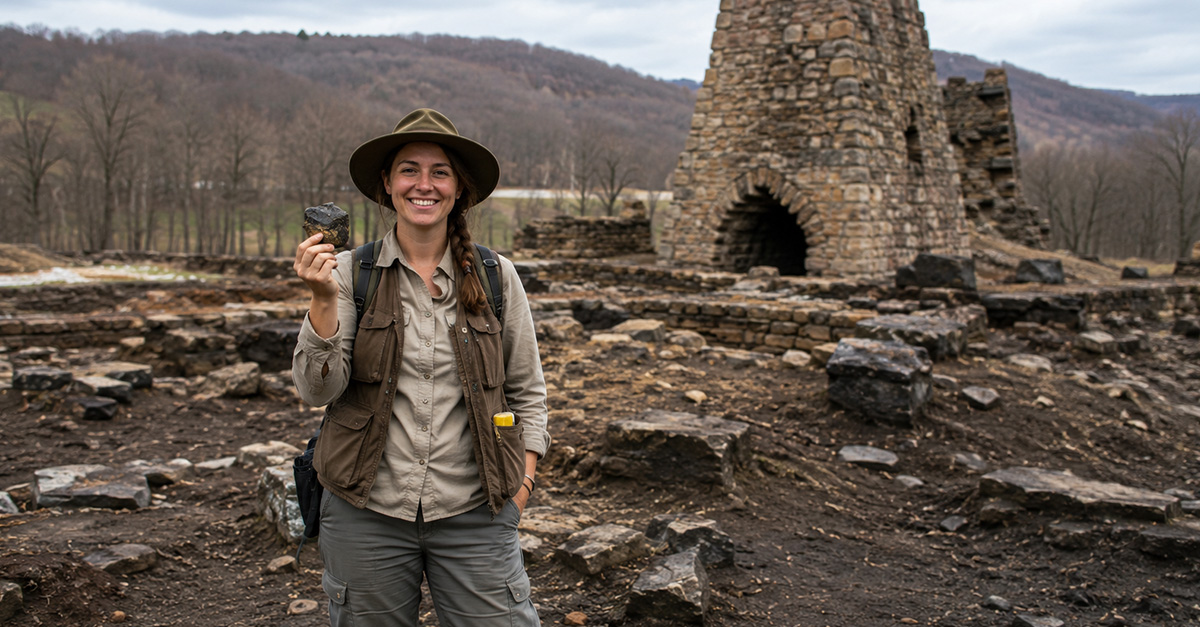
#8: West Virginia — 92.6%
West Virginia has steadily tightened systems that catch near-completers before they slip. Smaller scale helps personalize senior-year supports, and focused attention on attendance and credit completion has paid off. The state remains one of the most reliable finishers in the country, just a hair behind the tied 93% group.
#7: Virginia — 92.9%
Virginia’s near-93% rate reflects years of emphasizing graduation planning and multiple pathways. Suburban districts post especially strong outcomes, while targeted interventions narrow gaps elsewhere. Add in CTE and dual-enrollment options, and you get a broad, durable setup that pushes most students over the diploma line.

#6: Maine — 93%
Maine’s strength comes from tight-knit school communities and smaller average class sizes that make early warning signs easier to spot. Districts lean on attendance initiatives, flexible scheduling, and counseling to keep students moving. The statewide picture is remarkably even—few outliers drag the average down, which sustains a 93% finish.
 Bd2media, CC BY-SA 4.0, Wikimedia Commons
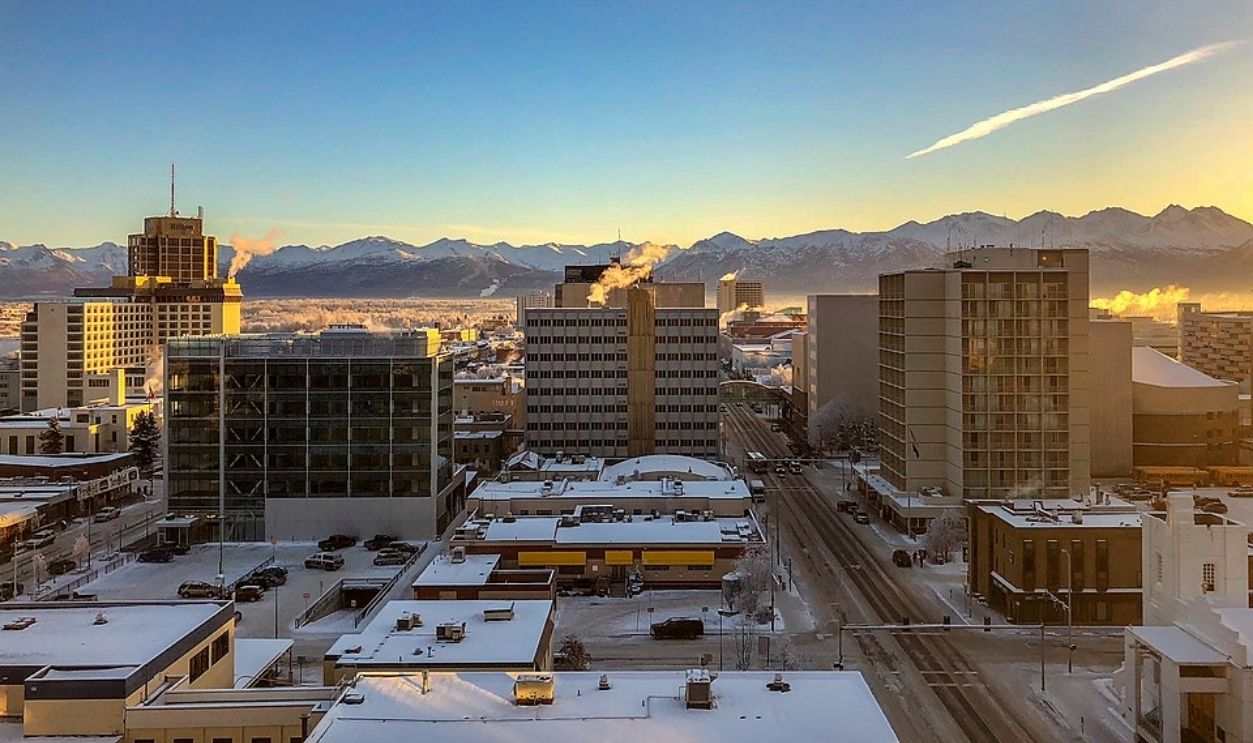
#5: Alaska — 93%
Alaska’s vast geography creates real challenges, but district-level creativity—remote learning supports, culturally responsive programming, and strong partnerships with families—helps seniors close out credits. Career pathways tied to local economies (from healthcare to skilled trades) also keep engagement high. The result: a surprisingly strong 93% in a uniquely tough environment.
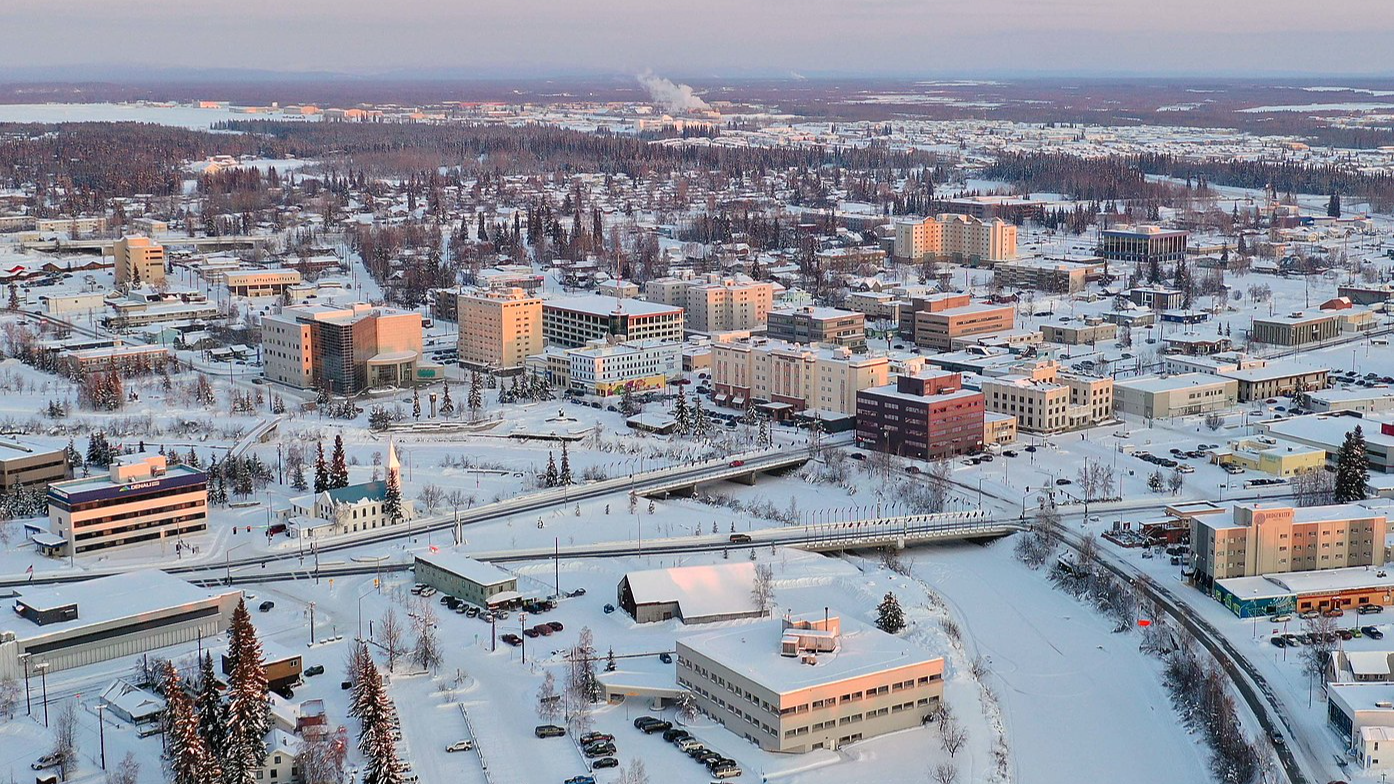 Quintin Soloviev, CC BY-SA 4.0, Wikimedia Commons
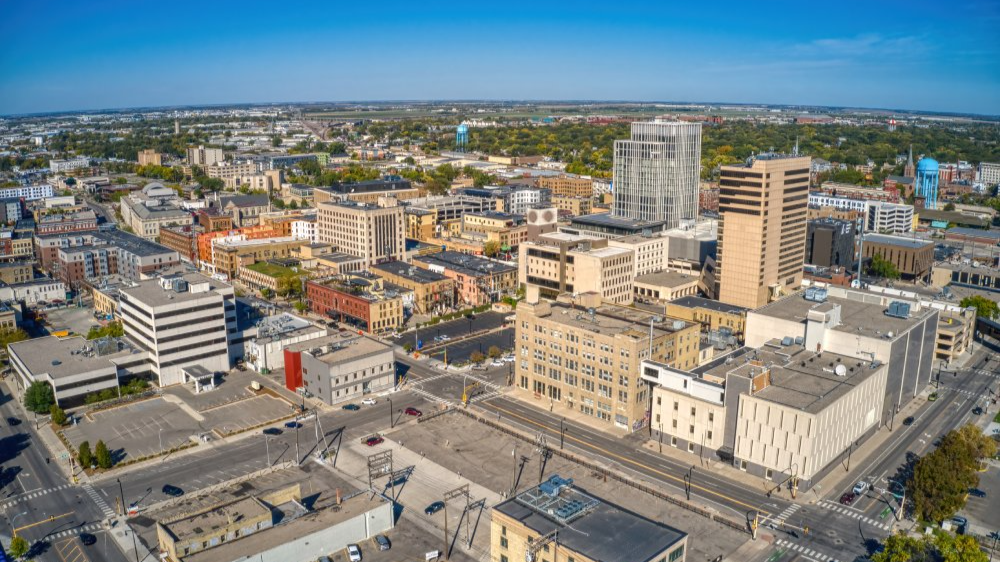
#4: North Dakota — 93%
North Dakota’s stable enrollment and smaller high schools allow for personalized senior-year attention. Early interventions when grades or attendance dip, plus robust CTE options, help teens finish on time. Rural districts punch above their weight here—the consistency across communities is what keeps the statewide rate right at 93%.
#3: Minnesota — 93%
Minnesota balances rigorous academics with multiple completion paths, from dual credit to work-based learning. Strong suburban performance and improving supports in regional centers yield a statewide figure that holds steady at 93%. The difference between Minnesota and the two states above it is essentially rounding territory.

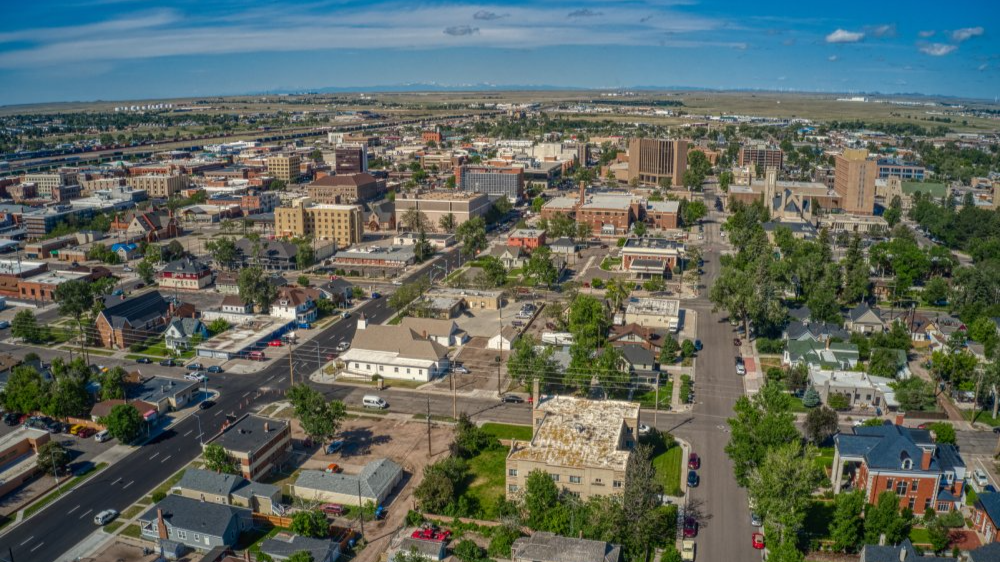
#2: Wyoming — 93%
Wyoming’s small schools and close student-adult connections make it easier to catch issues early and personalize plans. Many districts emphasize attendance, tutoring, and flexible scheduling for seniors who need that last push. While it shares the 93% headline with others, consistency across districts keeps Wyoming right near the top.
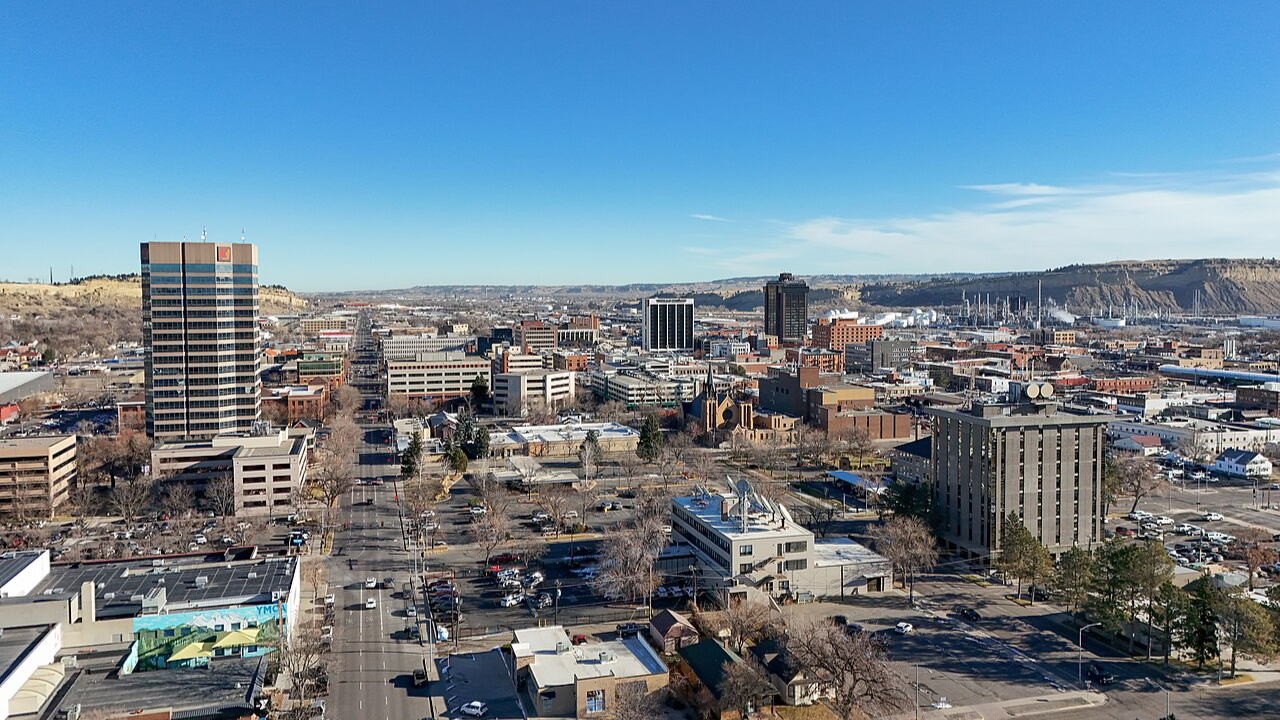
#1: Montana — 94%
Montana takes the crown with an impressive 94%. What works? Strong community schools, clear graduation checkpoints, and relevant pathways—especially CTE—that keep students motivated. With fewer large urban systems to create big swings, the statewide average benefits from reliable performance across districts. It’s the definition of steady excellence.
 Quintin Soloviev, CC BY 4.0, Wikimedia Commons
Now, who’s struggling most?
Before we point fingers, a quick note: different datasets (federal vs. state vs. media compilations) can report slightly different figures in different years. Still, patterns emerge. Next are eight of the lowest performers from recent data. You’ll notice a few surprises, and some big-state challenges.
 Harrison Keely, Wikimedia Commons
#8: Louisiana — 85.9%
Louisiana’s rate sits mid-80s, reflecting persistent hurdles: high poverty in many districts, recovery from weather events, and pandemic learning loss. The state has pushed career pathways and graduation coaching, but progress is uneven. Closing attendance gaps and boosting credit-recovery quality are key to moving the needle.

#7: Mississippi — 85.3%
Mississippi has made big long-term gains, yet some sources still place its graduation rate in the mid-80s. The picture varies by district: many are thriving, but others wrestle with chronic absenteeism and course completion. Continued focus on early warning systems and targeted senior supports remains essential.

#6: Texas — 84.4%
Texas is massive and diverse, and that scale shows up in the statewide rate. Urban mobility, course retakes, and uneven attendance patterns can tug the average down. Expanded CTE, early college, and Individual Graduation Committees help many students finish—but consistency across 1,000+ districts is the challenge.
 Carol M. Highsmith, Wikimedia Commons
#5: California — 83.9%
California’s size and complexity—language diversity, housing instability, and chronic absenteeism—put pressure on on-time completion. The state tracks both four- and five-year rates; extended-year completers push totals higher, but the strict four-year ACGR sits in the low-80s in some compilations. Tackling attendance and credit-accumulation gaps is priority one.
 Sharon Hahn Darlin, Wikimedia Commons
#4: Alaska — under 80%
Here’s the twist: some recent statewide reports show Alaska’s four-year rate below 80% for the Class of 2022–2023, reflecting remote geography, student mobility, and attendance barriers in rural hubs. Methodology and year differences explain why Alaska can appear in both lists depending on the source used.
 Will Buckner, CC BY 2.0, Wikimedia Commons
#3: Arizona — under 80%
Arizona’s on-time graduation rate has trended below the national average, landing in the upper-70s in several recent analyses. Factors include high student mobility and recovery from pandemic-era learning disruptions. State and nonprofit partners emphasize boosting ninth-grade success and attendance to reverse the slide.

#2: New Mexico — under 80% (≈76.7%)
New Mexico’s recent statewide rate hovers in the high-70s, with the Class of 2023 reported at about 76.7%. Districts show bright spots—especially where CTE pathways are strong—but statewide challenges around attendance, credit accumulation, and course proficiency keep the four-year ACGR under 80%.
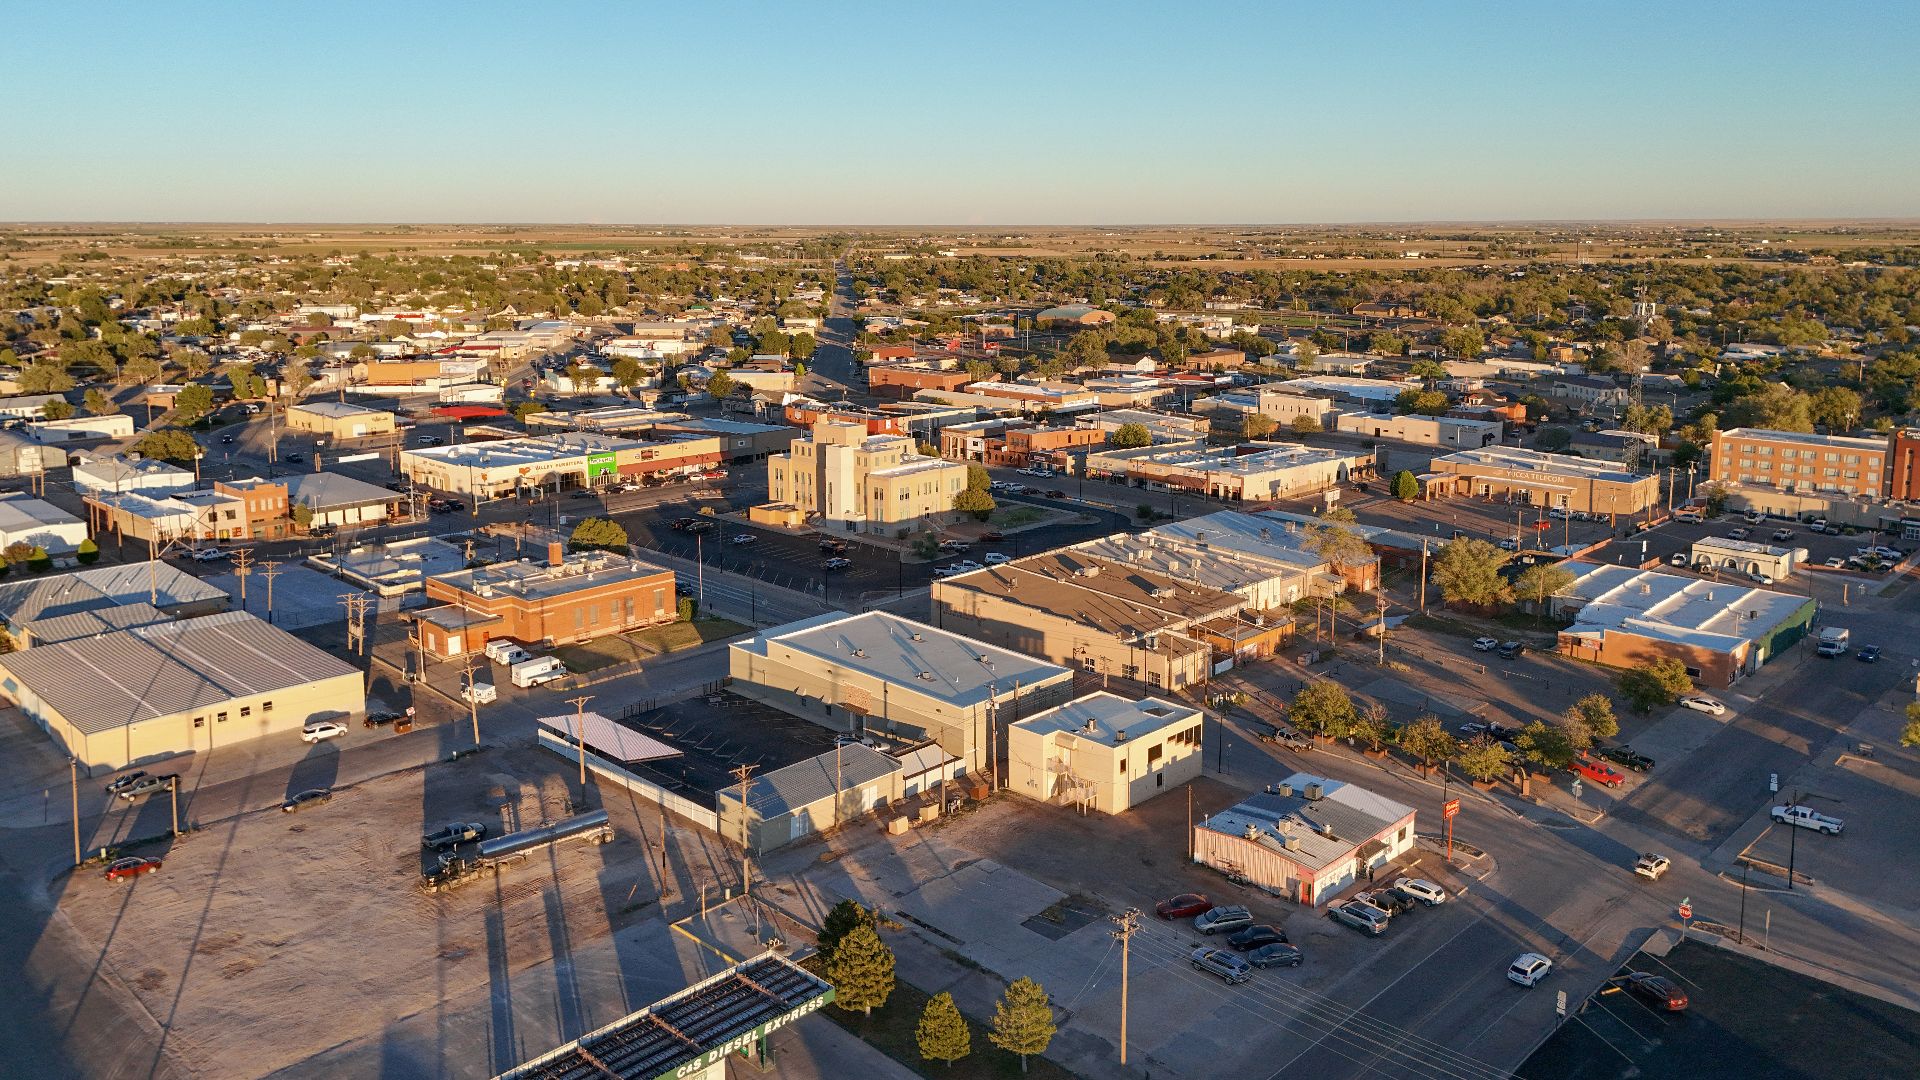 Quintin Soloviev, Wikimedia Commons
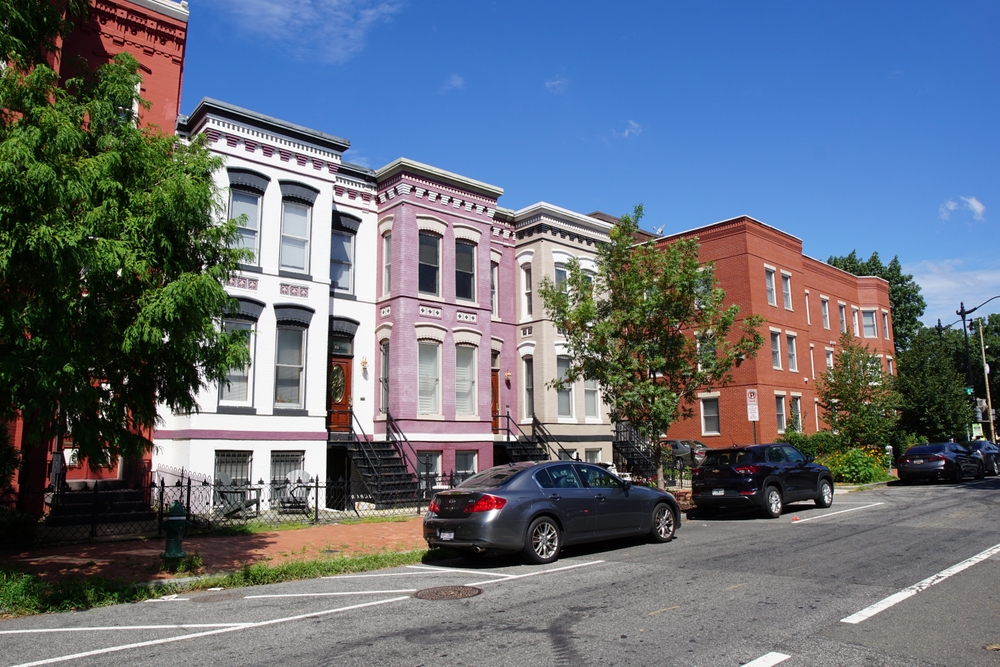
#1: District of Columbia — 76.1% (lowest)
DC remains at the bottom in recent four-year ACGR reporting, with 76.1% in 2022–23. The city has seen multi-year improvement, but chronic absenteeism and course-completion gaps persist. Local agencies are layering mentoring, ninth-grade on-track monitoring, and credit-recovery supports to keep climbing.
You May Also Like:
Countries With The Most Expensive Groceries—And How They Compare To The U.S.
Ranking The Top Cities For Young Professionals—According To Data
Ranking The Fastest Growing Cities In America


.jpg)