

From Chalkboards to Champions: Which States Excel in Public Education?
Public schools are the foundation of a strong society—so which states are doing it best? Using recent data from national education metrics, we ranked all 50 states from the worst to best public school systems. Our methodology combines the following data points to get an overall score:
• Graduation Rate (%): Overall high school completion rate
• Average NAEP (aka: "The Nation's Report Card") Score: Combined proficiency in math and reading
• Per-Pupil Spending ($): Annual average spent per student
• Student-Teacher Ratio: Average number of students per teacher
Let's jump into the rankings, starting with the worst...
50: Wisconsin
Score: 86.4
Graduation Rate (%): 85.9
Average NAEP Score: 231.3
Per-Pupil Spending ($): 9,824
Student-Teacher Ratio: 18.9

49: North Carolina
Score: 87.8
Graduation Rate (%): 76.3
Average NAEP Score: 246.5
Per-Pupil Spending ($): 10,918
Student-Teacher Ratio: 19.2 Wirestock, Adobe Stock
48: New Hampshire
Score: 89.4
Graduation Rate (%): 86.8
Average NAEP Score: 247.9
Per-Pupil Spending ($): 9,111
Student-Teacher Ratio: 19.4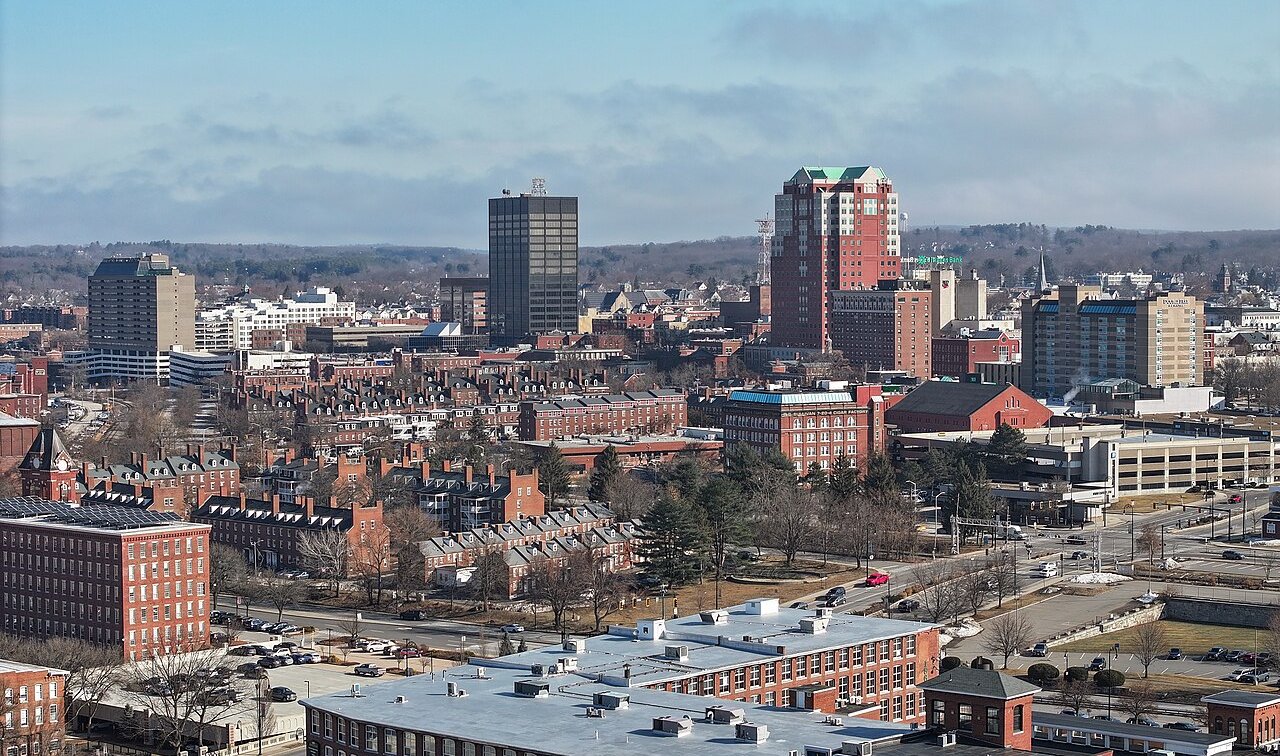 Quintin Soloviev, CC BY 4.0, Wikimedia Commons
47: Wyoming
Score: 89.7
Graduation Rate (%): 78.7
Average NAEP Score: 235.4
Per-Pupil Spending ($): 13,458
Student-Teacher Ratio: 17.8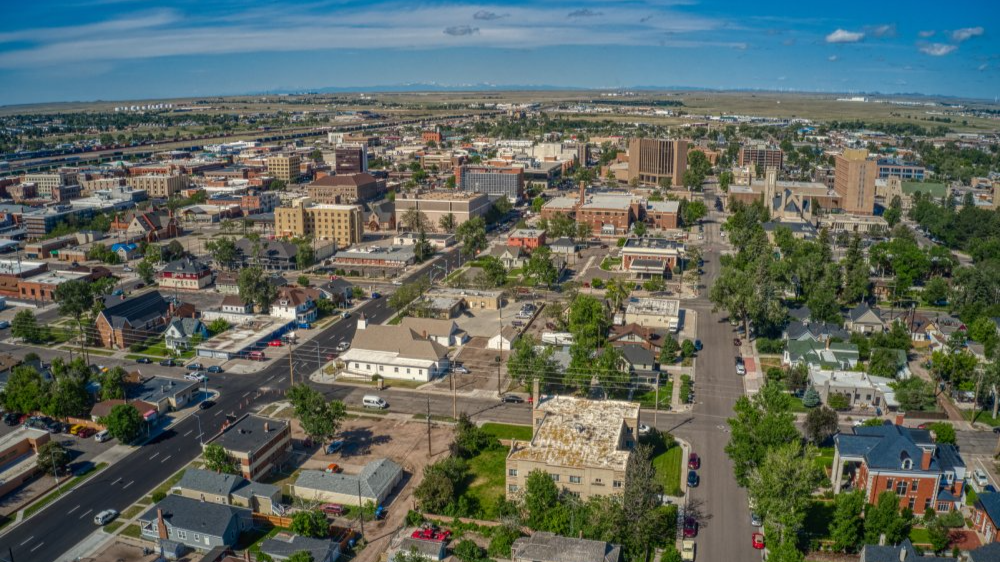 Jacob, Adobe Stock
46: North Dakota
Score: 91.4
Graduation Rate (%): 94.0
Average NAEP Score: 233.2
Per-Pupil Spending ($): 14,402
Student-Teacher Ratio: 18.8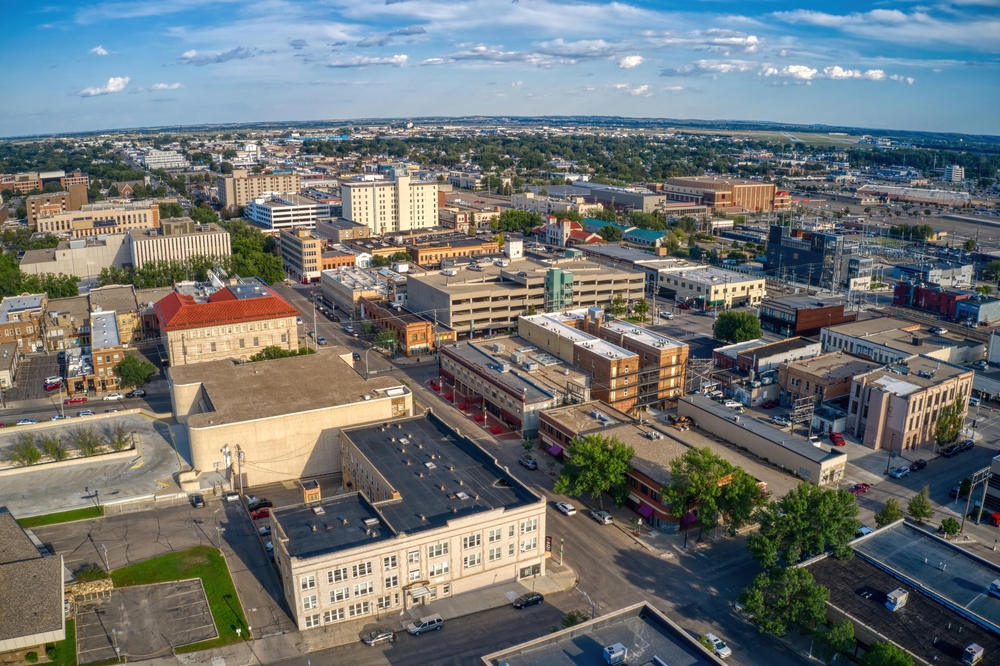 Jacob Boomsma, Shutterstock
45: Connecticut
Score: 92.0
Graduation Rate (%): 76.2
Average NAEP Score: 234.4
Per-Pupil Spending ($): 15,566
Student-Teacher Ratio: 16.7 SeanPavonePhoto, Adobe Stock
44: Georgia
Score: 94.4
Graduation Rate (%): 89.2
Average NAEP Score: 246.3
Per-Pupil Spending ($): 10,232
Student-Teacher Ratio: 17.3 paulbr75, Pixabay
43: Minnesota
Score: 94.6
Graduation Rate (%): 80.8
Average NAEP Score: 230.3
Per-Pupil Spending ($): 14,088
Student-Teacher Ratio: 15.1

42: West Virginia
Score: 94.7
Graduation Rate (%): 85.4
Average NAEP Score: 251.4
Per-Pupil Spending ($): 17,043
Student-Teacher Ratio: 19.0 Blending Focus, Adobe Stock
41: Tennessee
Score: 96.2
Graduation Rate (%): 84.9
Average NAEP Score: 265.7
Per-Pupil Spending ($): 13,029
Student-Teacher Ratio: 19.0

40: Texas
Score: 96.4
Graduation Rate (%): 75.7
Average NAEP Score: 268.0
Per-Pupil Spending ($): 16,956
Student-Teacher Ratio: 19.0 75316serk, CC BY-SA 4.0, Wikimedia Commons
39: California
Score: 96.5
Graduation Rate (%): 78.1
Average NAEP Score: 259.9
Per-Pupil Spending ($): 23,521
Student-Teacher Ratio: 19.9 Jacob Boomsma, Getty Images
38: Alabama
Score: 96.8
Graduation Rate (%): 82.5
Average NAEP Score: 278.5
Per-Pupil Spending ($): 9,503
Student-Teacher Ratio: 19.1

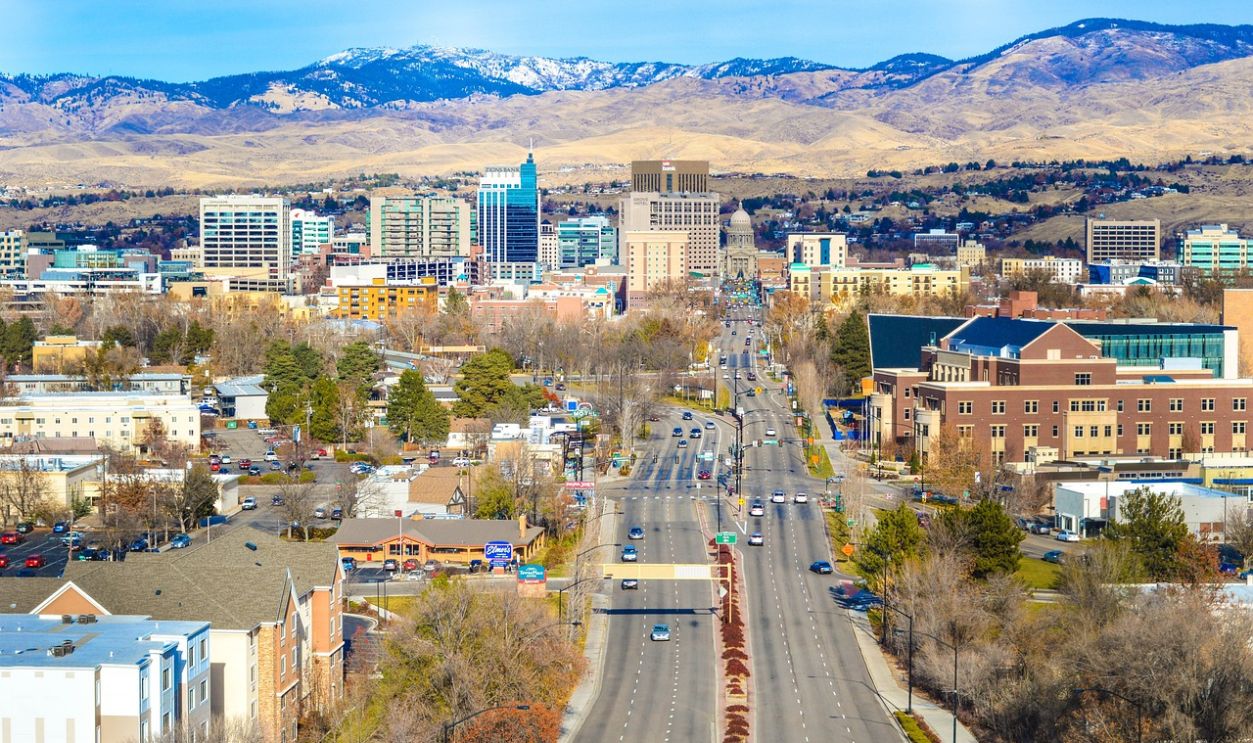
37: Idaho
Score: 97.7
Graduation Rate (%): 94.4
Average NAEP Score: 243.6
Per-Pupil Spending ($): 11,580
Student-Teacher Ratio: 16.3
36: Oklahoma
Score: 98.3
Graduation Rate (%): 91.2
Average NAEP Score: 246.3
Per-Pupil Spending ($): 14,171
Student-Teacher Ratio: 16.6 Zenstratus, Adobe Stock
35: Delaware
Score: 98.4
Graduation Rate (%): 92.3
Average NAEP Score: 239.8
Per-Pupil Spending ($): 21,089
Student-Teacher Ratio: 17.6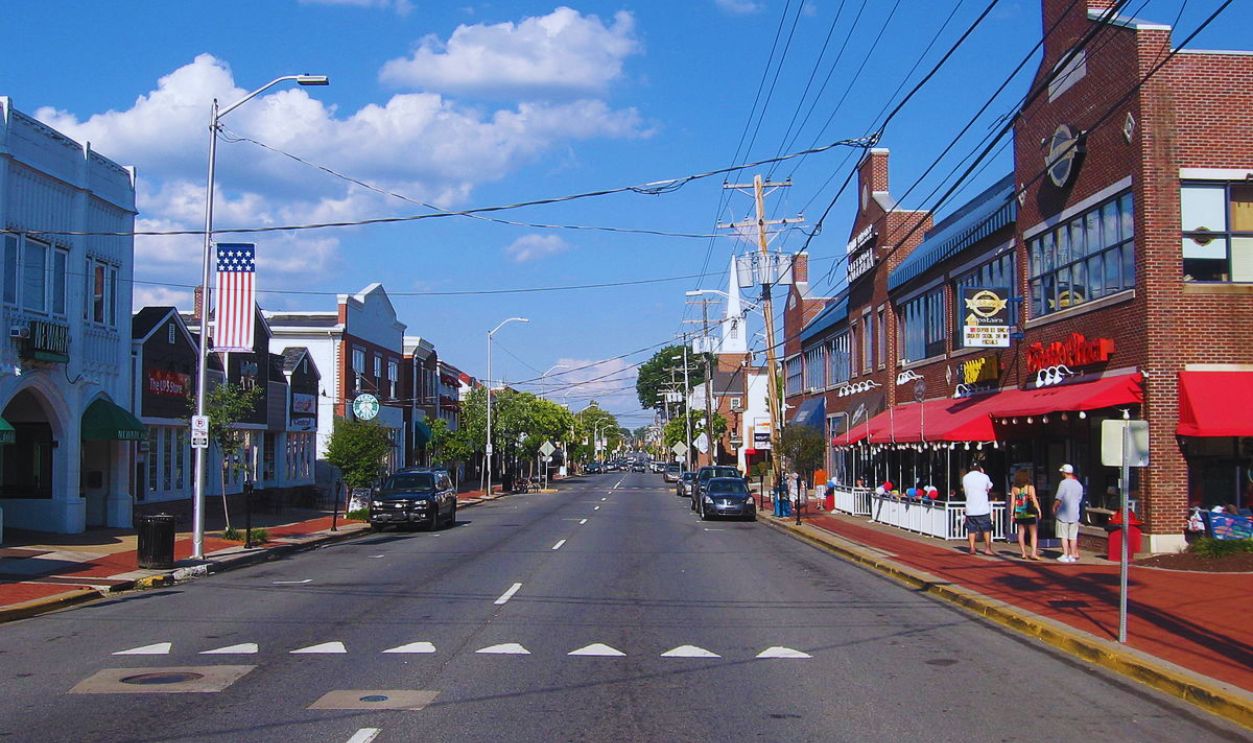 PookieFugglestein, CC0, Wikimedia Commons
34: Kansas
Score: 98.6
Graduation Rate (%): 78.7
Average NAEP Score: 257.1
Per-Pupil Spending ($): 22,943
Student-Teacher Ratio: 18.4 Quintin Soloviev, CC BY 4.0, Wikimedia Commons
33: Washington
Score: 99.1
Graduation Rate (%): 81.2
Average NAEP Score: 256.1
Per-Pupil Spending ($): 18,753
Student-Teacher Ratio: 17.3 espiegle, Adobe Stock
32: Oregon
Score: 99.2
Graduation Rate (%): 81.1
Average NAEP Score: 266.5
Per-Pupil Spending ($): 17,301
Student-Teacher Ratio: 18.2
 Visitor7, CC BY-SA 3.0, Wikimedia Commons
31: Hawaii
Score: 100.6
Graduation Rate (%): 75.4
Average NAEP Score: 249.4
Per-Pupil Spending ($): 13,636
Student-Teacher Ratio: 13.7 ArdentArbitration, Wikimedia Commons
30: Missouri
Score: 100.7
Graduation Rate (%): 84.1
Average NAEP Score: 265.3
Per-Pupil Spending ($): 12,647
Student-Teacher Ratio: 16.5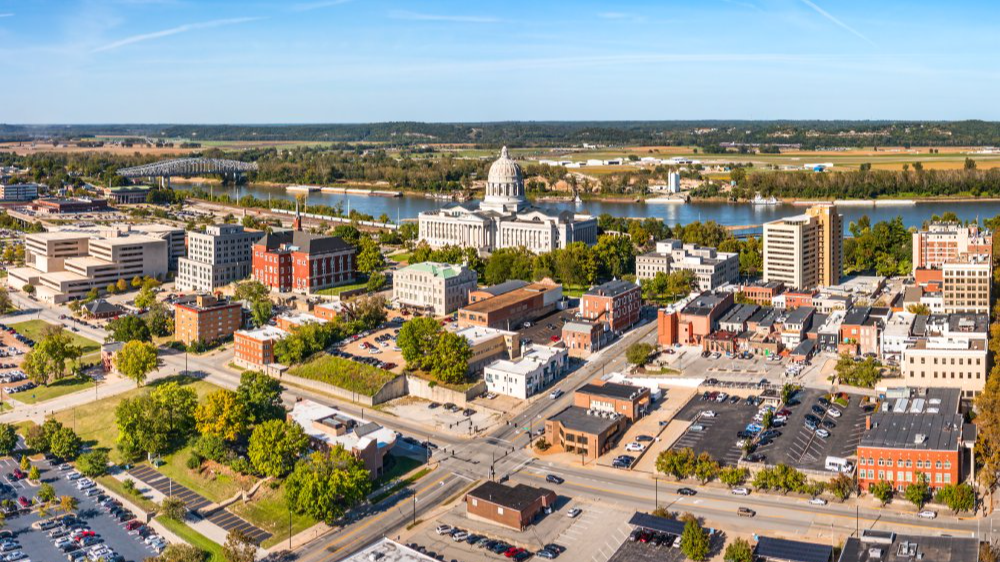 mandritoiu, Adobe Stock
29: Florida
Score: 101.4
Graduation Rate (%): 87.0
Average NAEP Score: 232.3
Per-Pupil Spending ($): 12,661
Student-Teacher Ratio: 12.4 Felix Mizioznikov, Adobe Stock
28: Indiana
Score: 101.9
Graduation Rate (%): 79.2
Average NAEP Score: 247.8
Per-Pupil Spending ($): 21,930
Student-Teacher Ratio: 15.4 tpsdave, Wikimedia Commons
27: Utah
Score: 102.1
Graduation Rate (%): 93.2
Average NAEP Score: 258.1
Per-Pupil Spending ($): 13,814
Student-Teacher Ratio: 16.3 Andrew, Adobe Stock
26: Nevada
Score: 103.3
Graduation Rate (%): 85.3
Average NAEP Score: 233.7
Per-Pupil Spending ($): 22,772
Student-Teacher Ratio: 13.9
 Ken Lund, CC BY-SA 2.0, Wikimedia Commons
25: Virginia
Score: 103.5
Graduation Rate (%): 88.3
Average NAEP Score: 254.7
Per-Pupil Spending ($): 9,590
Student-Teacher Ratio: 13.5 Raynor, Adobe Stock
24: Pennsylvania
Score: 103.6
Graduation Rate (%): 77.0
Average NAEP Score: 261.9
Per-Pupil Spending ($): 20,248
Student-Teacher Ratio: 15.6 Michael Bogner, Adobe Stock
23: New Jersey
Score: 103.7
Graduation Rate (%): 75.9
Average NAEP Score: 235.8
Per-Pupil Spending ($): 17,172
Student-Teacher Ratio: 11.4 Leonid Andronov, Adobe Stock
22: Kentucky
Score: 104.1
Graduation Rate (%): 81.1
Average NAEP Score: 237.0
Per-Pupil Spending ($): 21,859
Student-Teacher Ratio: 13.2 Jacob, Adobe Stock
21: Nebraska
Score: 104.1
Graduation Rate (%): 79.0
Average NAEP Score: 268.6
Per-Pupil Spending ($): 22,088
Student-Teacher Ratio: 16.9 Jacob, Adobe Stock
20: Massachusetts
Score: 106.3
Graduation Rate (%): 87.2
Average NAEP Score: 268.6
Per-Pupil Spending ($): 21,919
Student-Teacher Ratio: 16.8 Wangkun Jia, Adobe Stock
19: Maryland
Score: 107.0
Graduation Rate (%): 80.8
Average NAEP Score: 279.3
Per-Pupil Spending ($): 17,629
Student-Teacher Ratio: 15.9 Sean Pavone, Shutterstock
18: Vermont
Score: 107.2
Graduation Rate (%): 80.2
Average NAEP Score: 268.5
Per-Pupil Spending ($): 13,557
Student-Teacher Ratio: 13.4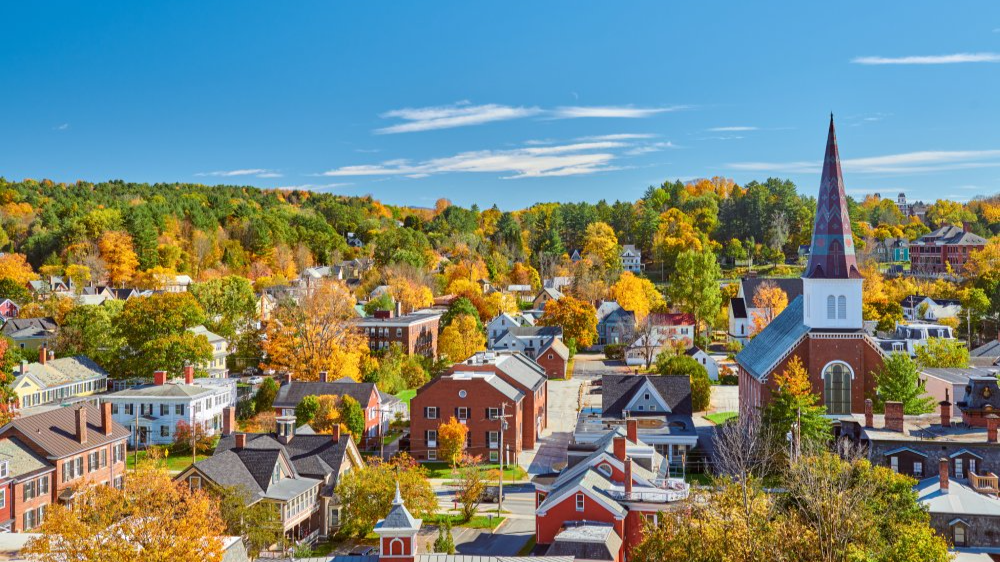 haveseen, Adobe Stock
17: Rhode Island
Score: 107.6
Graduation Rate (%): 88.7
Average NAEP Score: 274.4
Per-Pupil Spending ($): 14,818
Student-Teacher Ratio: 15.3 Wirestock Creators, Adobe Stock
16: Iowa
Score: 108.4
Graduation Rate (%): 78.6
Average NAEP Score: 244.0
Per-Pupil Spending ($): 19,134
Student-Teacher Ratio: 10.9 Nathan, Adobe Stock
15: South Dakota
Score: 108.7
Graduation Rate (%): 77.4
Average NAEP Score: 236.0
Per-Pupil Spending ($): 24,399
Student-Teacher Ratio: 10.9

14: New York
Score: 109.0
Graduation Rate (%): 78.4
Average NAEP Score: 261.2
Per-Pupil Spending ($): 12,554
Student-Teacher Ratio: 11.1 mandritoiu, Adobe Stock
13: Mississippi
Score: 109.1
Graduation Rate (%): 82.3
Average NAEP Score: 270.8
Per-Pupil Spending ($): 10,761
Student-Teacher Ratio: 12.3 Chad Robertson, Adobe Stock
12: Arkansas
Score: 109.2
Graduation Rate (%): 87.0
Average NAEP Score: 274.7
Per-Pupil Spending ($): 17,137
Student-Teacher Ratio: 14.9 Felix Mizioznikov, Adobe Stock
11: Illinois
Score: 110.1
Graduation Rate (%): 91.6
Average NAEP Score: 271.4
Per-Pupil Spending ($): 23,875
Student-Teacher Ratio: 16.3 Richard, Adobe Stock
10: Maine
Score: 110.2
Graduation Rate (%): 83.6
Average NAEP Score: 233.7
Per-Pupil Spending ($): 23,281
Student-Teacher Ratio: 10.4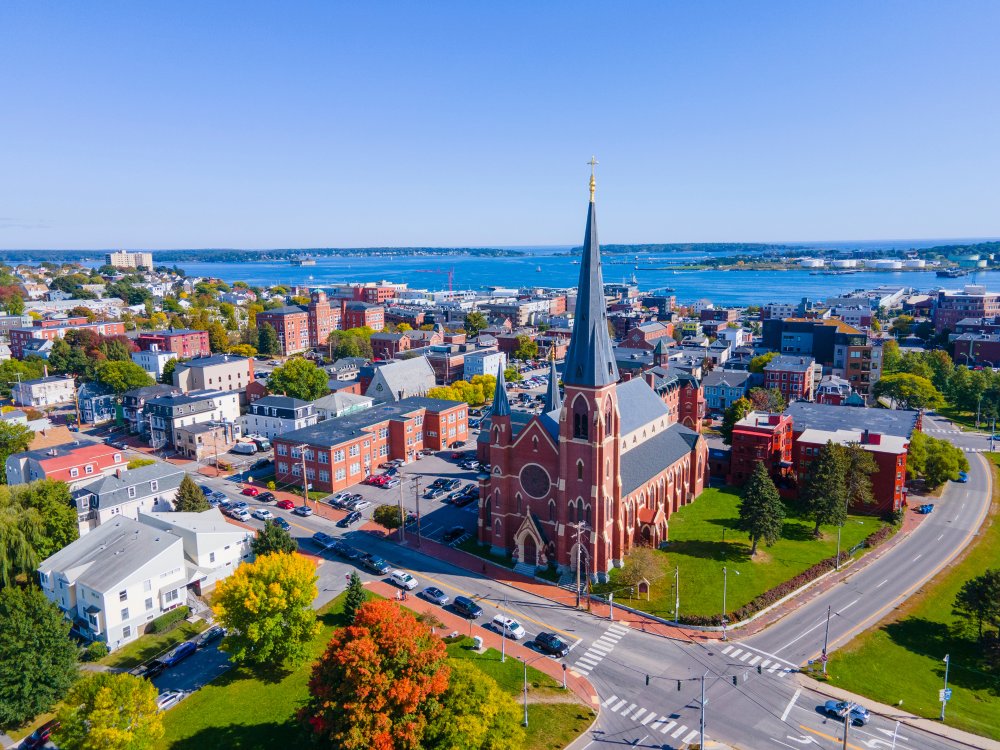 Wangkun Jia, Adobe Stock
9: Colorado
Score: 110.2
Graduation Rate (%): 78.1
Average NAEP Score: 276.1
Per-Pupil Spending ($): 12,989
Student-Teacher Ratio: 12.4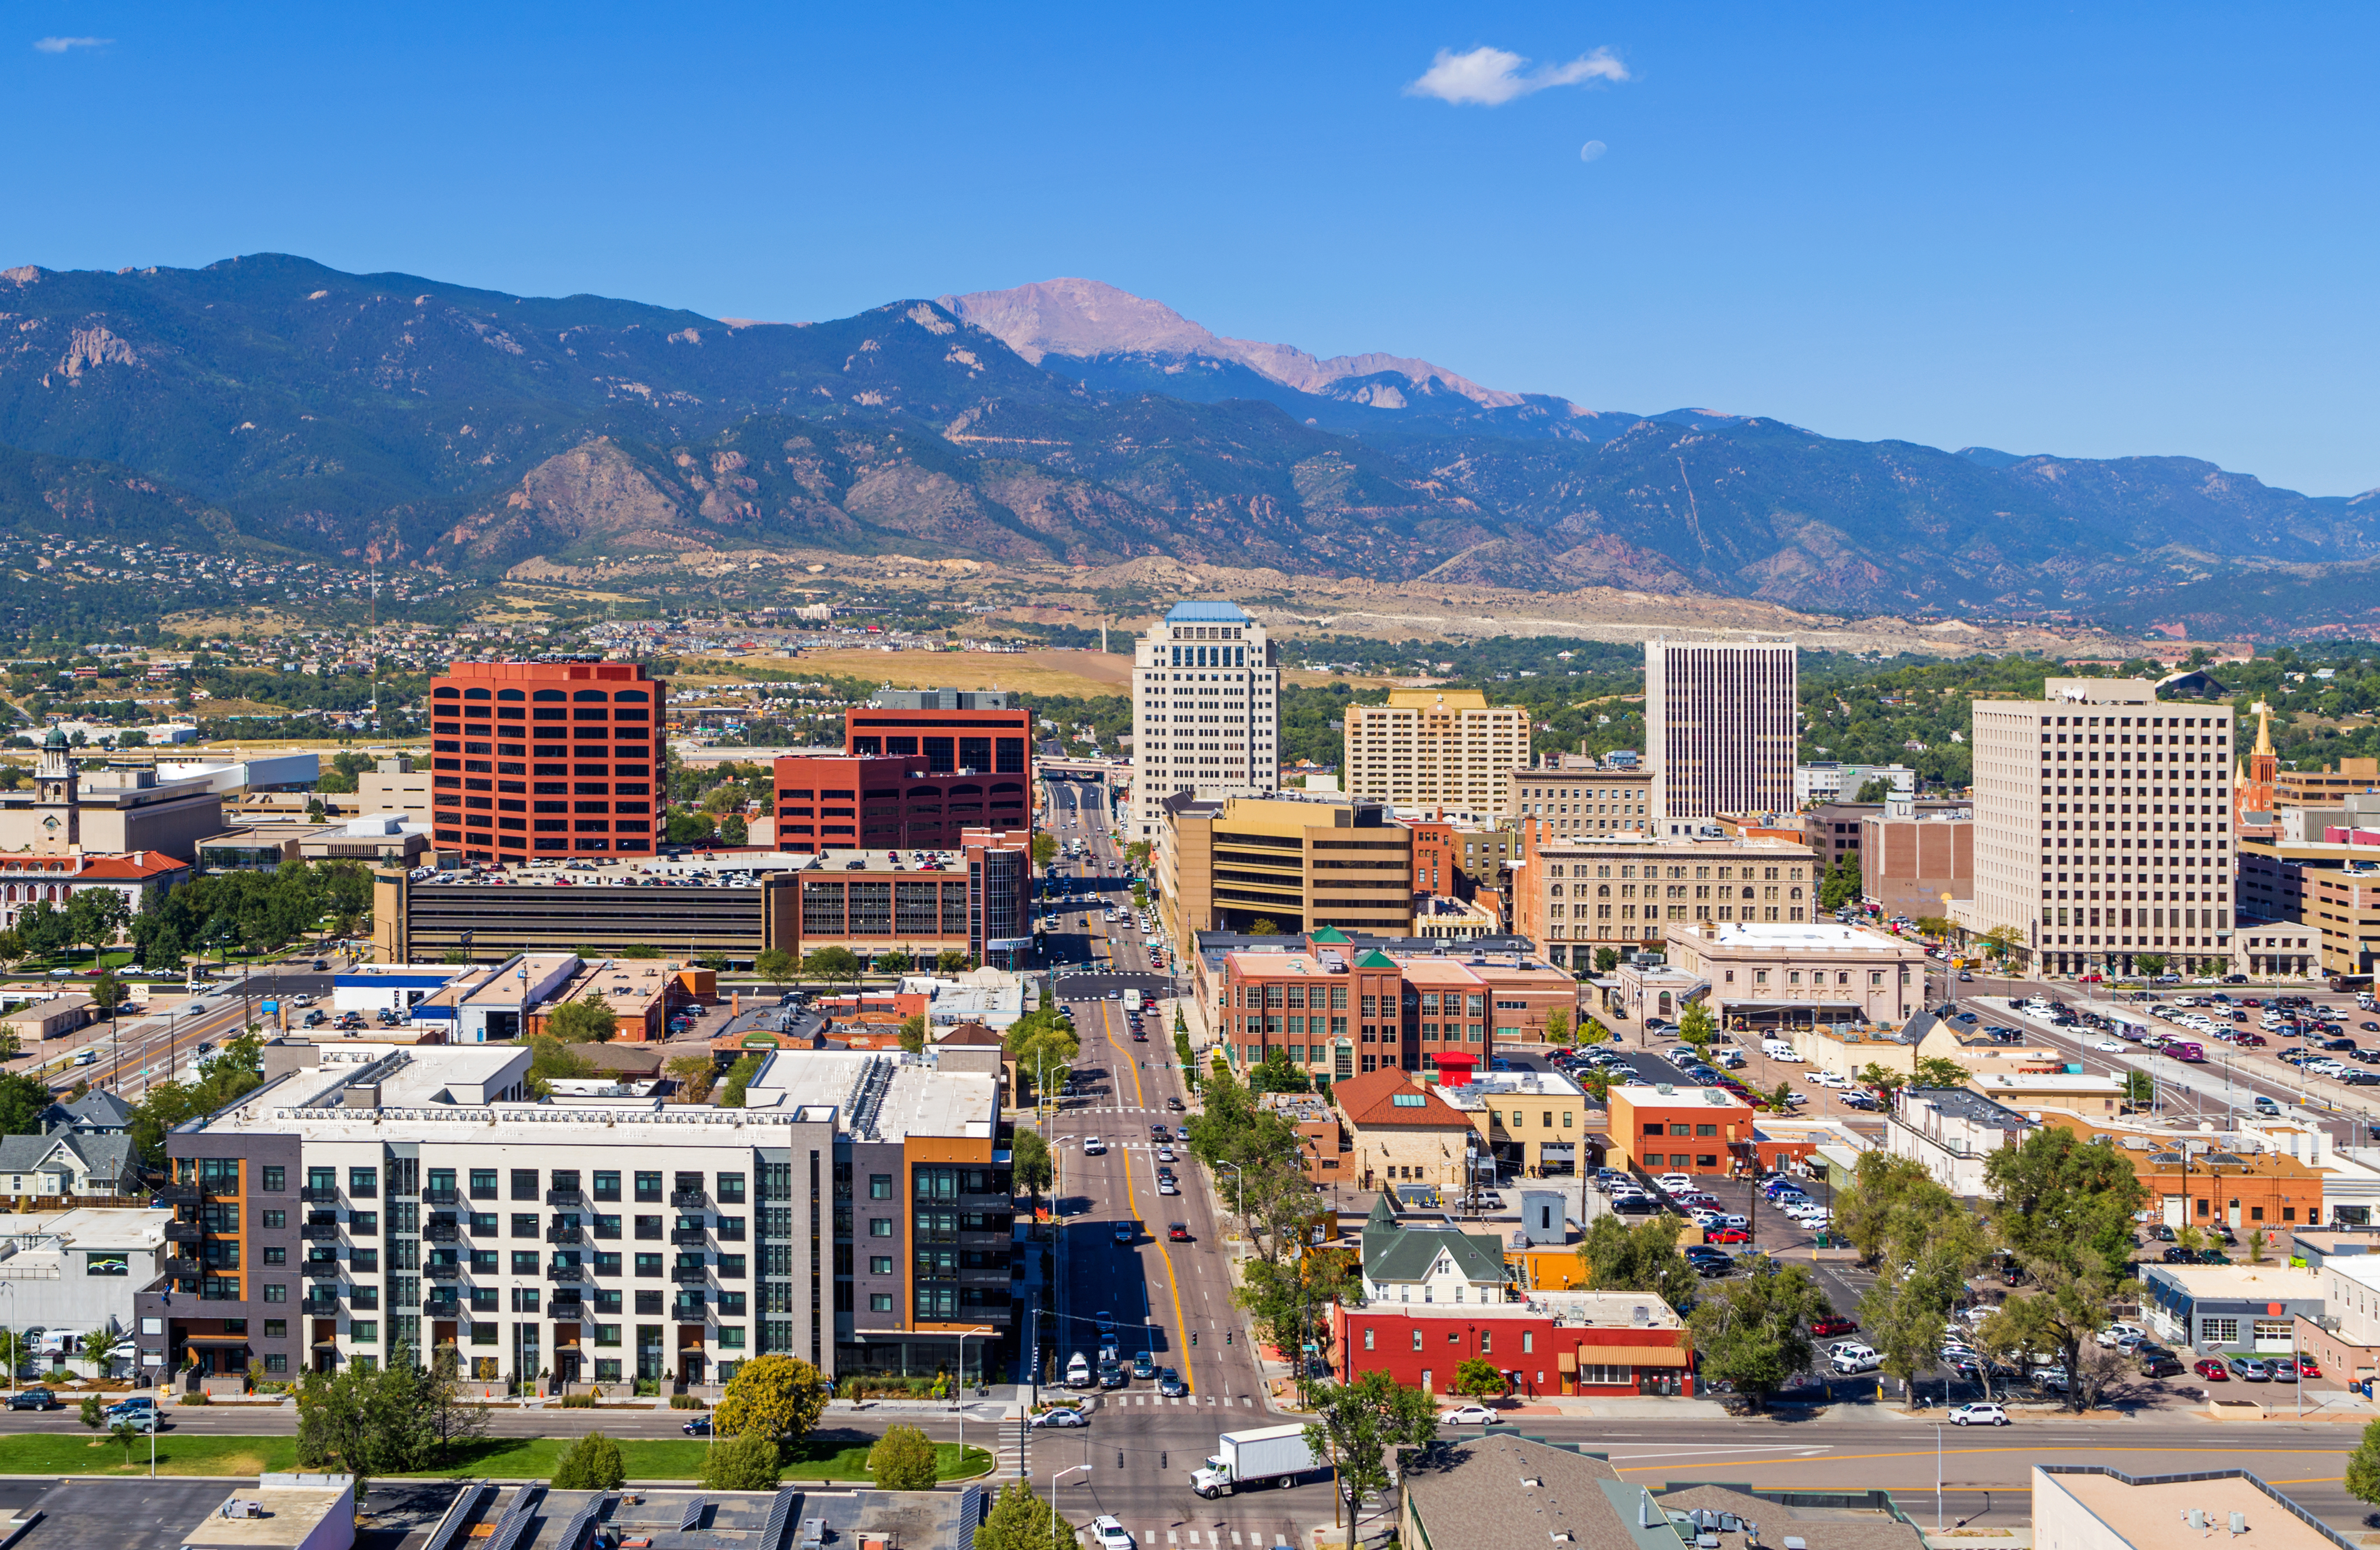 Neil, Adobe Stock
8: Michigan
Score: 110.7
Graduation Rate (%): 77.8
Average NAEP Score: 239.9
Per-Pupil Spending ($): 23,337
Student-Teacher Ratio: 10.2 Jacob, Adobe Stock
7: Louisiana
Score: 111.1
Graduation Rate (%): 85.5
Average NAEP Score: 270.1
Per-Pupil Spending ($): 11,985
Student-Teacher Ratio: 11.9 CrackerClips, Adobe Stock
6: New Mexico
Score: 111.1
Graduation Rate (%): 87.2
Average NAEP Score: 273.2
Per-Pupil Spending ($): 15,679
Student-Teacher Ratio: 13.4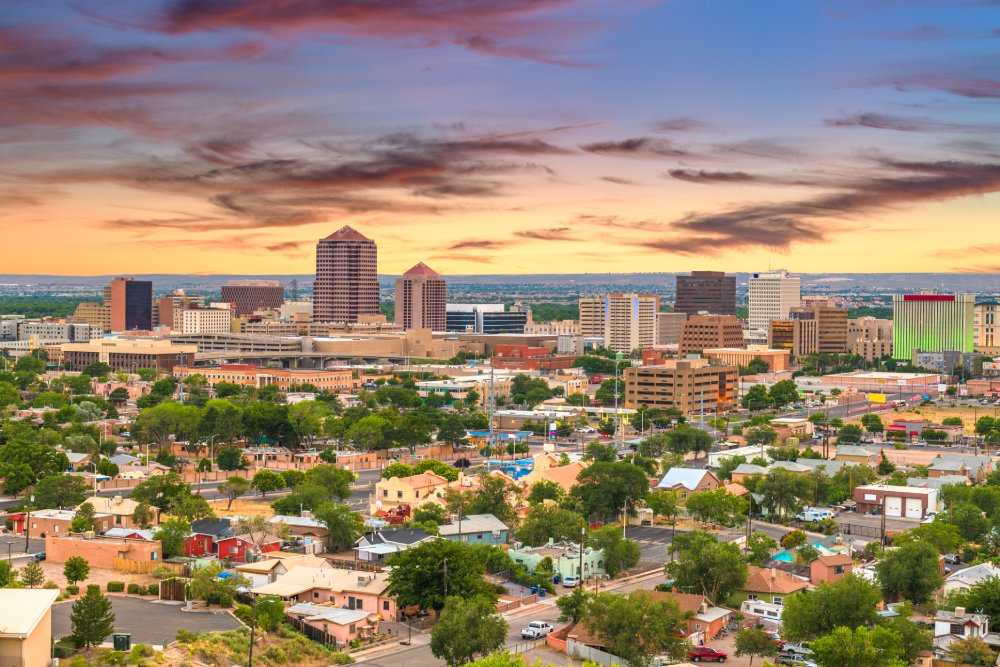 SeanPavonePhoto, Adobe Stock
5: Ohio
Score: 111.8
Graduation Rate (%): 94.3
Average NAEP Score: 245.5
Per-Pupil Spending ($): 24,087
Student-Teacher Ratio: 12.6 Ellie Brown, Unsplash
4: South Carolina
Score: 111.8
Graduation Rate (%): 83.8
Average NAEP Score: 253.6
Per-Pupil Spending ($): 24,549
Student-Teacher Ratio: 12.4 Kevin Ruck, Adobe Stock
3: Montana
Score: 113.8
Graduation Rate (%): 90.7
Average NAEP Score: 266.5
Per-Pupil Spending ($): 15,834
Student-Teacher Ratio: 11.7
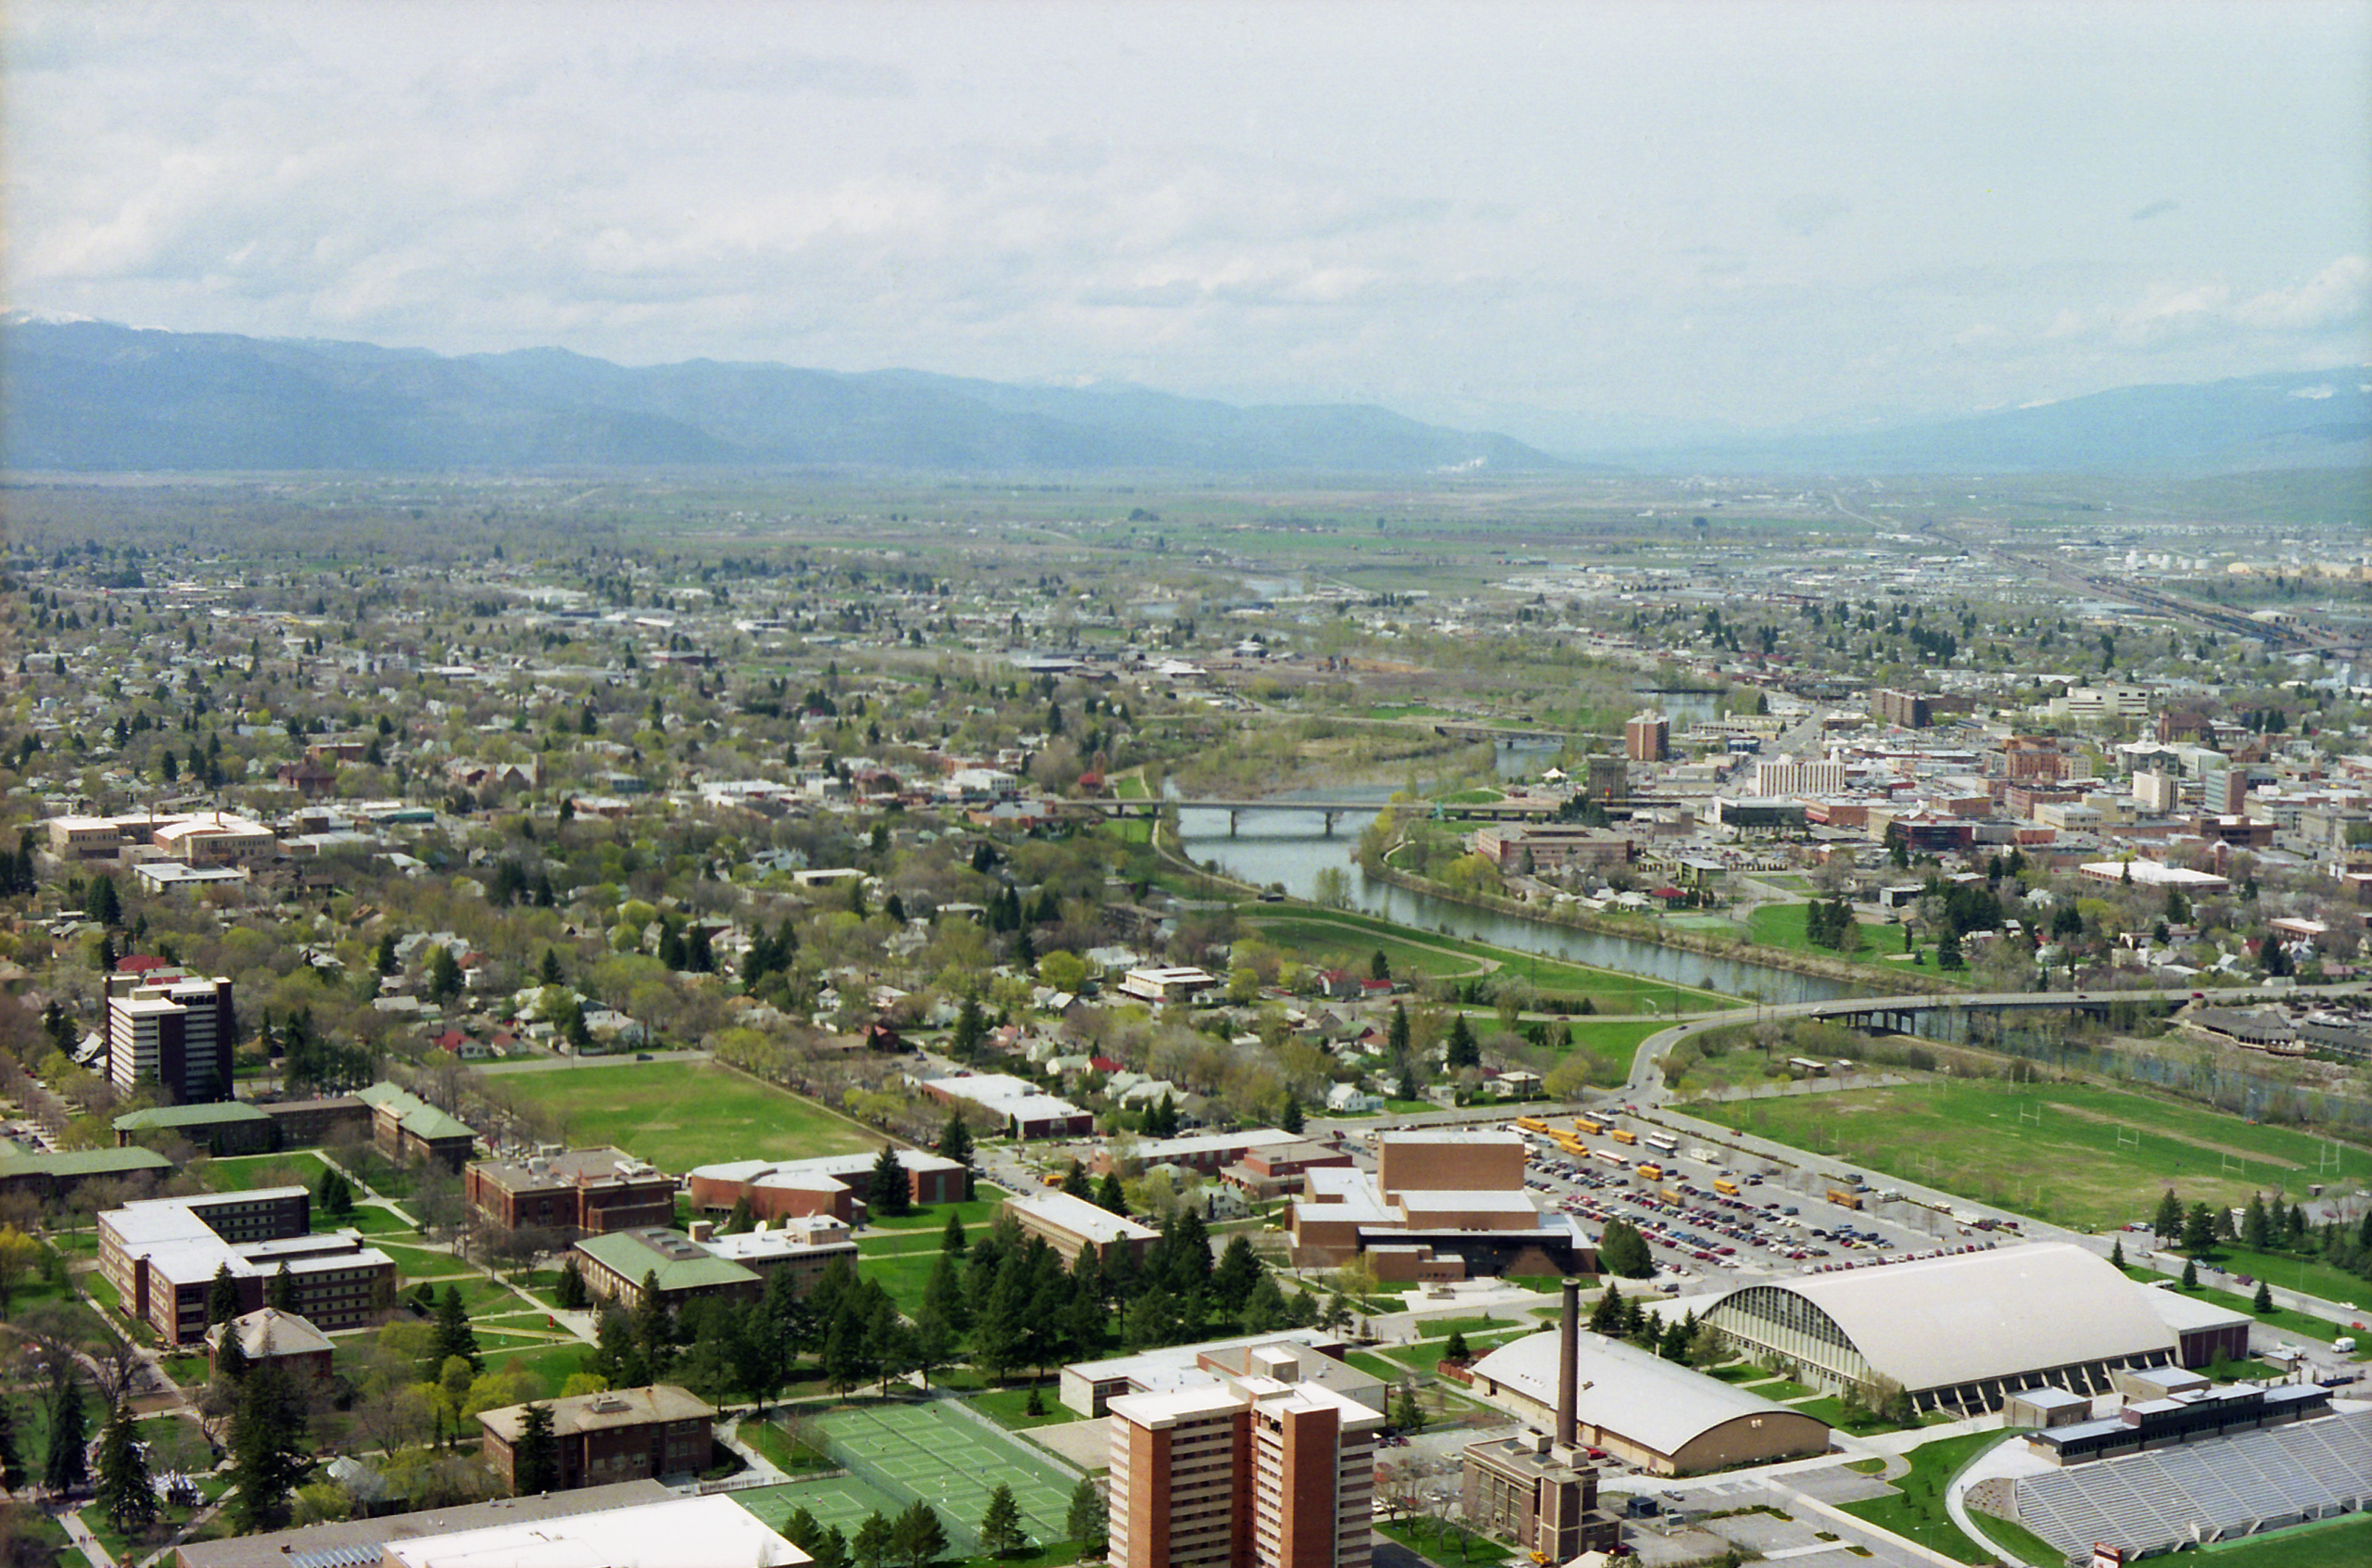 Ken Eckert, CC BY-SA 4.0, Wikimedia Commons
2: Alaska
Score: 115.5
Graduation Rate (%): 94.0
Average NAEP Score: 268.8
Per-Pupil Spending ($): 19,183
Student-Teacher Ratio: 12.4 Alan Wu, CC BY-SA 2.0, Wikimedia Commons
1: Arizona
Score: 115.9
Graduation Rate (%): 89.6
Average NAEP Score: 277.0
Per-Pupil Spending ($): 14,030
Student-Teacher Ratio: 11.4

You Might Also Like:
Scariest Roller Coasters in Every State
What Salary Do You Need To Be Middle Class In Every American State In 2025?
"Old School" School Rules That Would Make Modern Parents Balk


.jpg)
.jpg)