
The Dirty 30
We all know we’re destroying our environment. However, some countries are trashing the planet faster than others. From pumping out greenhouse gases to bulldozing forests and dumping plastic in the oceans, the damage isn’t spread evenly.
We ranked nations using four key measures:
Total CO₂ emissions – who releases the most overall
Per capita emissions – pollution per person
Deforestation & land use change – forest loss and resource destruction
Waste & pollution impacts – plastic leakage, air quality, and more
Weighting of factors:
Emissions: ~60% of the score
Deforestation + Waste/Pollution: ~40% combined
The result is a Planet Damage Score for each country, revealing not just the heaviest polluters overall, but also those doing outsized harm per person or through destruction of natural resources.
Here’s the countdown of the top 30 environmental wreckers—ranked from bad to worst.
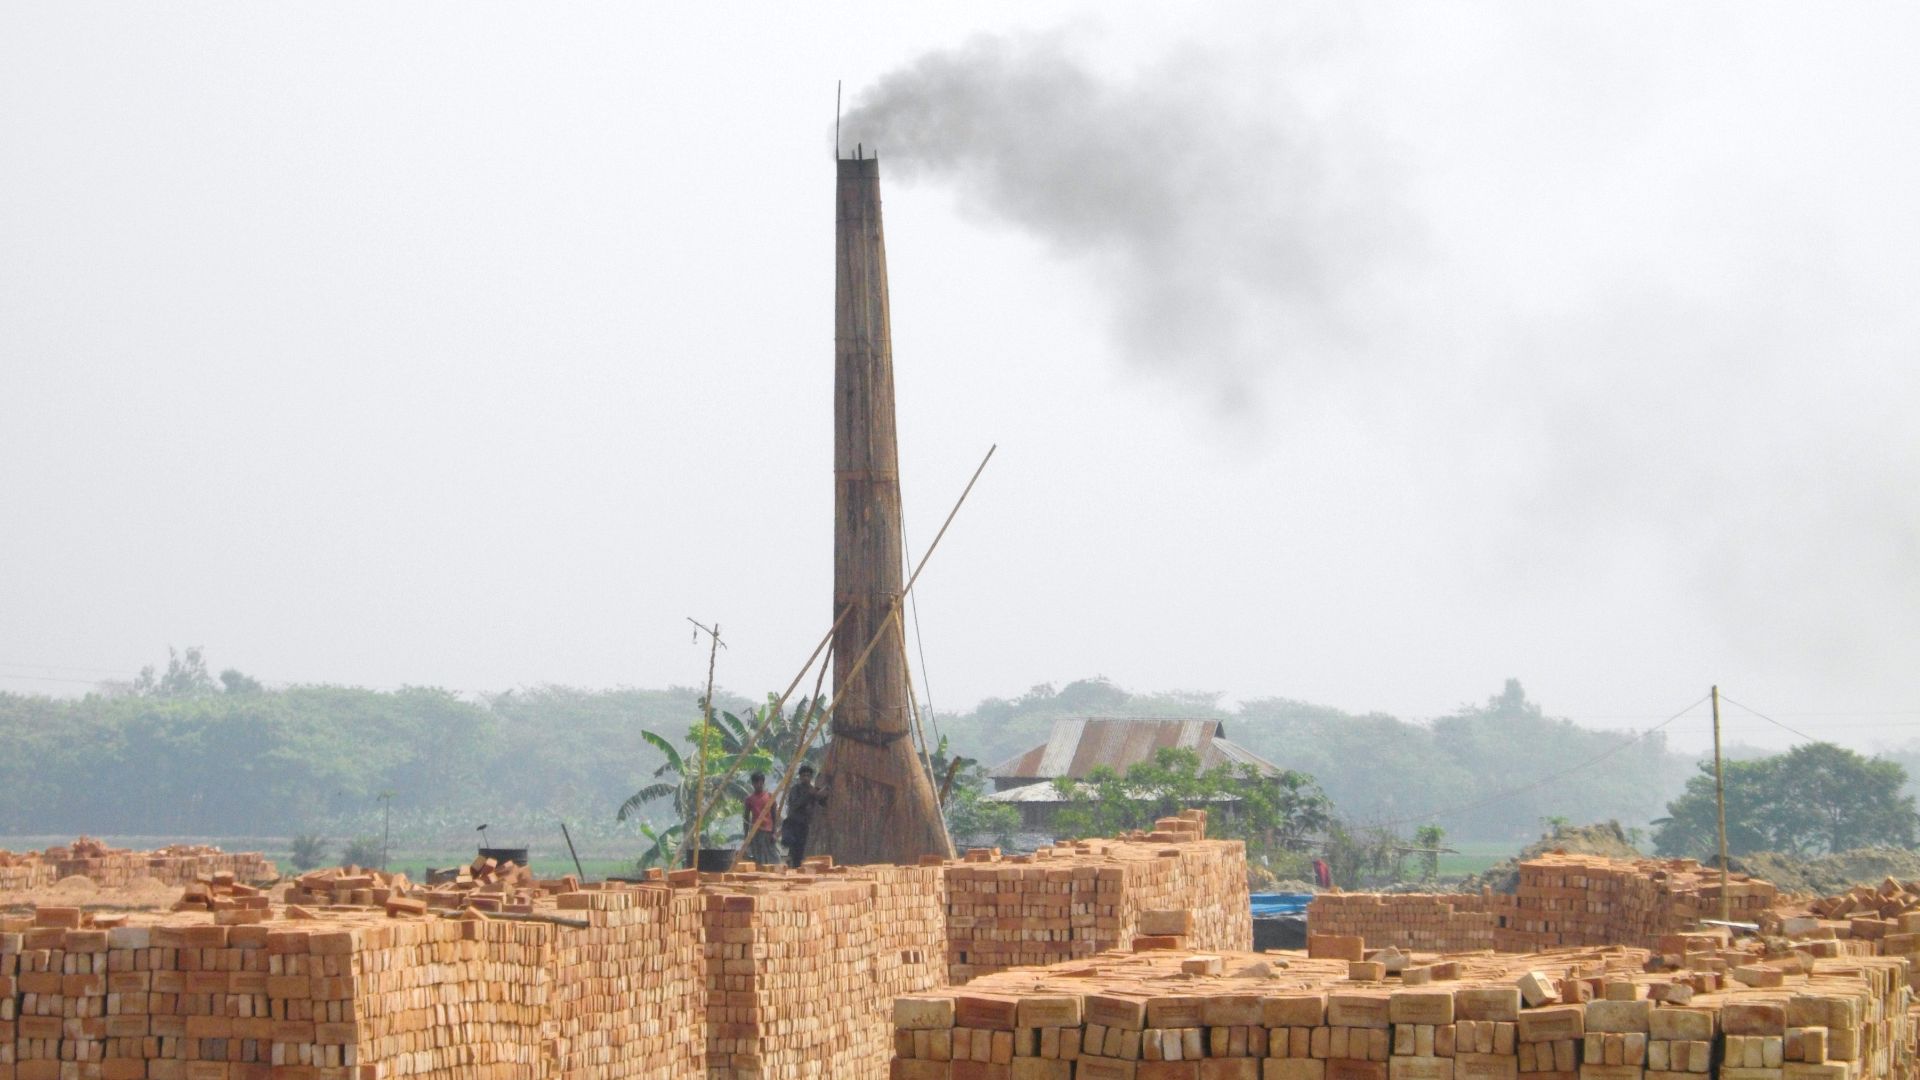
30: Bangladesh
Planet Damage Score: 21
Total CO₂ emissions: ~110 million metric tons
Per capita CO₂ emissions: ~0.7 metric tons
Deforestation/Land use impact: Moderate forest cover loss
Waste/Pollution impact: Severe air pollution and ~800,000 tons plastic mismanaged
Despite low per-person emissions, Bangladesh’s pollution crisis and mismanaged waste push it into the Dirty 30.
 Faizul Latif Chowdhury, Wikimedia Commons
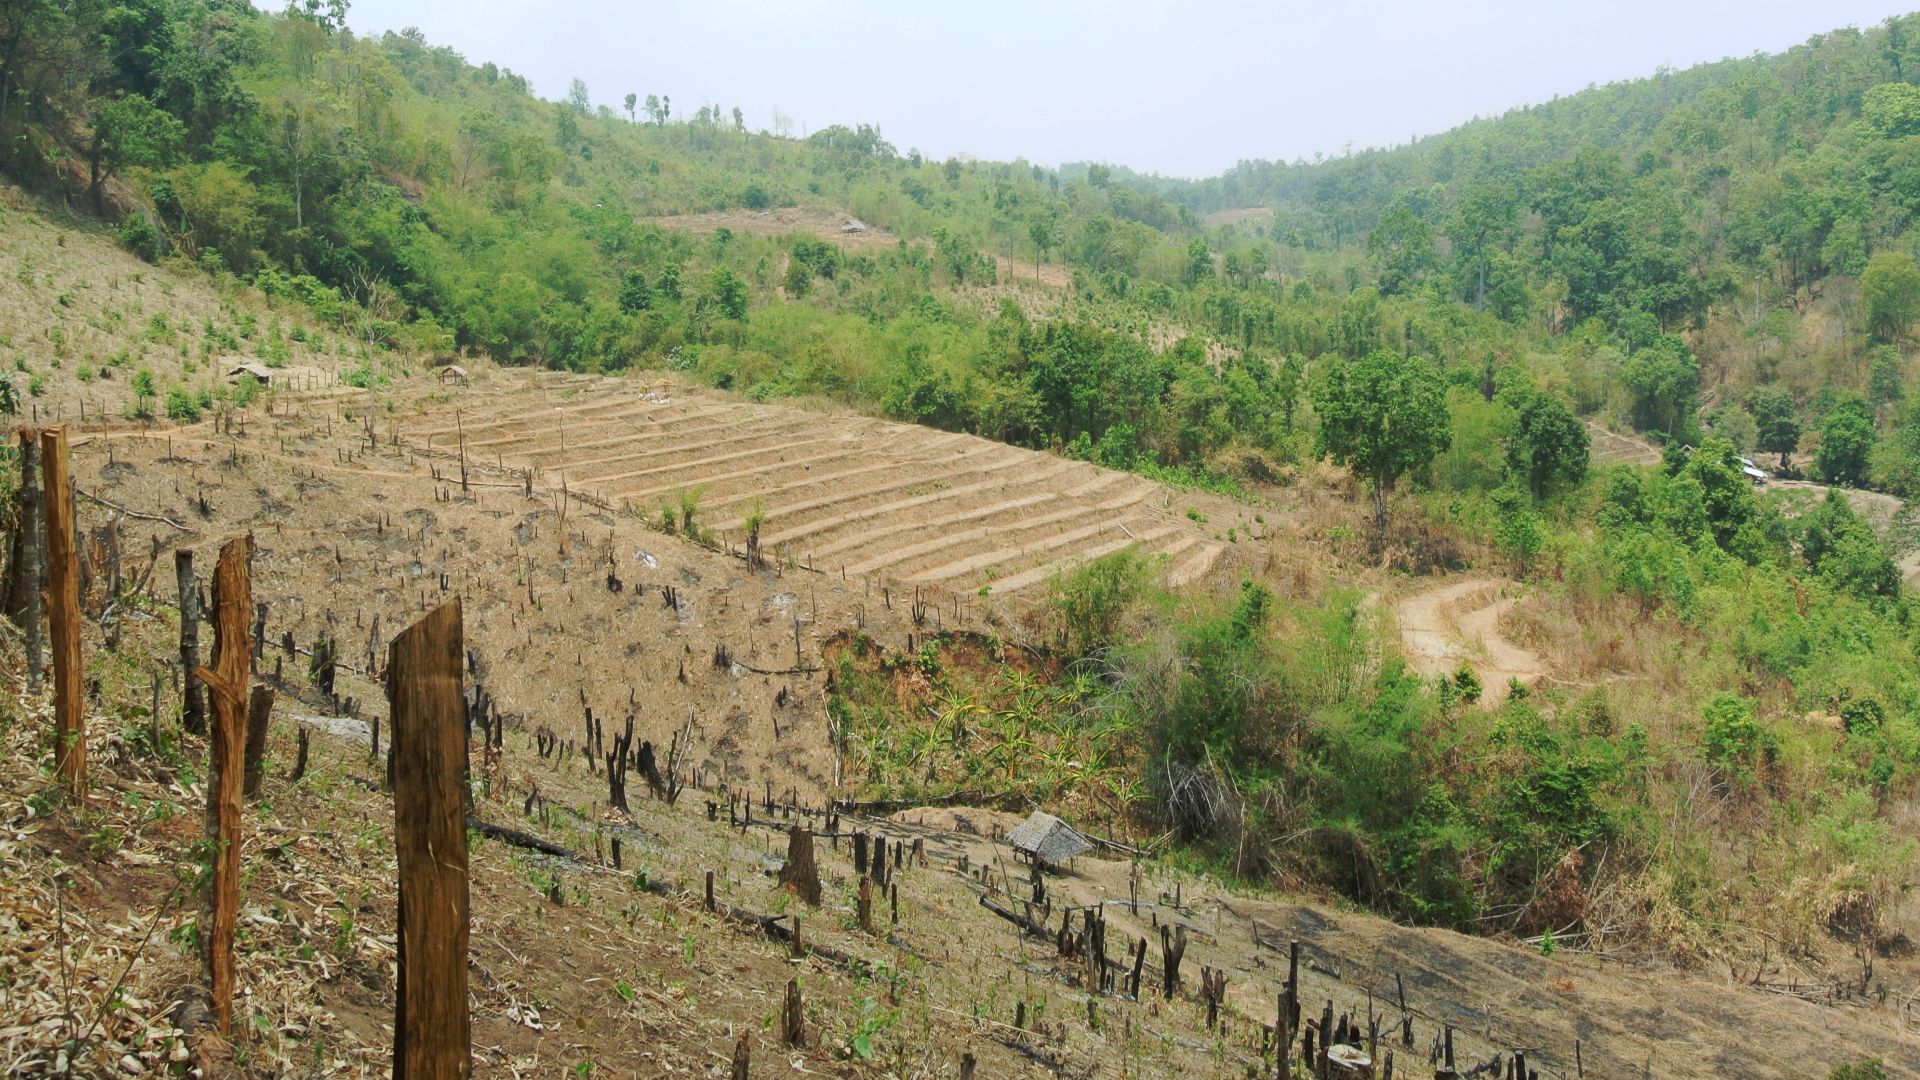
29: Thailand
Planet Damage Score: 22
Total CO₂ emissions: ~300 million metric tons
Per capita CO₂ emissions: ~4.3 metric tons
Deforestation/Land use impact: 1.1% annual forest loss
Waste/Pollution impact: ~1 million tons plastic mismanaged yearly
Thailand’s growth has fueled heavy deforestation and mounting plastic waste.
28: Italy
Planet Damage Score: 23
Total CO₂ emissions: ~330 million metric tons
Per capita CO₂ emissions: ~5.6 metric tons
Deforestation/Land use impact: Limited, some forest pressure
Waste/Pollution impact: High waste per capita, urban smog
Italy’s reliance on cars and industrial activity keeps it high in Europe’s offenders.
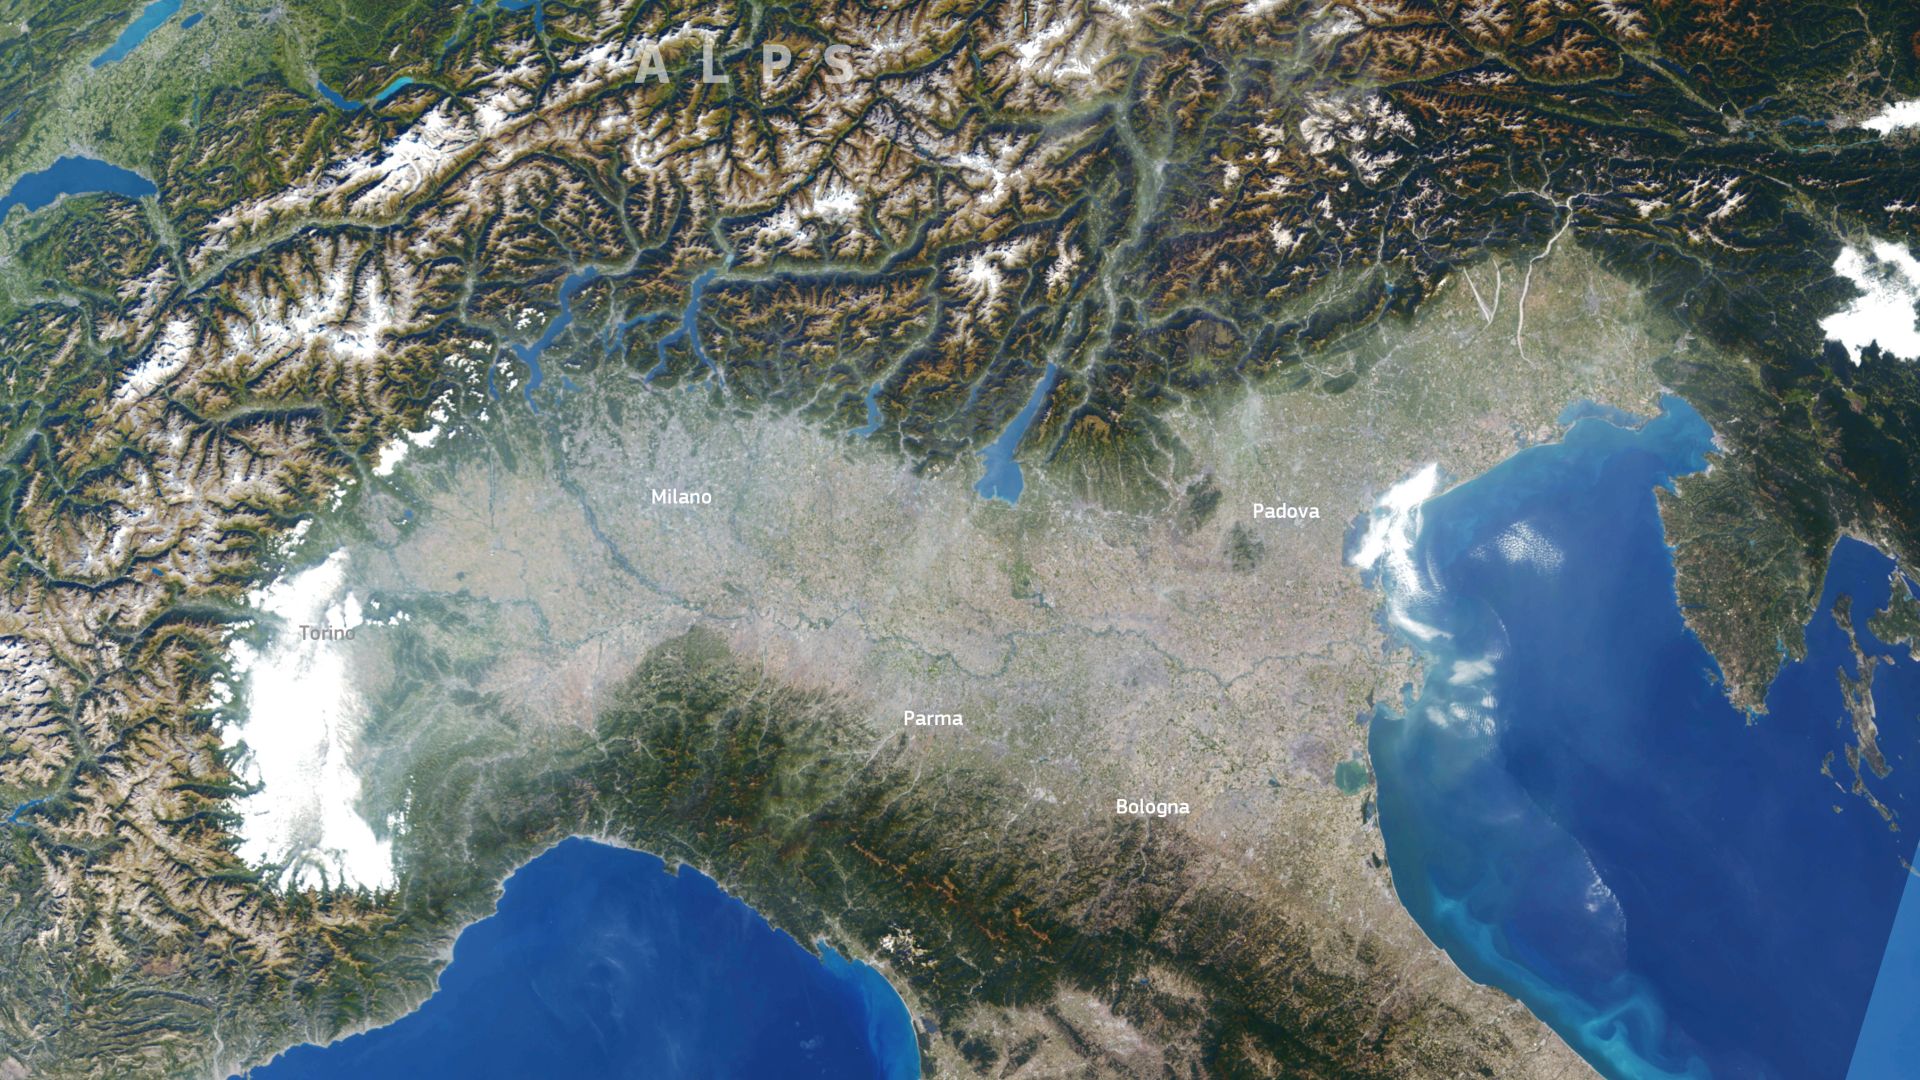 European Union, Copernicus Sentinel-3 imagery, Wikimedia Commons
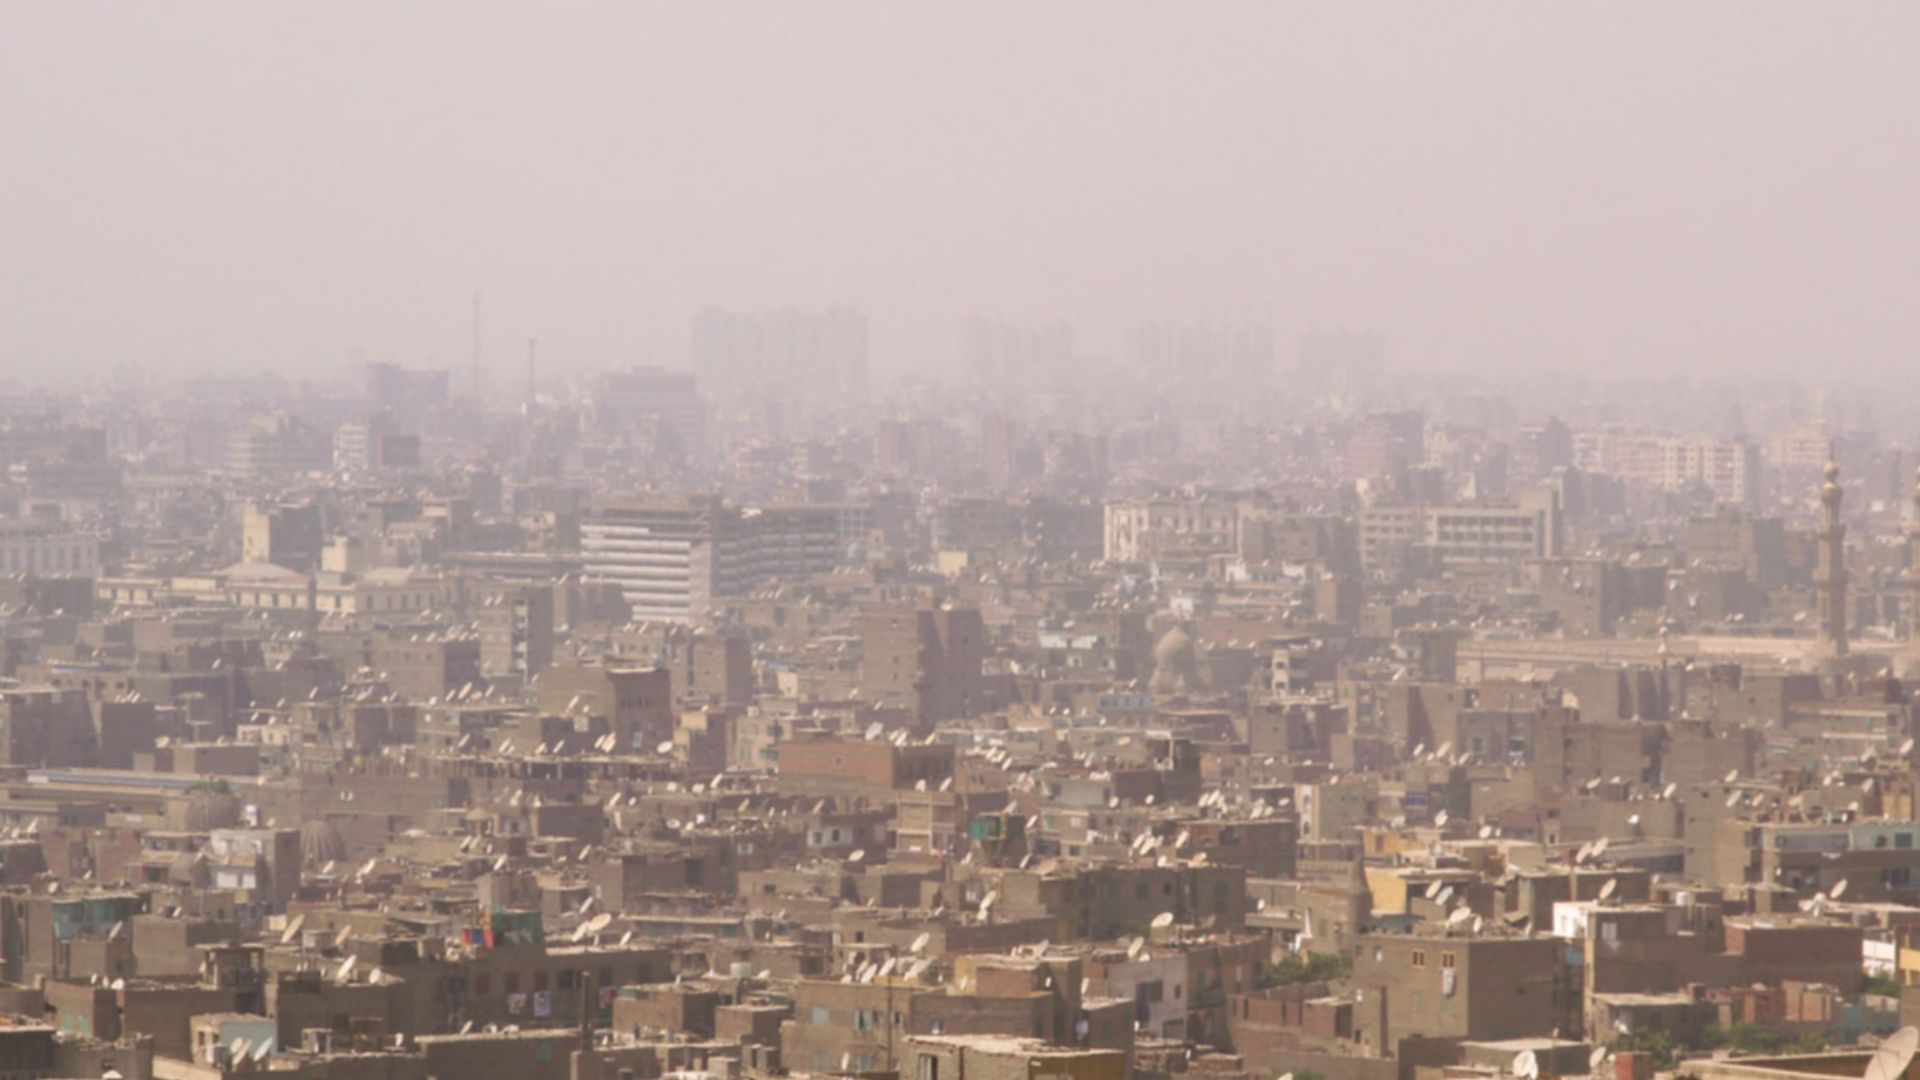
27: Egypt
Planet Damage Score: 23
Total CO₂ emissions: ~280 million metric tons
Per capita CO₂ emissions: ~2.7 metric tons
Deforestation/Land use impact: Agricultural land stress
Waste/Pollution impact: Severe air quality issues, ~90,000 pollution deaths annually
Egypt’s rapid population growth and fossil fuel reliance strain both land and air.
 Sturm58 at English Wikipedia, Wikimedia Commons
26: Spain
Planet Damage Score: 23
Total CO₂ emissions: ~280 million metric tons
Per capita CO₂ emissions: ~5.9 metric tons
Deforestation/Land use impact: ~30,000 hectares lost yearly
Waste/Pollution impact: ~480 kg waste per person annually
Spain’s waste generation and land pressure add to its environmental toll.

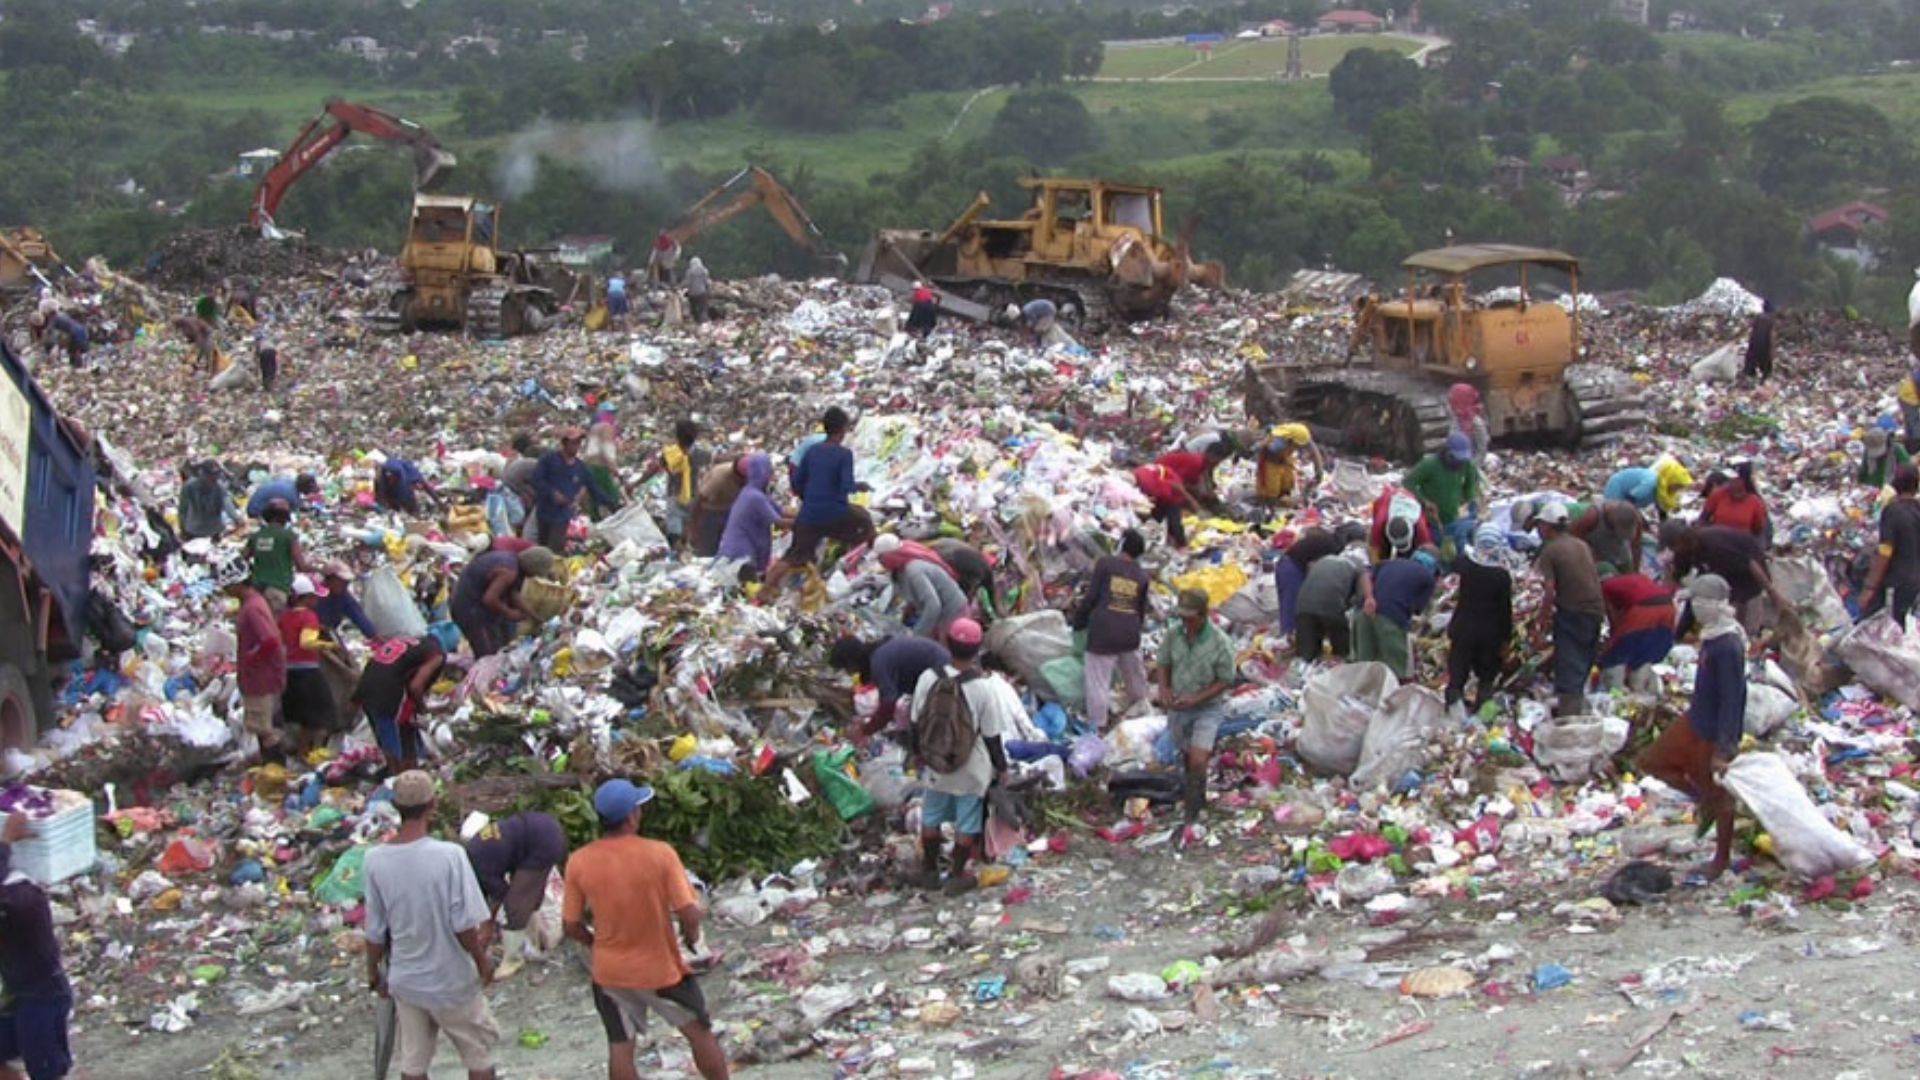
25: Philippines
Planet Damage Score: 25
Total CO₂ emissions: ~150 million metric tons
Per capita CO₂ emissions: ~1.4 metric tons
Deforestation/Land use impact: Significant annual forest loss
Waste/Pollution impact: Among top global plastic polluters
The Philippines’ plastic waste problem cements its place on the Dirty 30.
24: Vietnam
Planet Damage Score: 26
Total CO₂ emissions: ~300 million metric tons
Per capita CO₂ emissions: ~3 metric tons
Deforestation/Land use impact: ~1.5% forest loss annually
Waste/Pollution impact: ~1.8 million tons plastic leakage yearly
Vietnam’s rapid industrialization comes with a heavy deforestation and plastic burden.
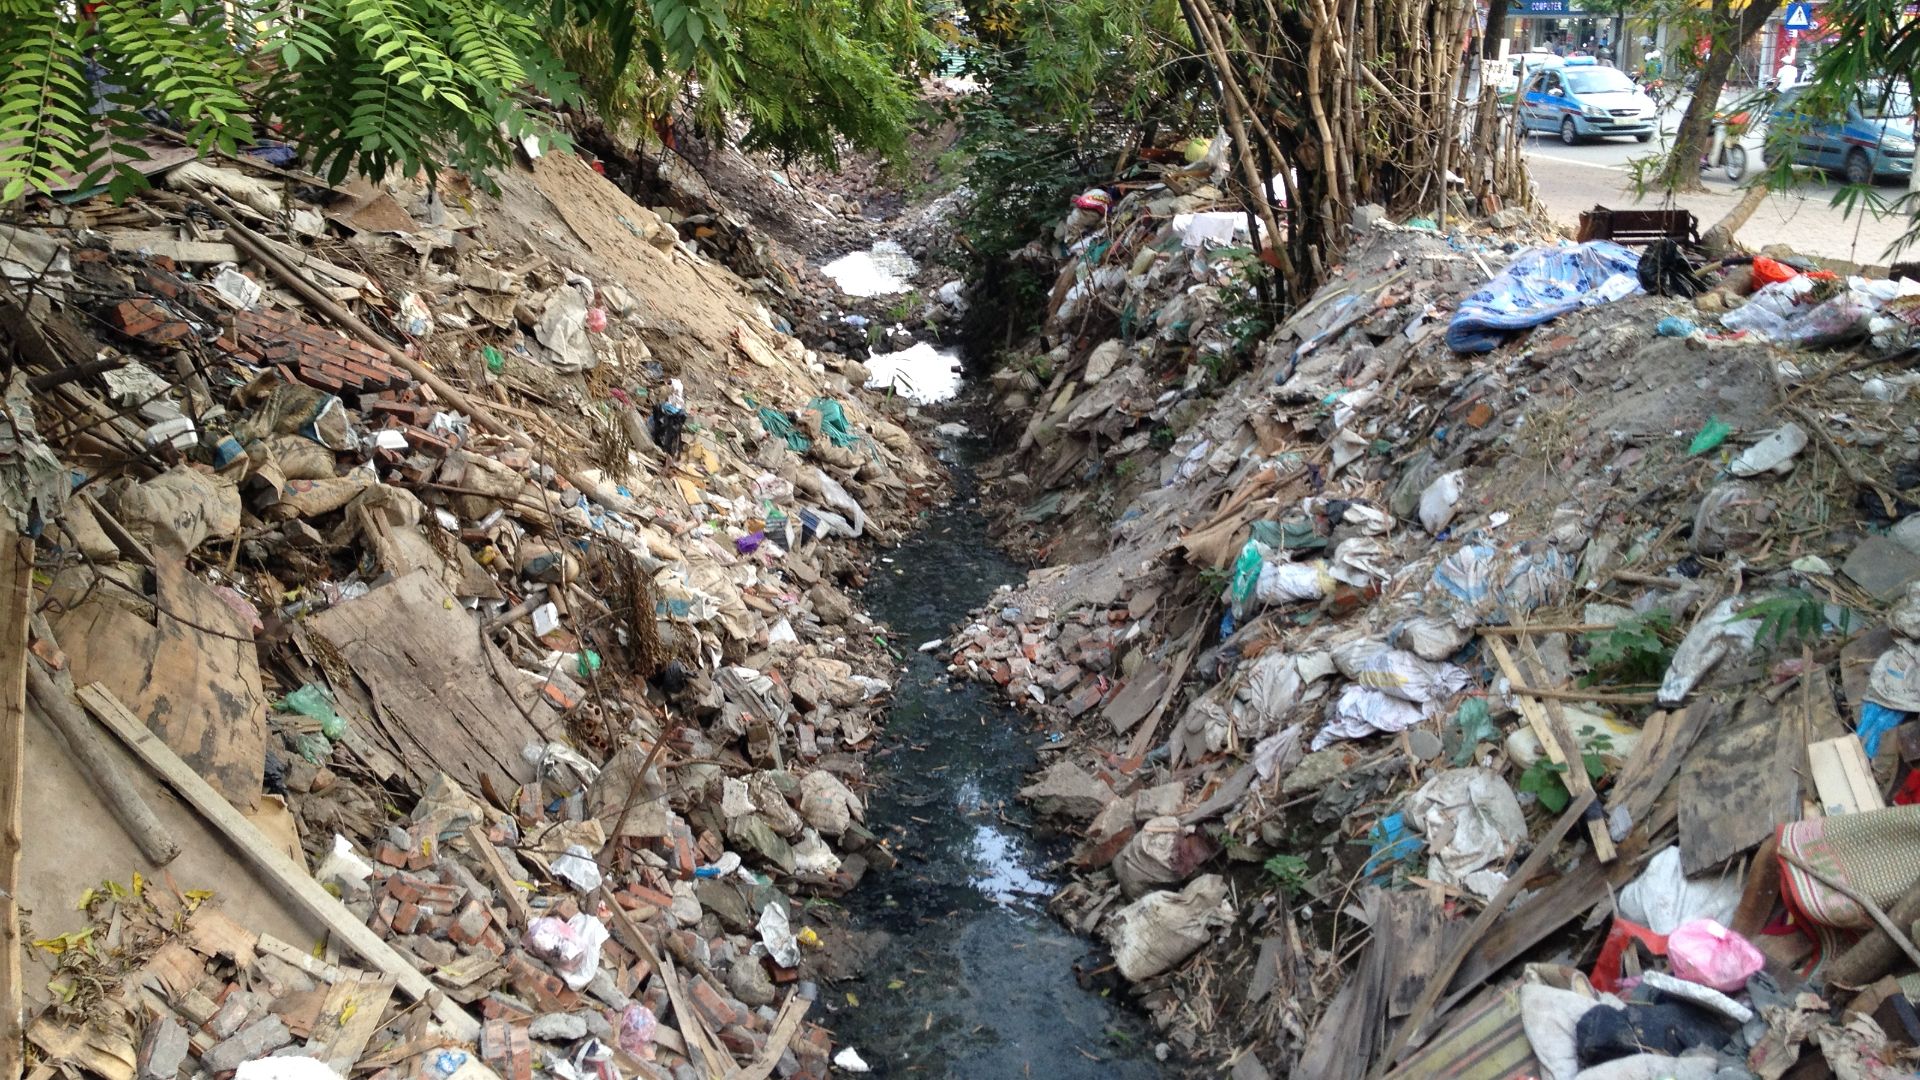 Phan Minh Tuấn, Wikimedia Commons
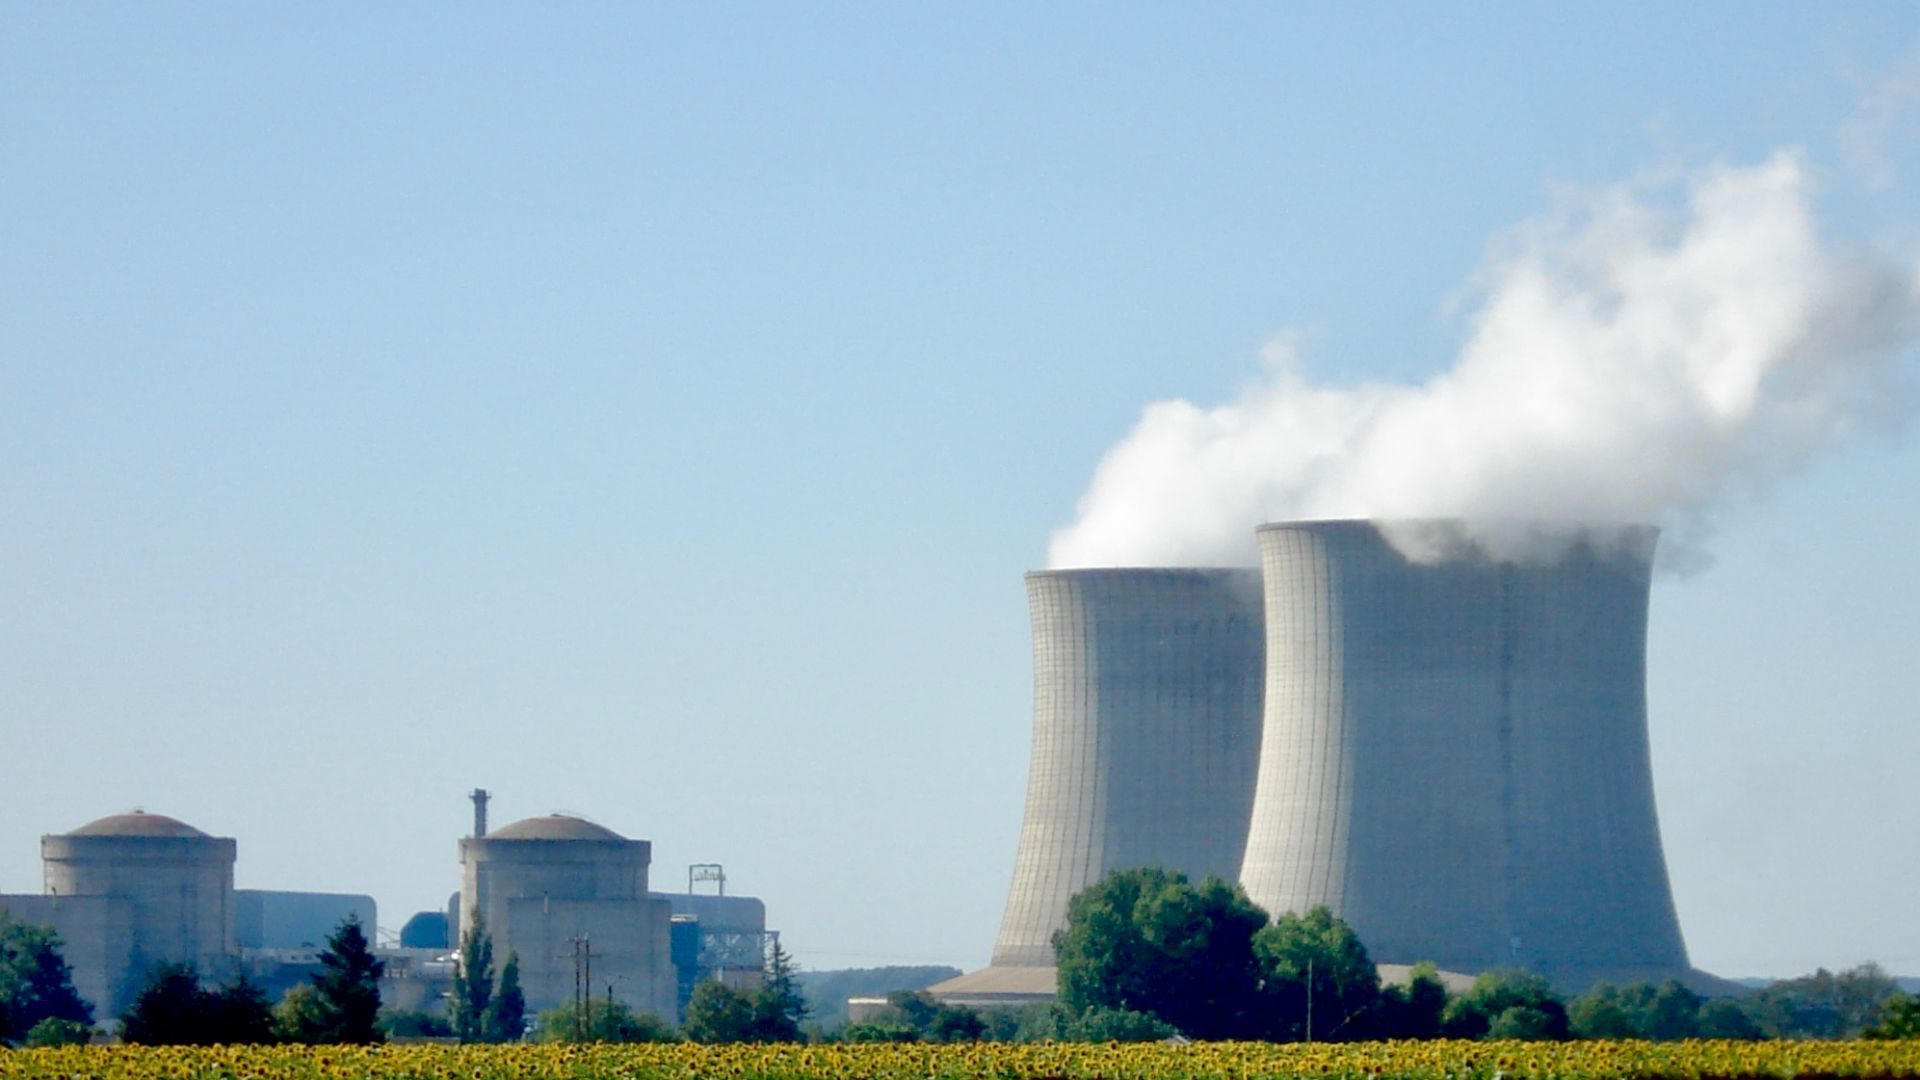
23: France
Planet Damage Score: 26
Total CO₂ emissions: ~310 million metric tons
Per capita CO₂ emissions: ~4.7 metric tons
Deforestation/Land use impact: Limited
Waste/Pollution impact: ~530 kg waste per capita yearly
France’s reliance on nuclear power cuts emissions, but waste generation remains massive.
 T.A.F.K.A.S. at Dutch Wikipedia, Wikimedia Commons
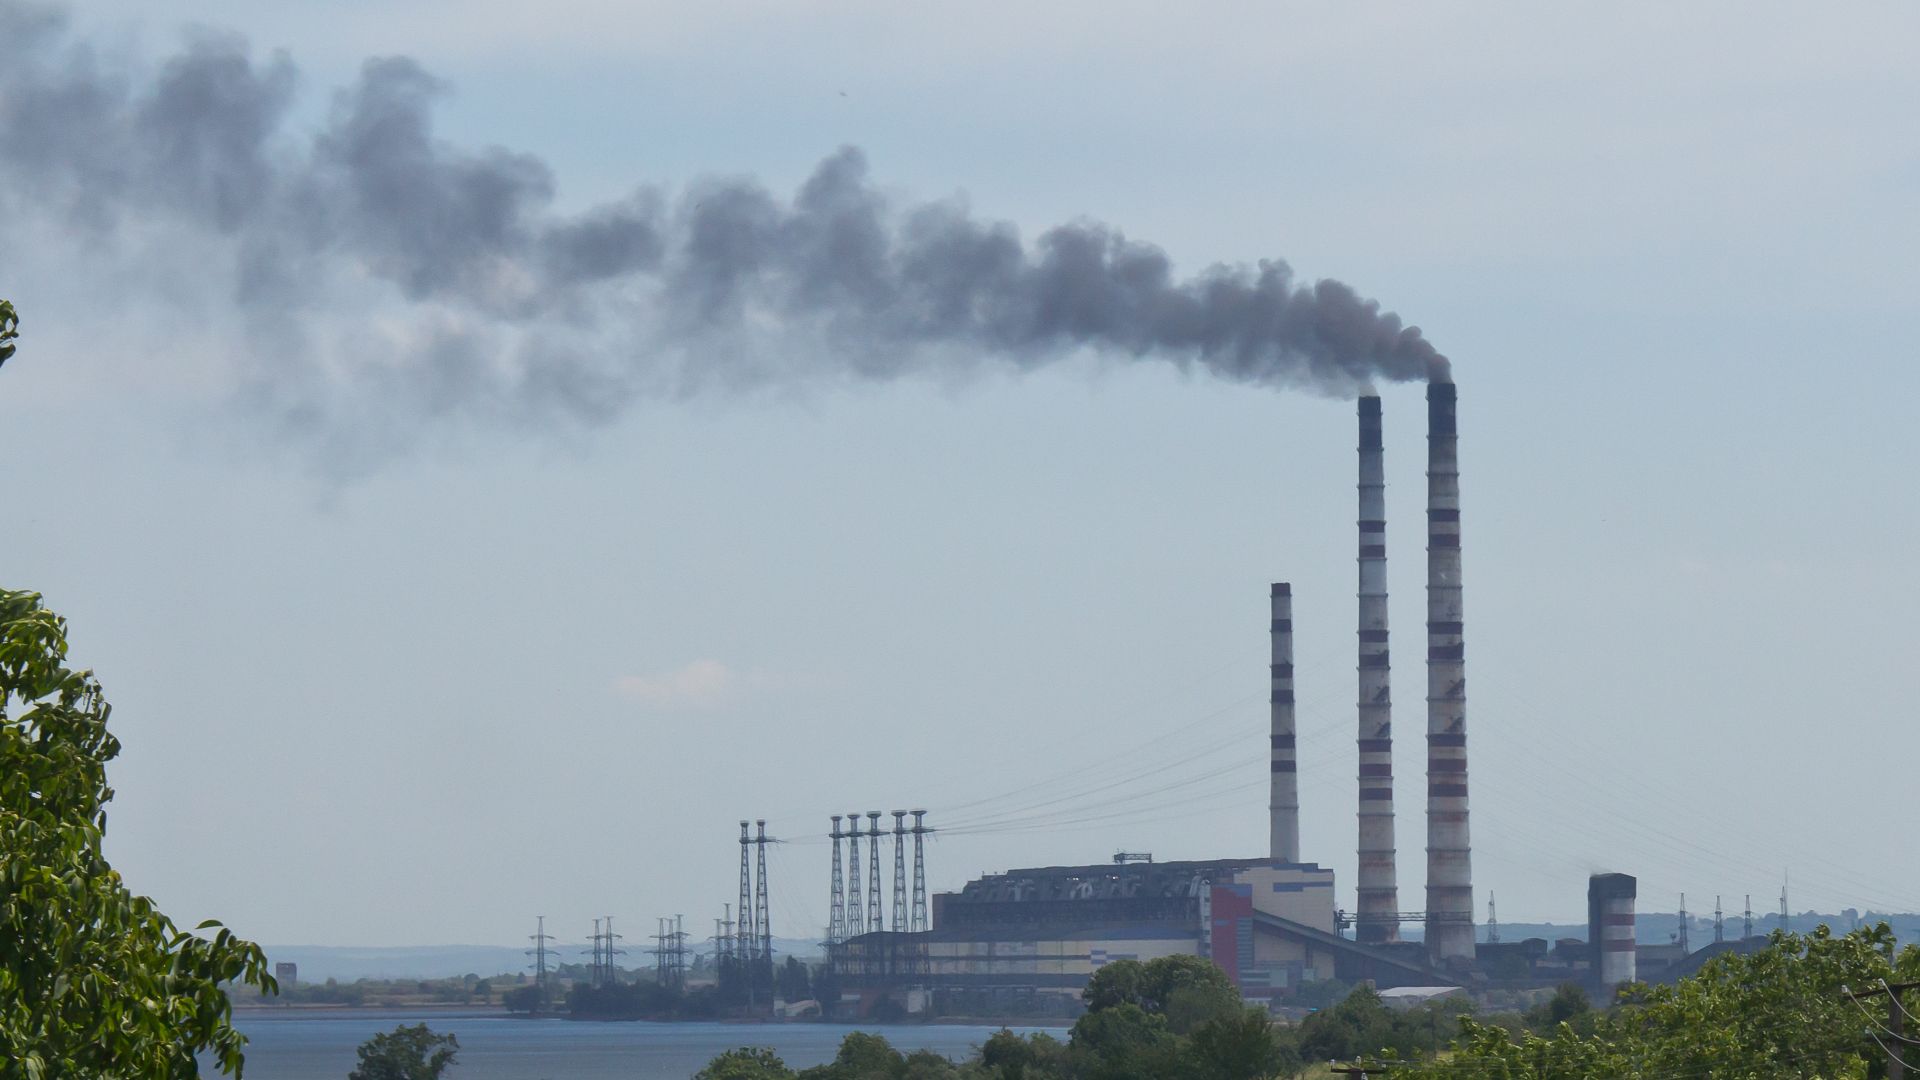
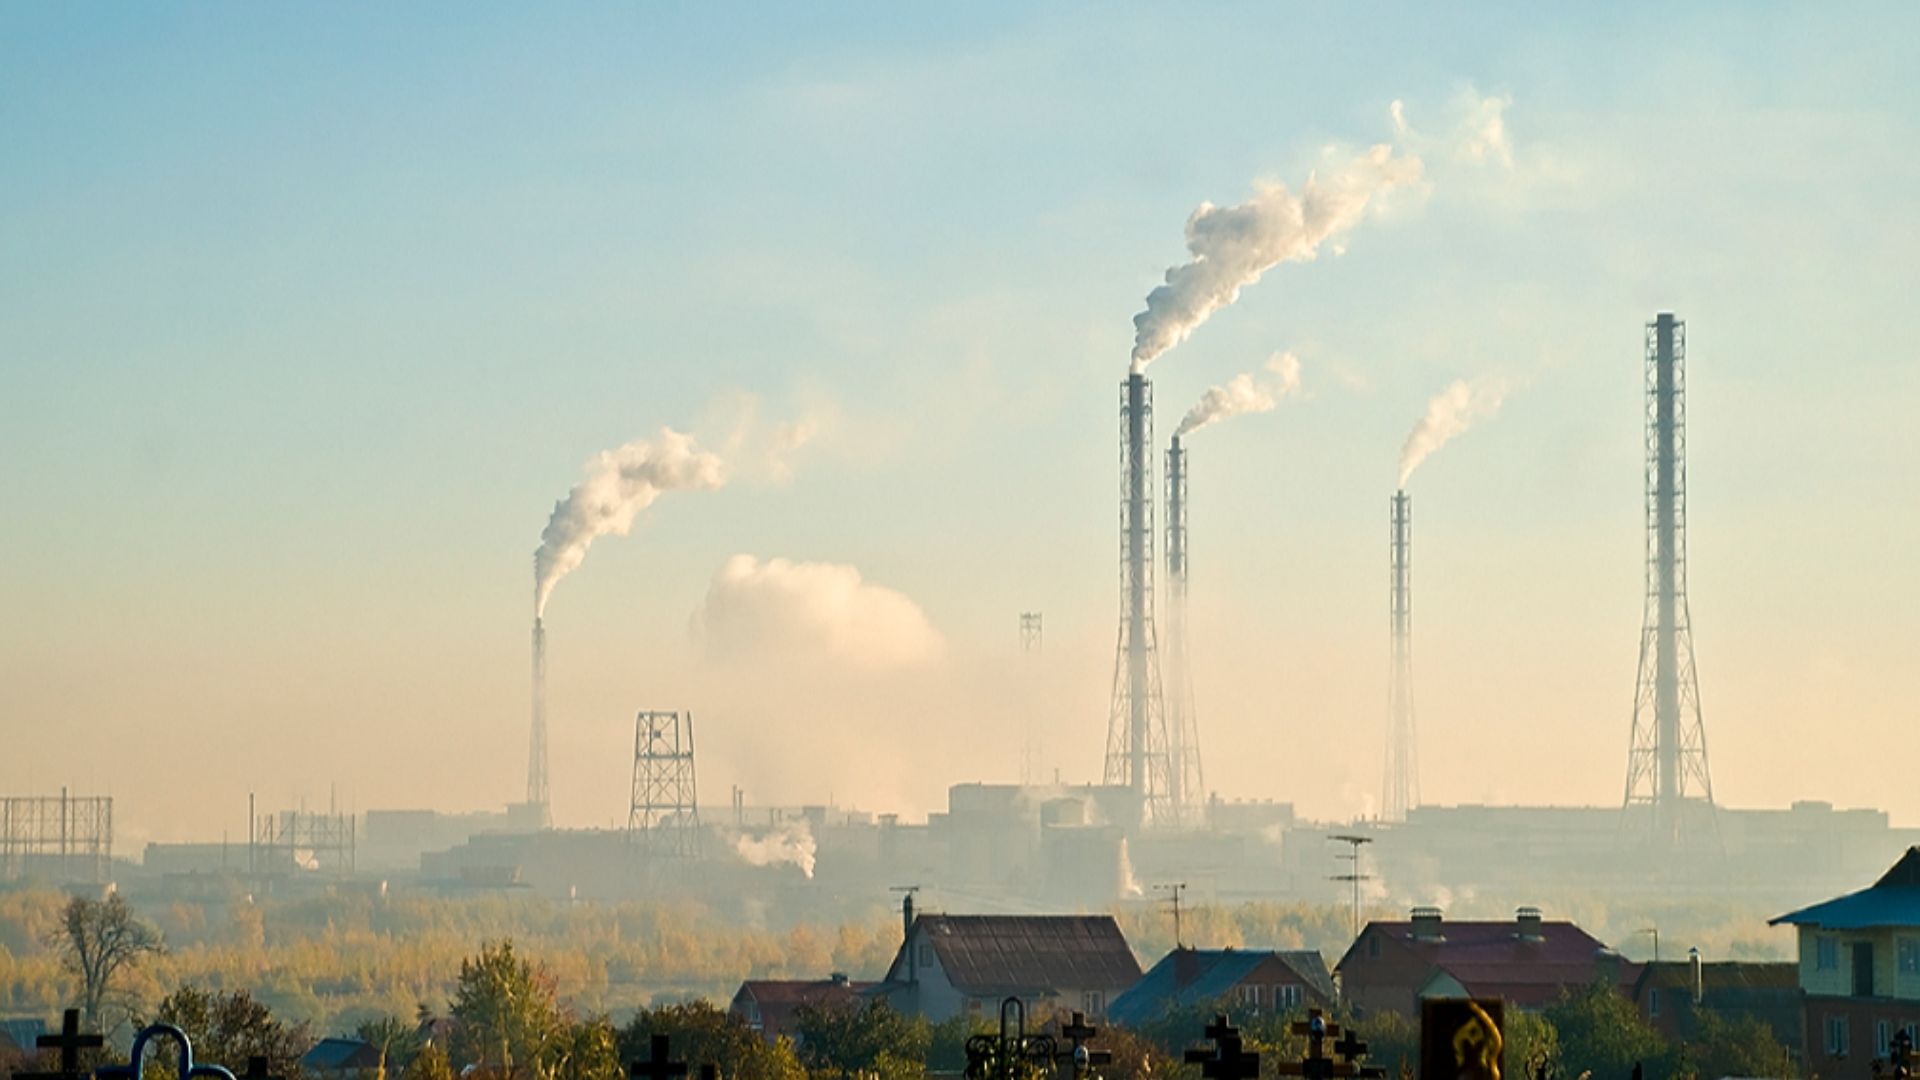
22: Ukraine
Planet Damage Score: 27
Total CO₂ emissions: ~220 million metric tons
Per capita CO₂ emissions: ~5.5 metric tons
Deforestation/Land use impact: Ongoing agricultural pressure
Waste/Pollution impact: Coal-heavy energy, urban smog
Ukraine’s coal reliance and industrial output keep its impact high.
 Raimond Spekking, Wikimedia Commons
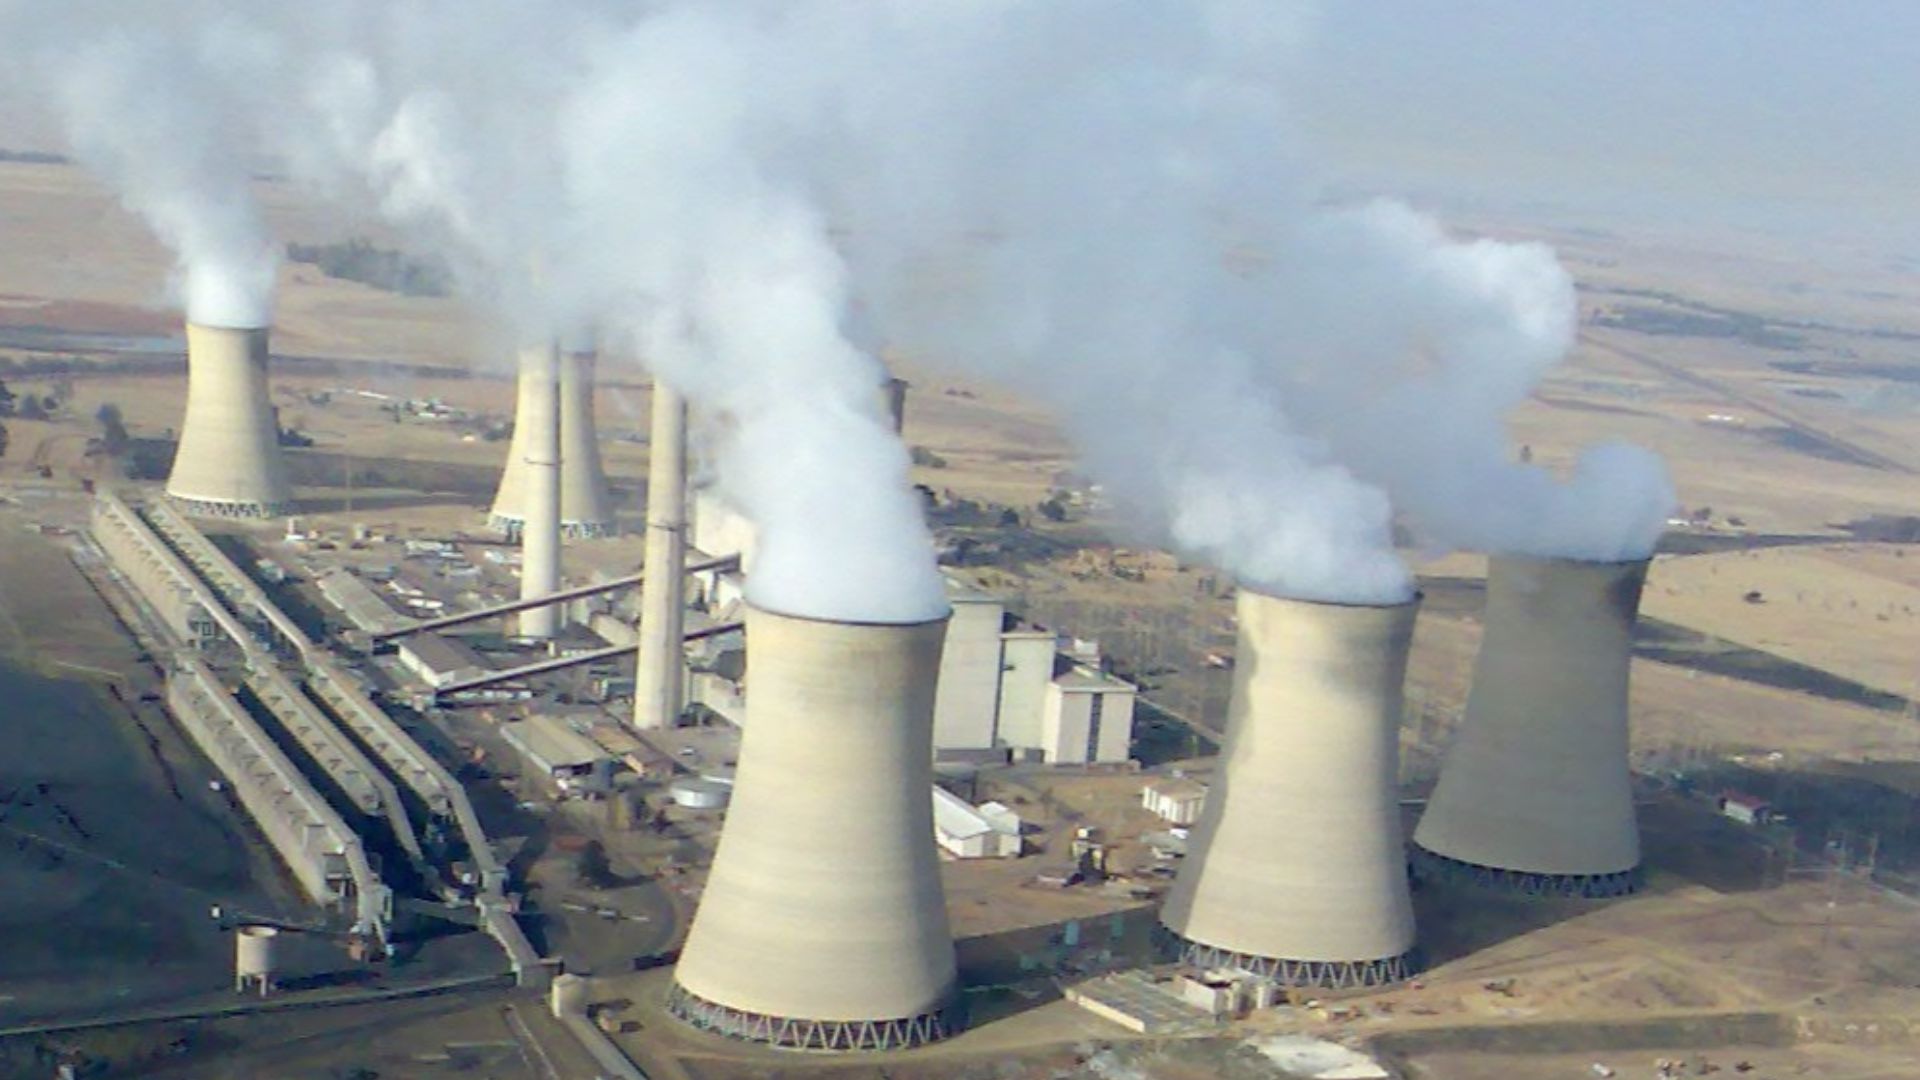
21: South Africa
Planet Damage Score: 29
Total CO₂ emissions: ~440 million metric tons
Per capita CO₂ emissions: ~7.3 metric tons
Deforestation/Land use impact: Mining and agriculture pressure land
Waste/Pollution impact: ~25,000 air pollution deaths annually
Coal-heavy energy keeps South Africa a major global polluter.
 Gerhard Roux , Wikimedia Commons
20: Argentina
Planet Damage Score: 29
Total CO₂ emissions: ~190 million metric tons
Per capita CO₂ emissions: ~4.2 metric tons
Deforestation/Land use impact: ~300,000 hectares lost annually
Waste/Pollution impact: Methane-heavy cattle ranching
Argentina’s beef economy fuels both methane and deforestation impacts.
 Peer V (Julio Pantoja), Wikimedia Commons
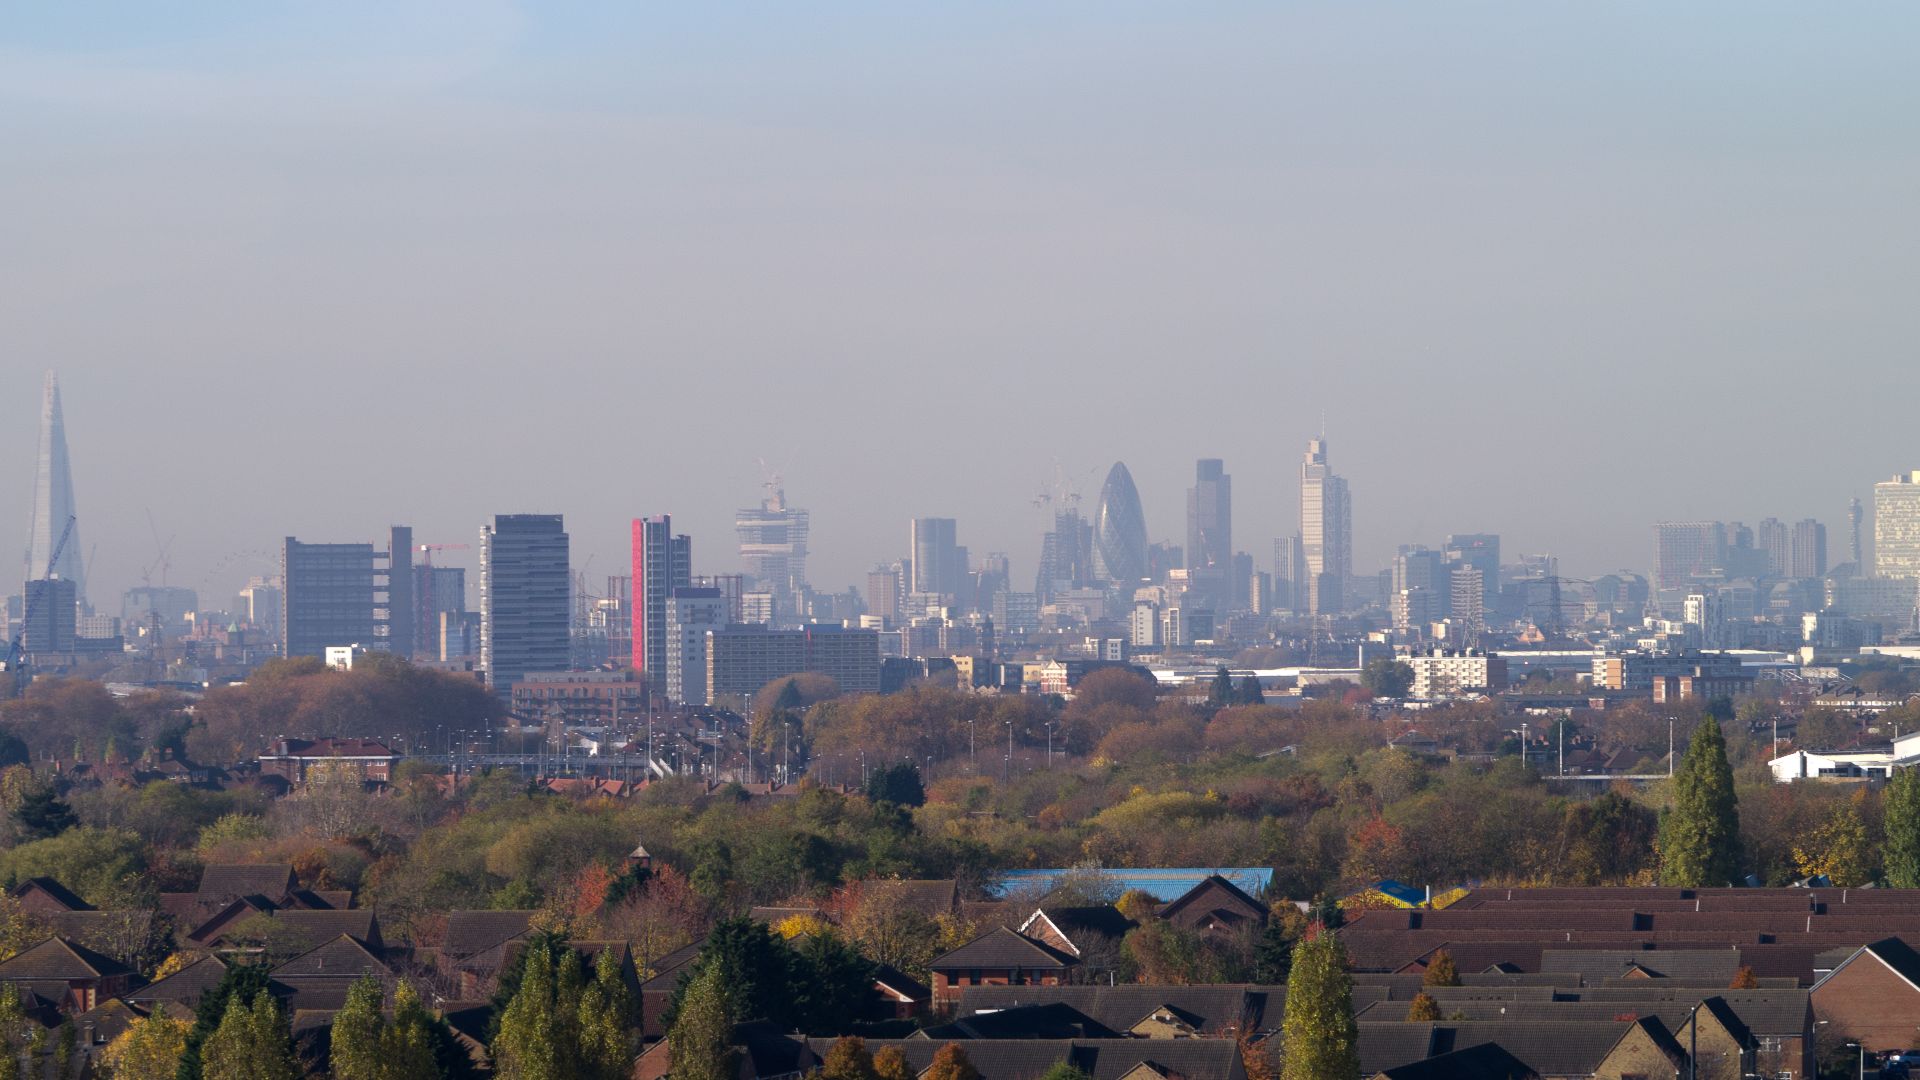
19: United Kingdom
Planet Damage Score: 29
Total CO₂ emissions: ~350 million metric tons
Per capita CO₂ emissions: ~5.3 metric tons
Deforestation/Land use impact: Minimal
Waste/Pollution impact: High plastic exports, ~29,000 air pollution deaths
The UK has cut emissions but still exports its waste burden abroad.
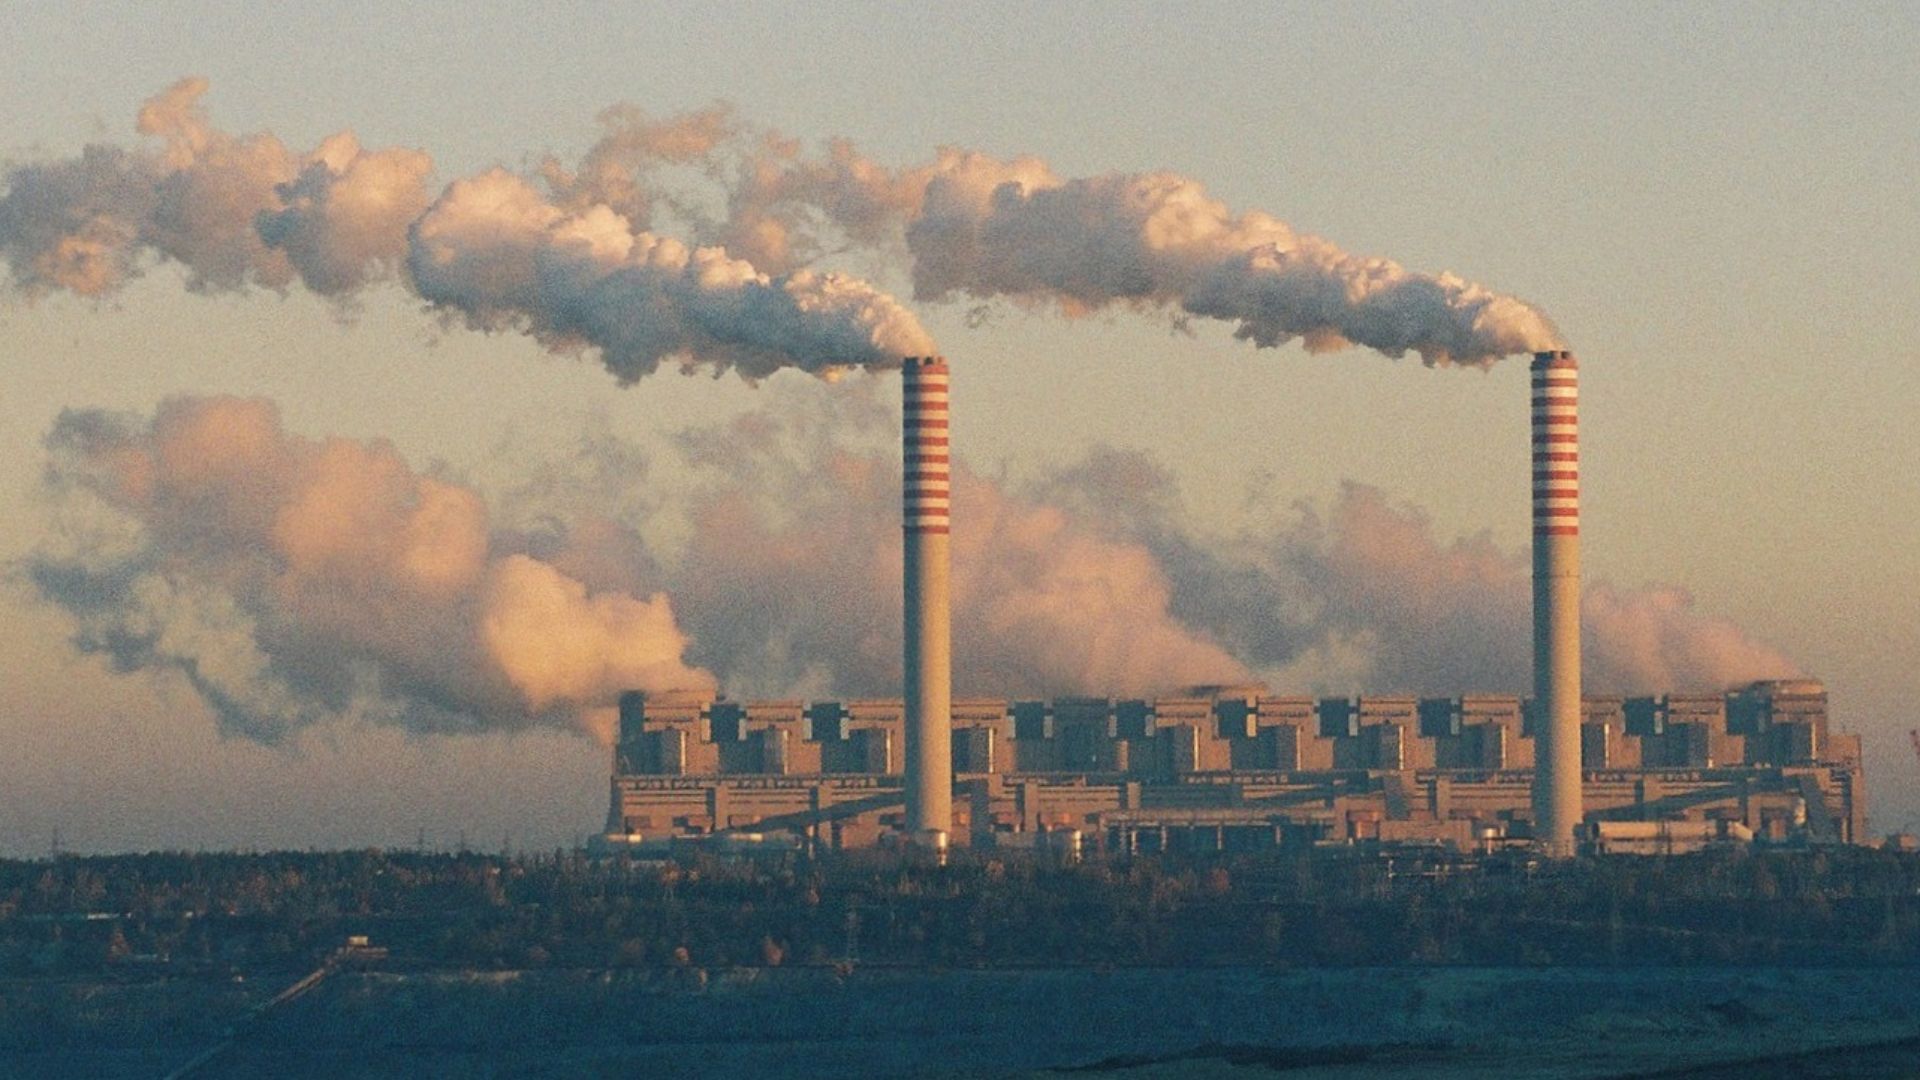
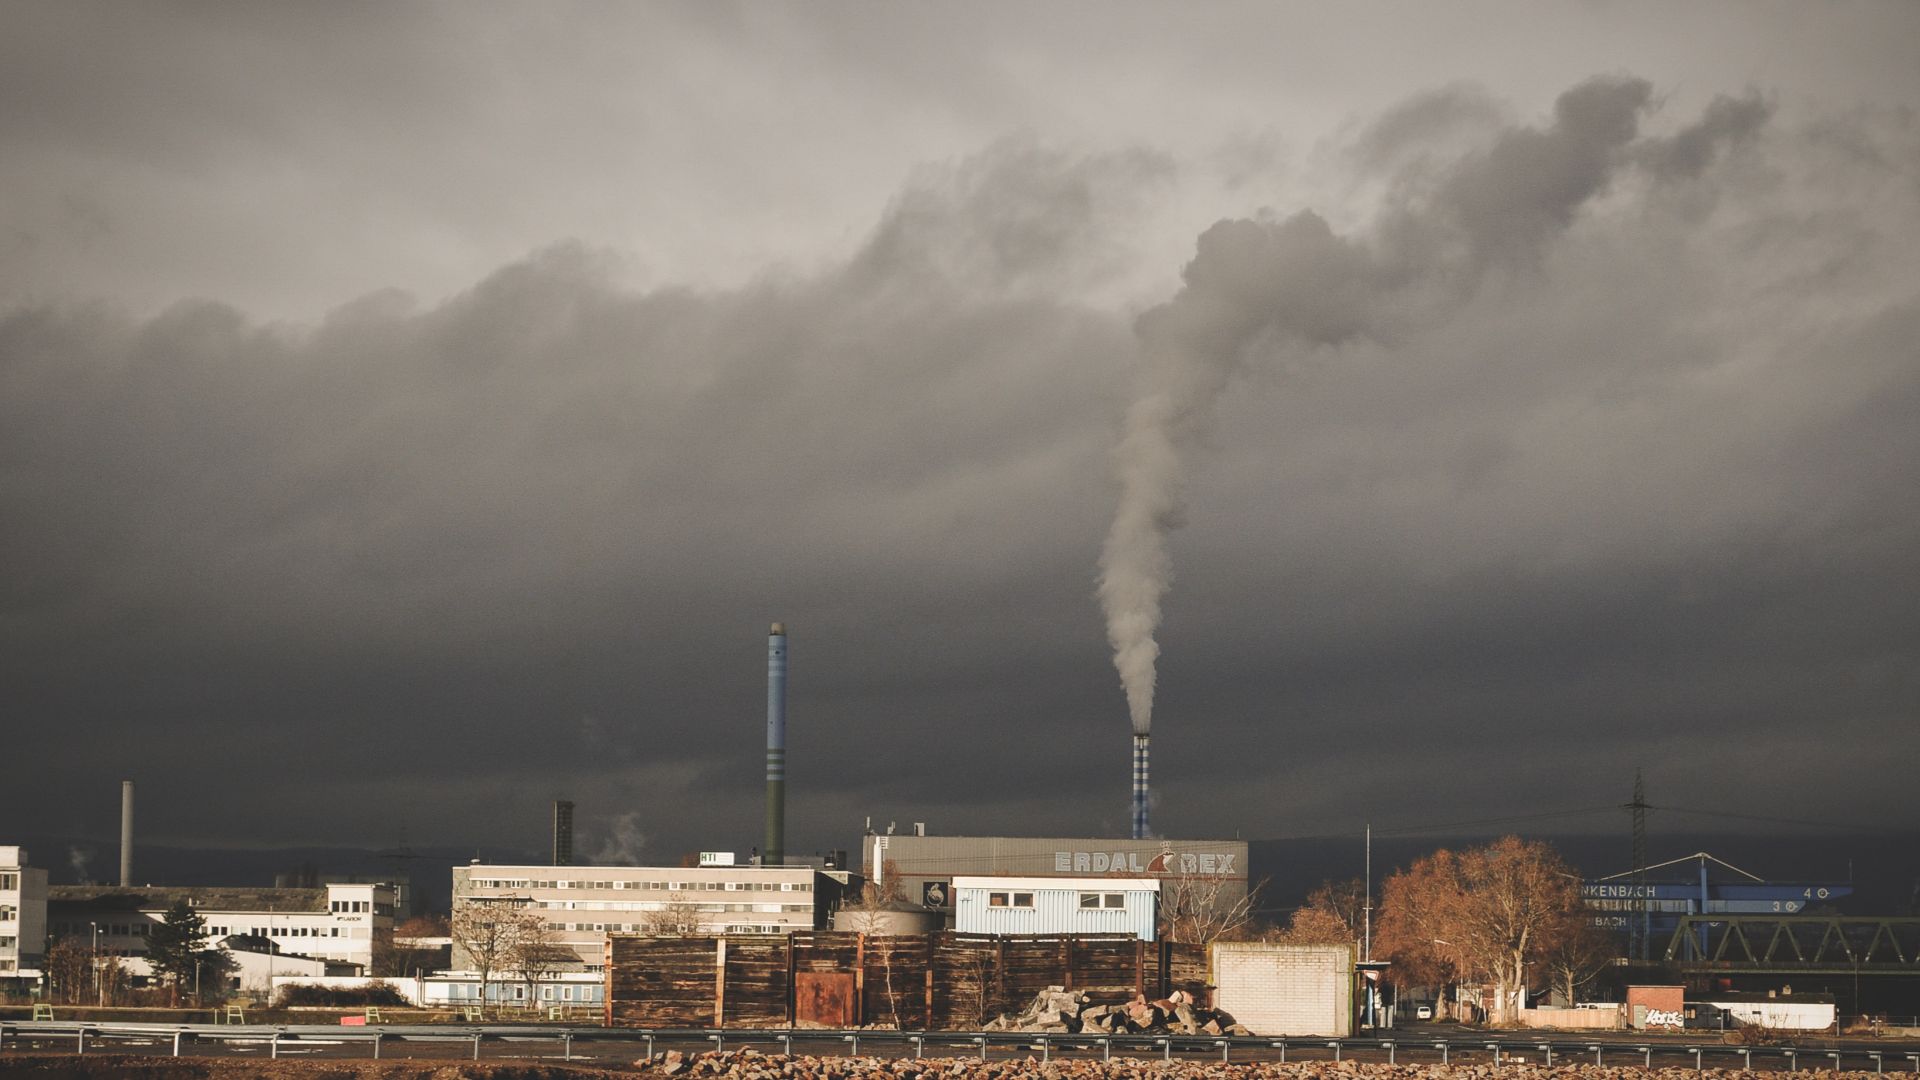
18: Poland
Planet Damage Score: 31
Total CO₂ emissions: ~300 million metric tons
Per capita CO₂ emissions: ~7.9 metric tons
Deforestation/Land use impact: Coal-driven land degradation
Waste/Pollution impact: Heavy reliance on fossil fuels
Poland’s coal dependence keeps its impact disproportionately high in Europe.
 Petr Štefek, Wikimedia Commons
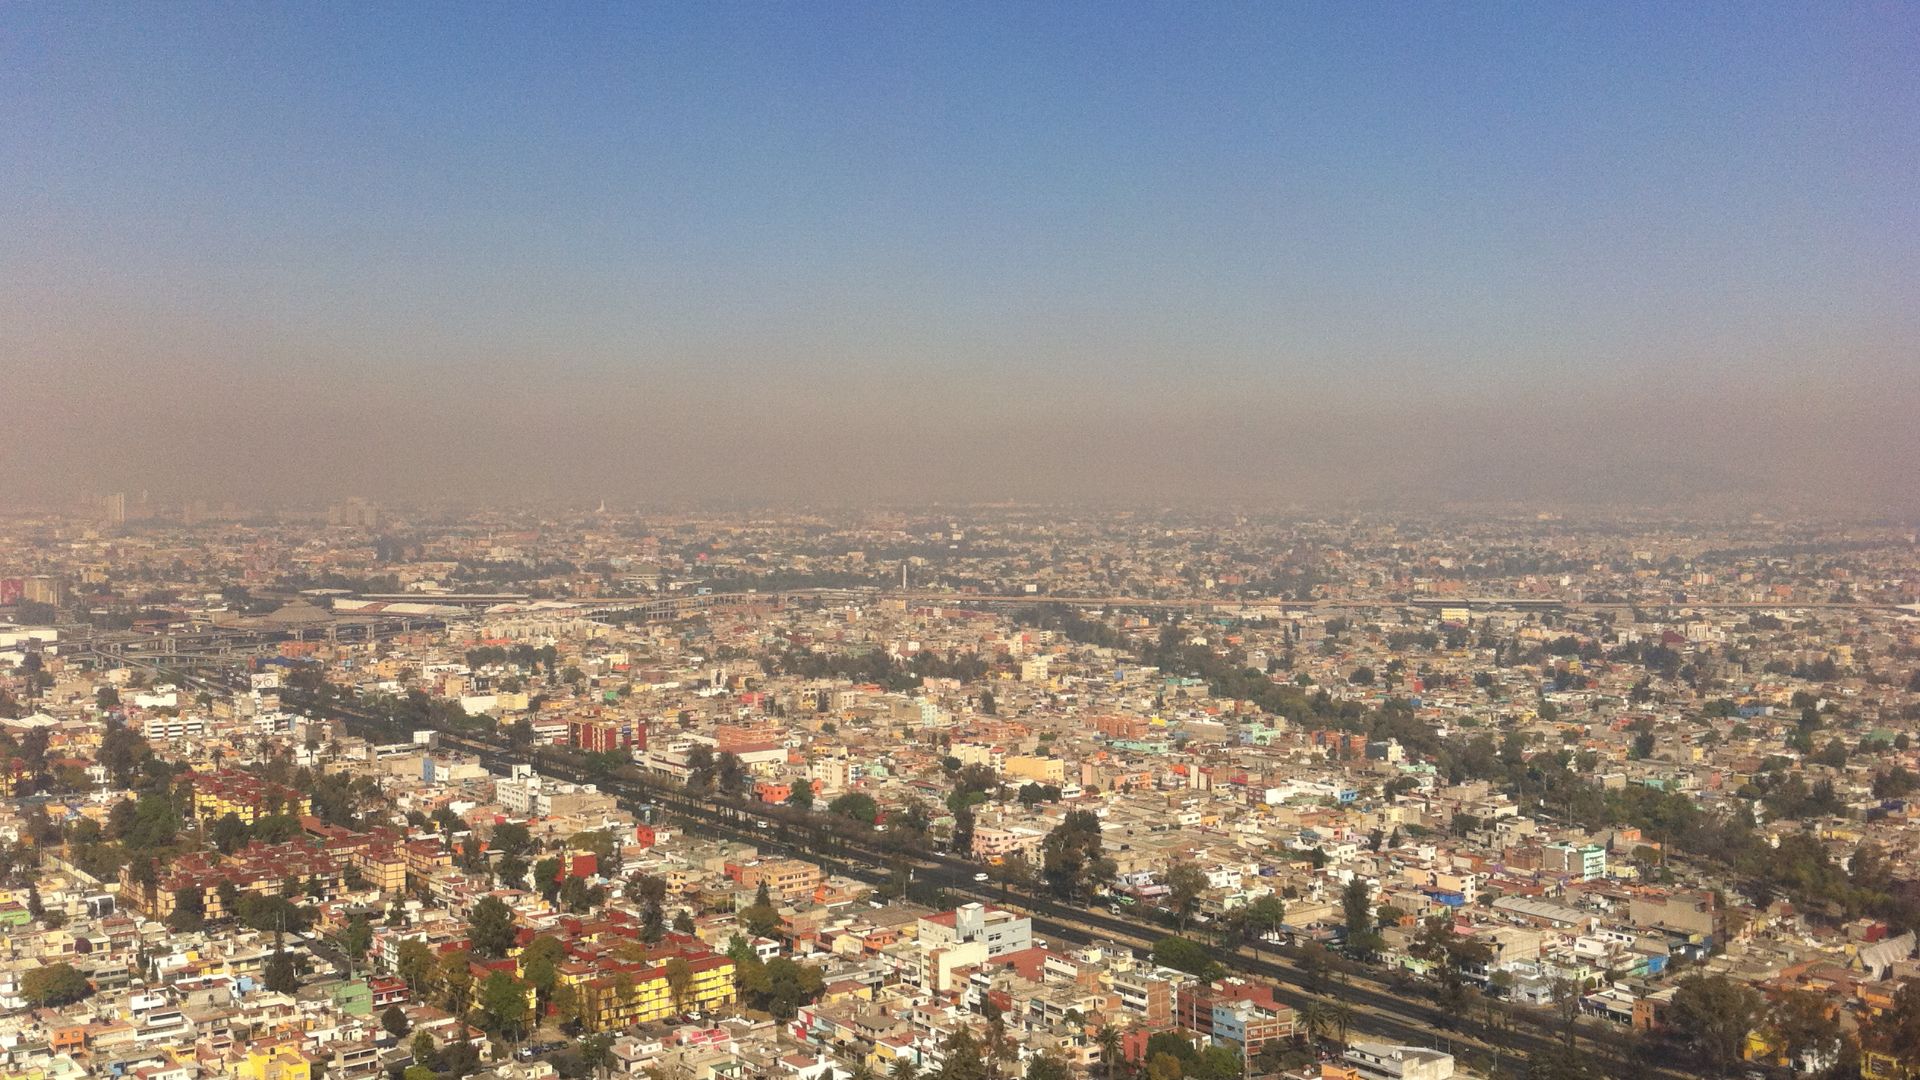
17: Mexico
Planet Damage Score: 31
Total CO₂ emissions: ~470 million metric tons
Per capita CO₂ emissions: ~3.8 metric tons
Deforestation/Land use impact: ~0.6% annual forest loss
Waste/Pollution impact: ~42 million tons waste yearly
Urban waste and land conversion keep Mexico in the top 20.
 Creator:Fidel Gonzalez, Wikimedia Commons
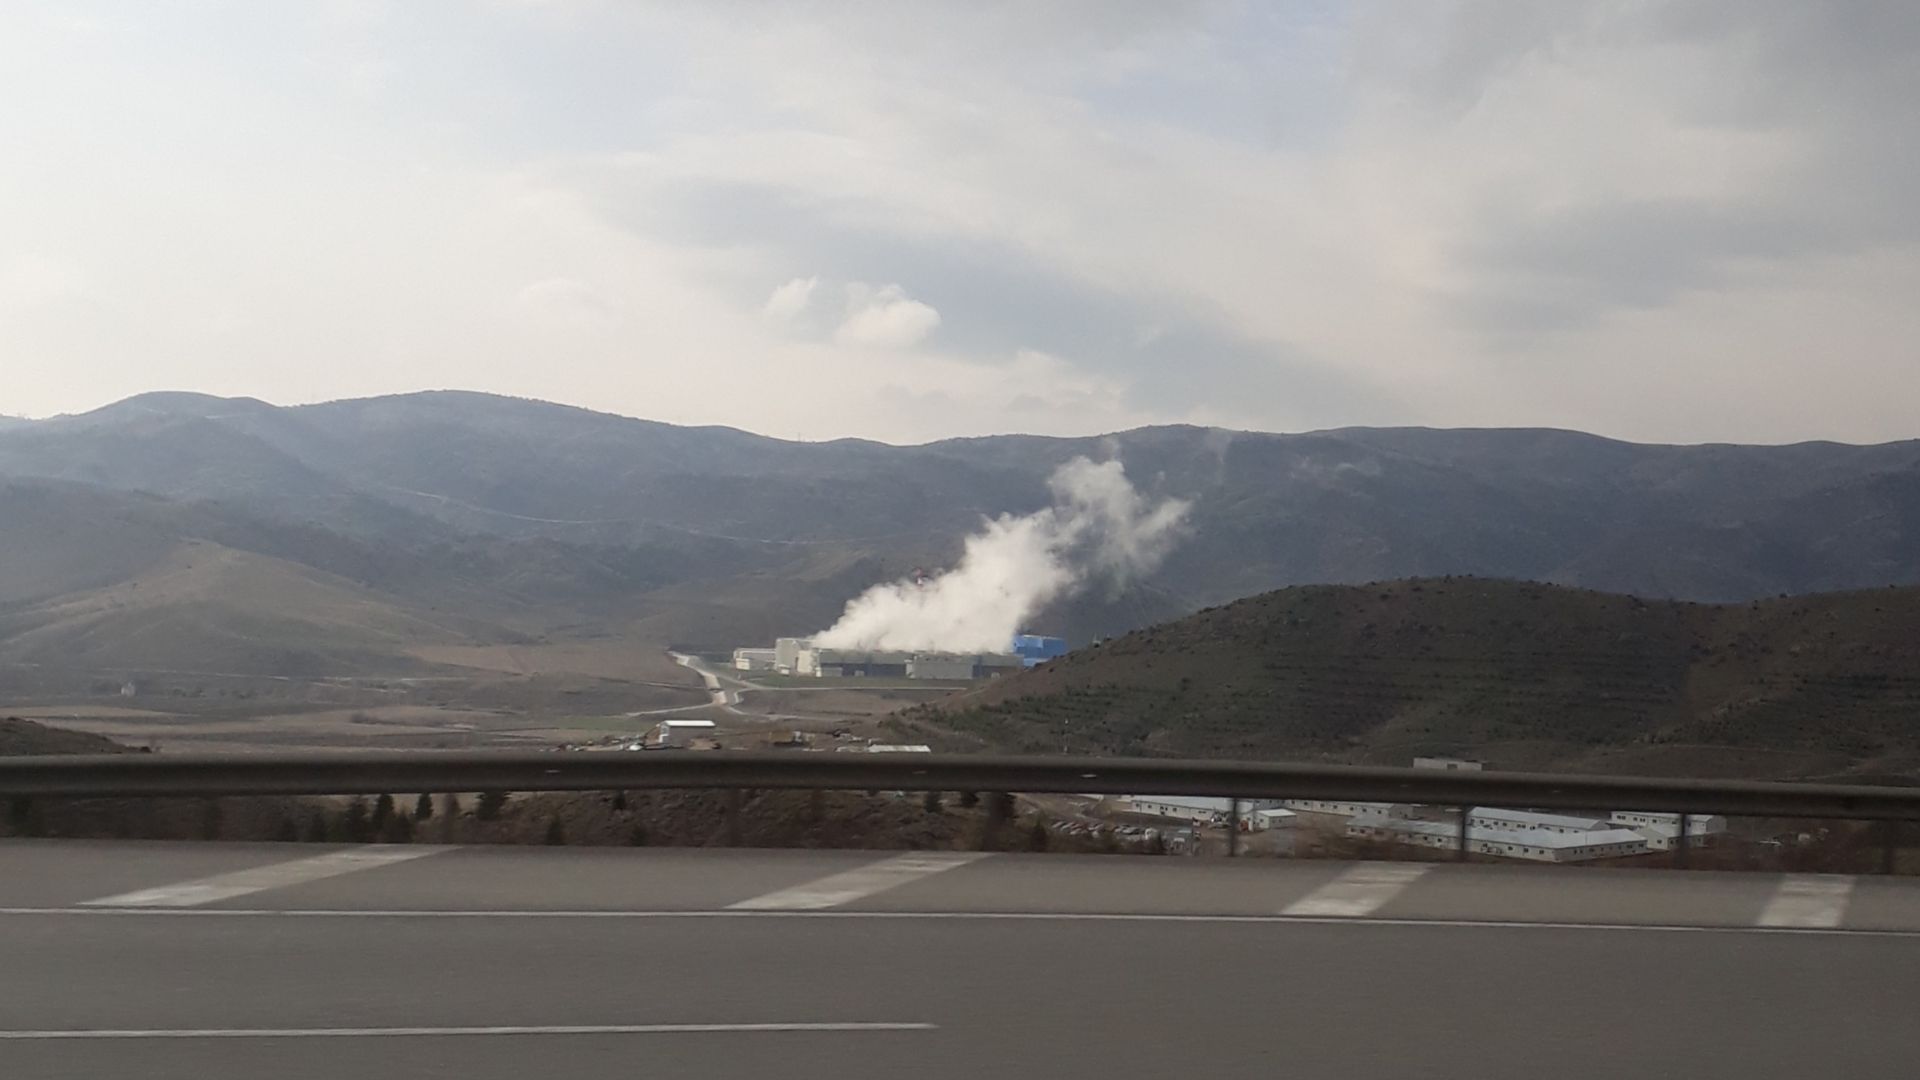
16: Turkey
Planet Damage Score: 31
Total CO₂ emissions: ~430 million metric tons
Per capita CO₂ emissions: ~5.2 metric tons
Deforestation/Land use impact: ~2.1% forest loss annually
Waste/Pollution impact: Fossil-fuel-heavy energy sector
Turkey’s fossil dependence and deforestation give it a major environmental toll.
15: Pakistan
Planet Damage Score: 32
Total CO₂ emissions: ~250 million metric tons
Per capita CO₂ emissions: ~1.1 metric tons
Deforestation/Land use impact: ~2.1% annual forest loss
Waste/Pollution impact: ~3 million tons plastic mismanaged yearly
Pakistan’s low per-person emissions are overshadowed by deforestation and poor waste handling.
 Ahmed Iftikhar Sarmad, Wikimedia Commons
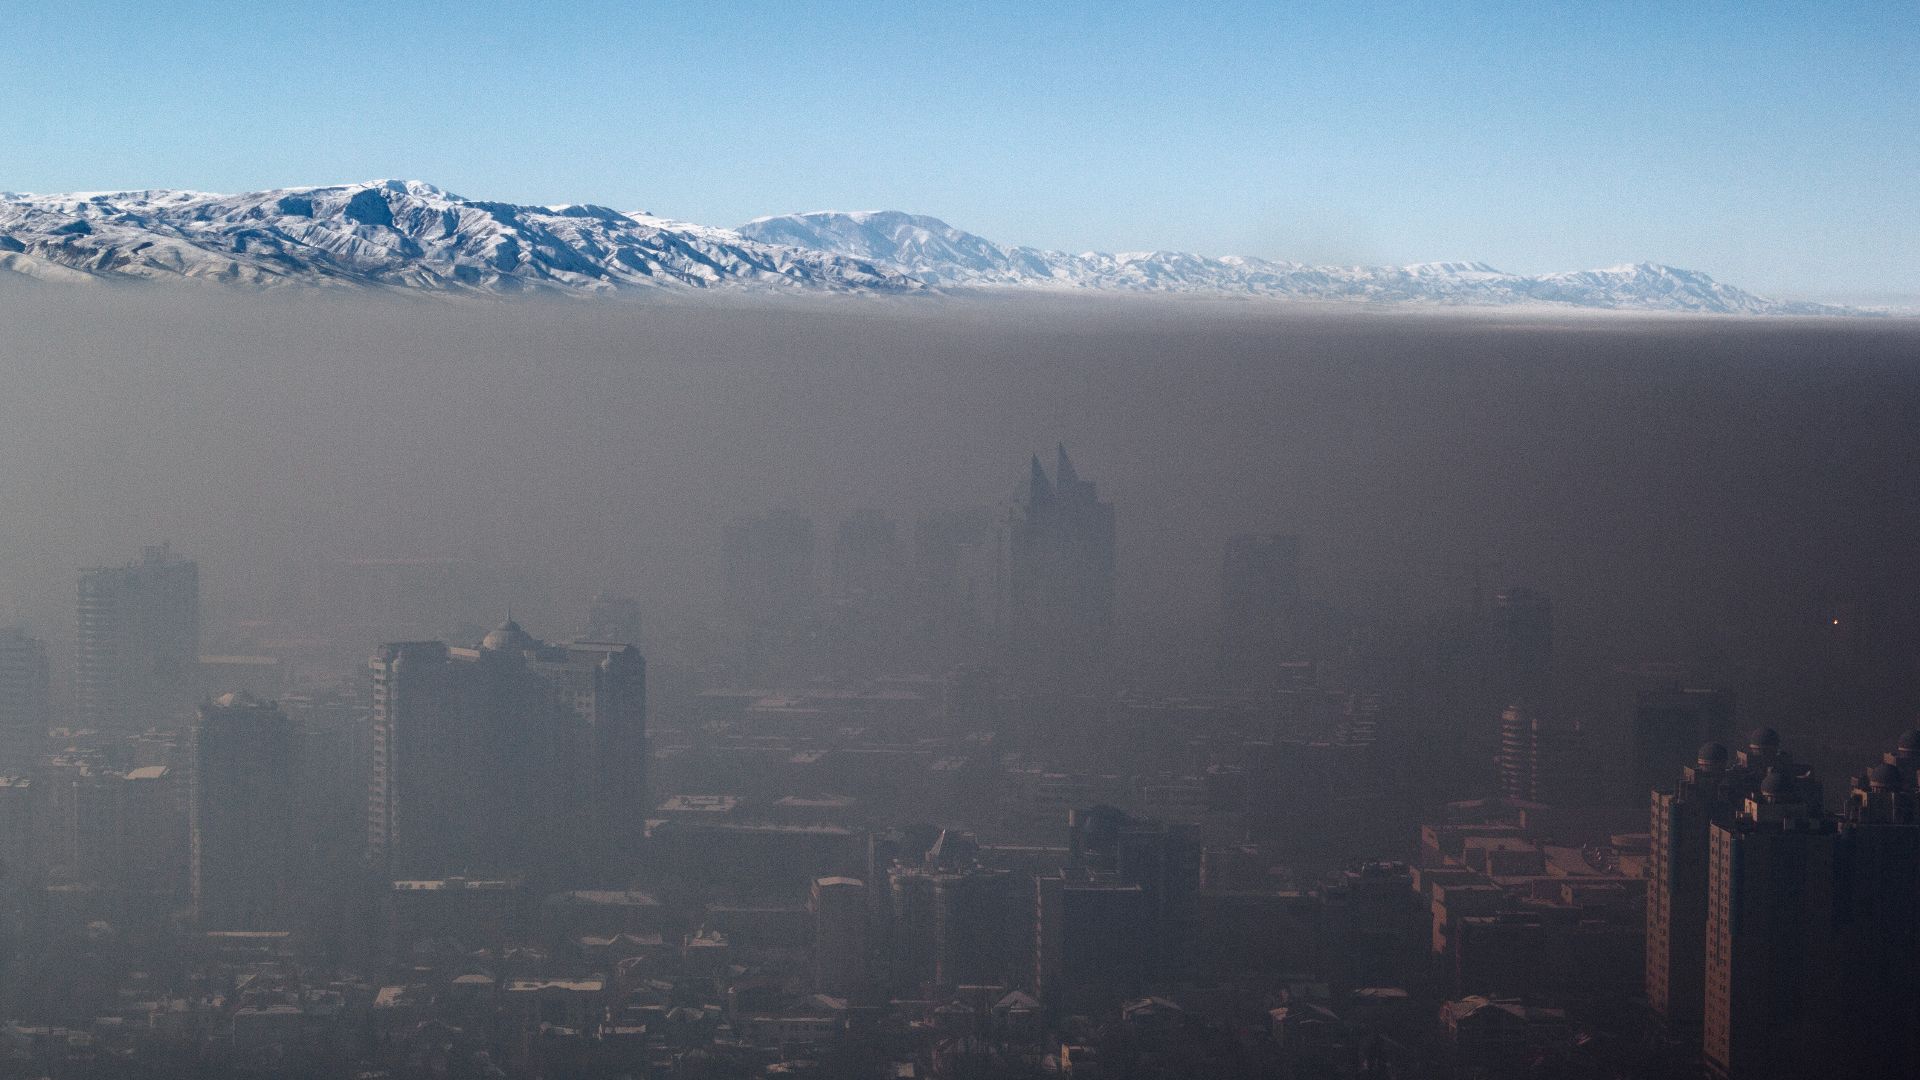
14: Kazakhstan
Planet Damage Score: 32
Total CO₂ emissions: ~300 million metric tons
Per capita CO₂ emissions: ~16 metric tons
Deforestation/Land use impact: ~100,000 hectares lost annually
Waste/Pollution impact: Coal-heavy electricity
Kazakhstan’s per-person emissions are among the highest worldwide.
 Igors Jefimovs, Wikimedia Commons
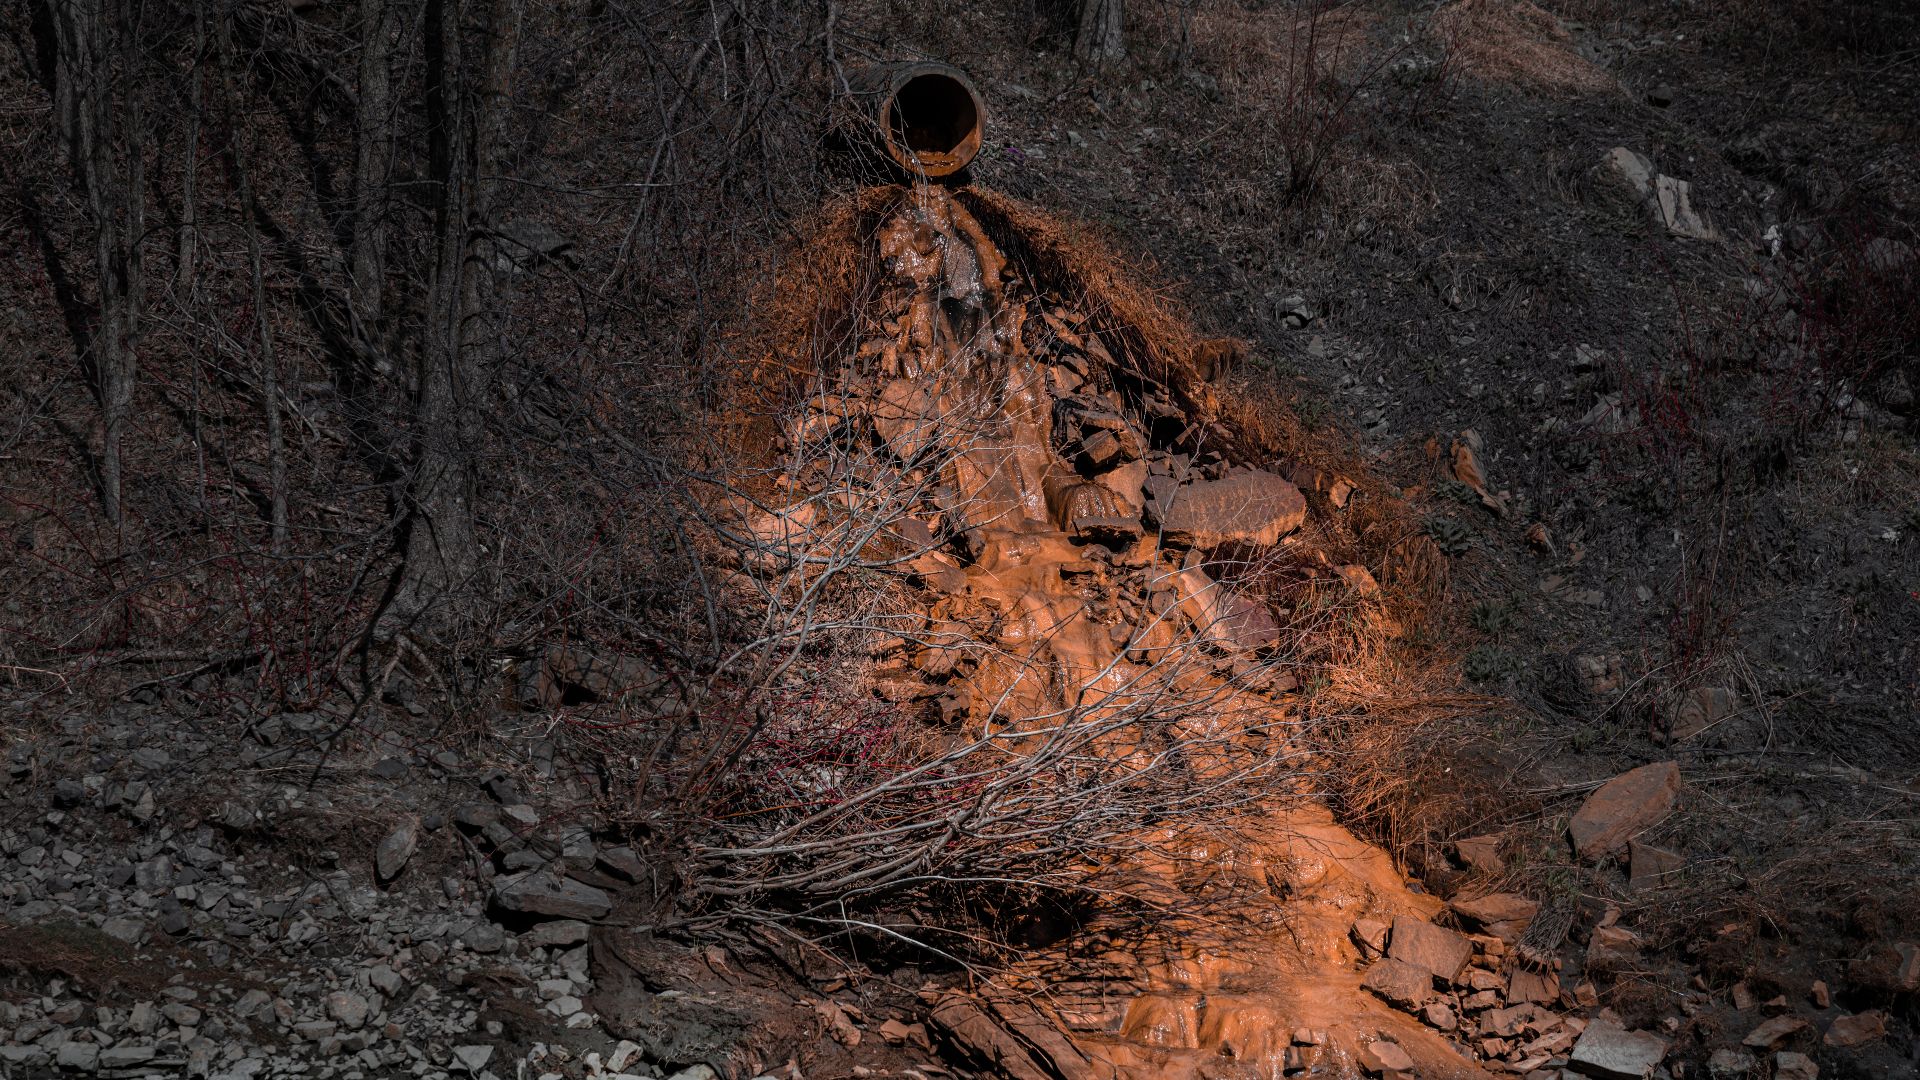
13: Nigeria
Planet Damage Score: 33
Total CO₂ emissions: ~130 million metric tons
Per capita CO₂ emissions: ~0.6 metric tons
Deforestation/Land use impact: ~400,000 hectares lost annually
Waste/Pollution impact: ~7 billion cubic meters gas flared yearly
Nigeria’s oil flaring and deforestation put it among the top offenders.
 Halimatishiaq, Wikimedia Commons
12: Germany
Planet Damage Score: 35
Total CO₂ emissions: ~750 million metric tons
Per capita CO₂ emissions: ~9.1 metric tons
Deforestation/Land use impact: Limited
Waste/Pollution impact: ~1 million tons plastic exports
Germany is Europe’s top polluter, still leaning heavily on coal.
 Brina Blum brina_blum, Wikimedia Commons
11: Canada
Planet Damage Score: 36
Total CO₂ emissions: ~560 million metric tons
Per capita CO₂ emissions: ~15.2 metric tons
Deforestation/Land use impact: ~50,000 hectares lost annually
Waste/Pollution impact: Oil sands emissions, high waste output
Canada’s oil sands make it a disproportionately large polluter.
 Wilfredo Rafael Rodriguez Hernandez, Wikimedia Commons
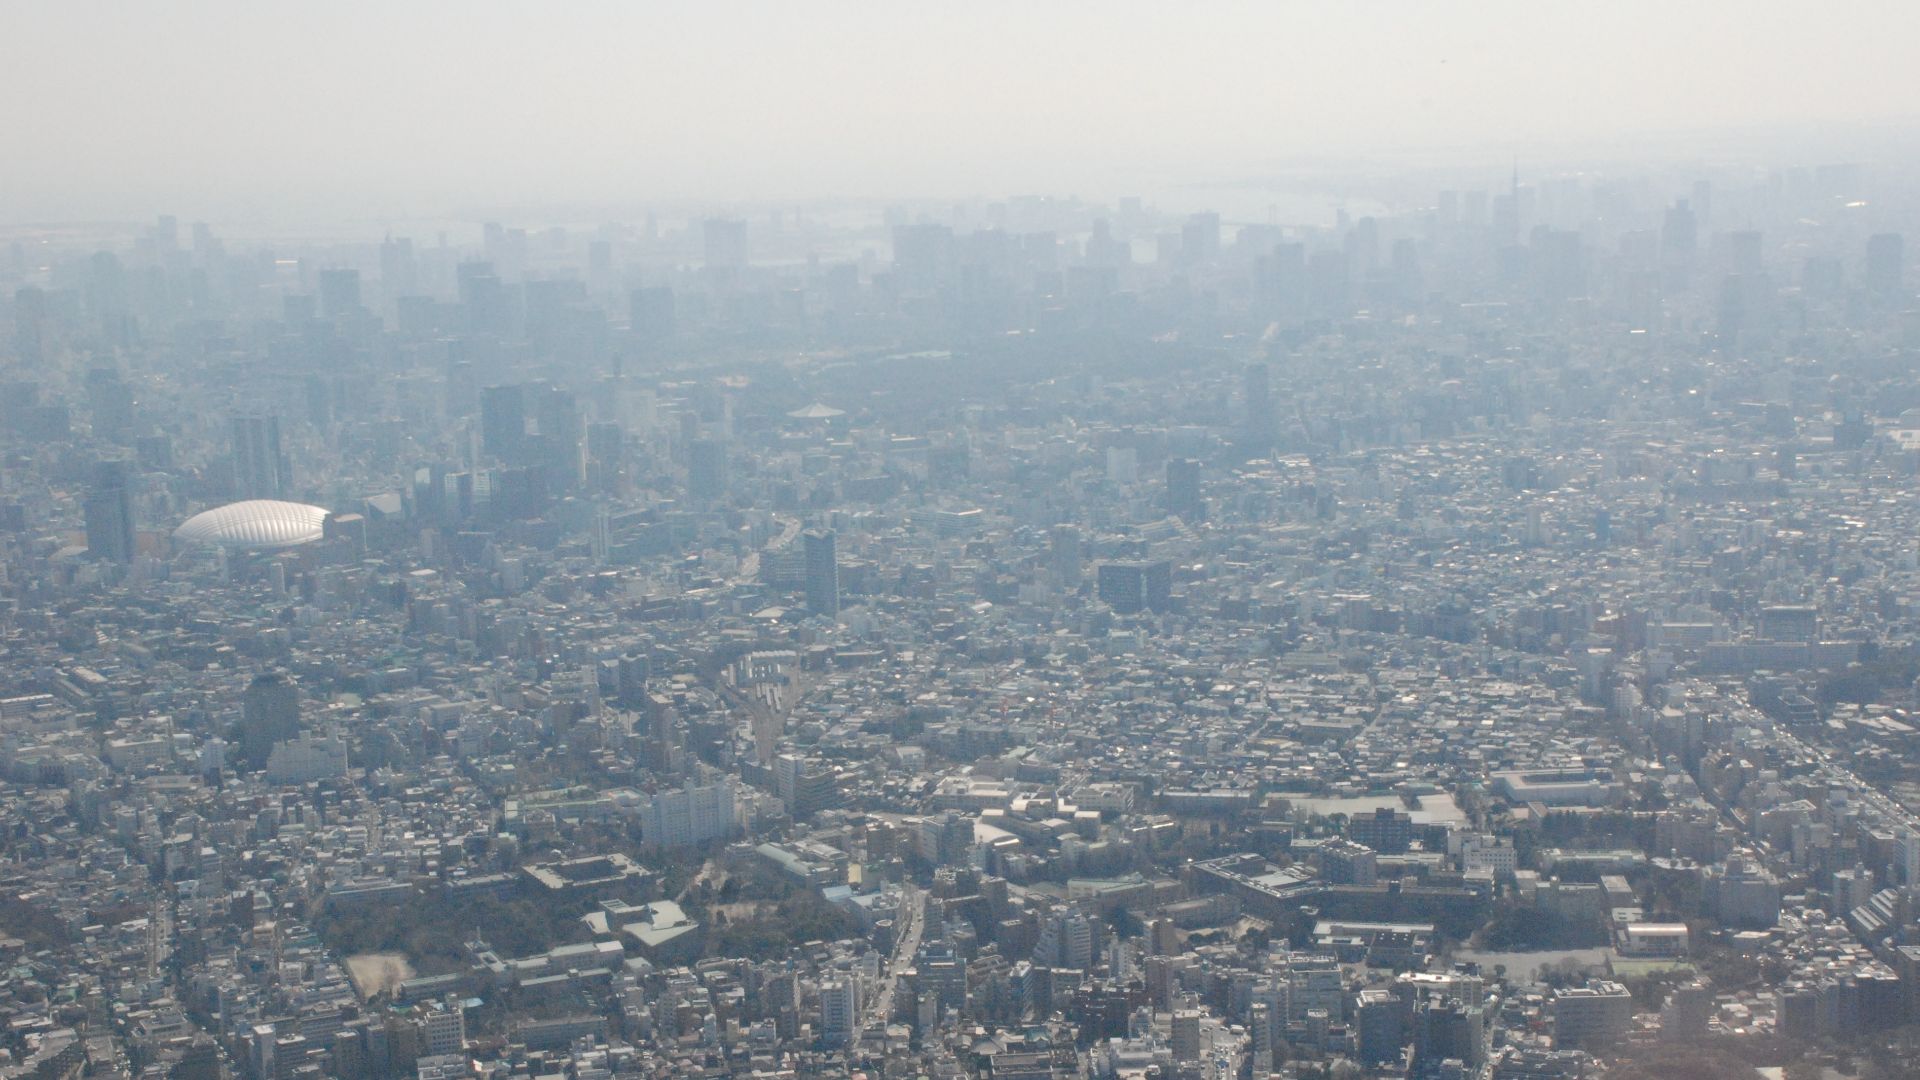
10: Japan
Planet Damage Score: 36
Total CO₂ emissions: ~1,050 million metric tons
Per capita CO₂ emissions: ~8.3 metric tons
Deforestation/Land use impact: Limited
Waste/Pollution impact: ~43 million tons waste yearly
Japan’s fossil fuel imports keep its footprint high despite efficiency.
 Wilhelm Joys Andersen from Oslo, Norway, Wikimedia Commons
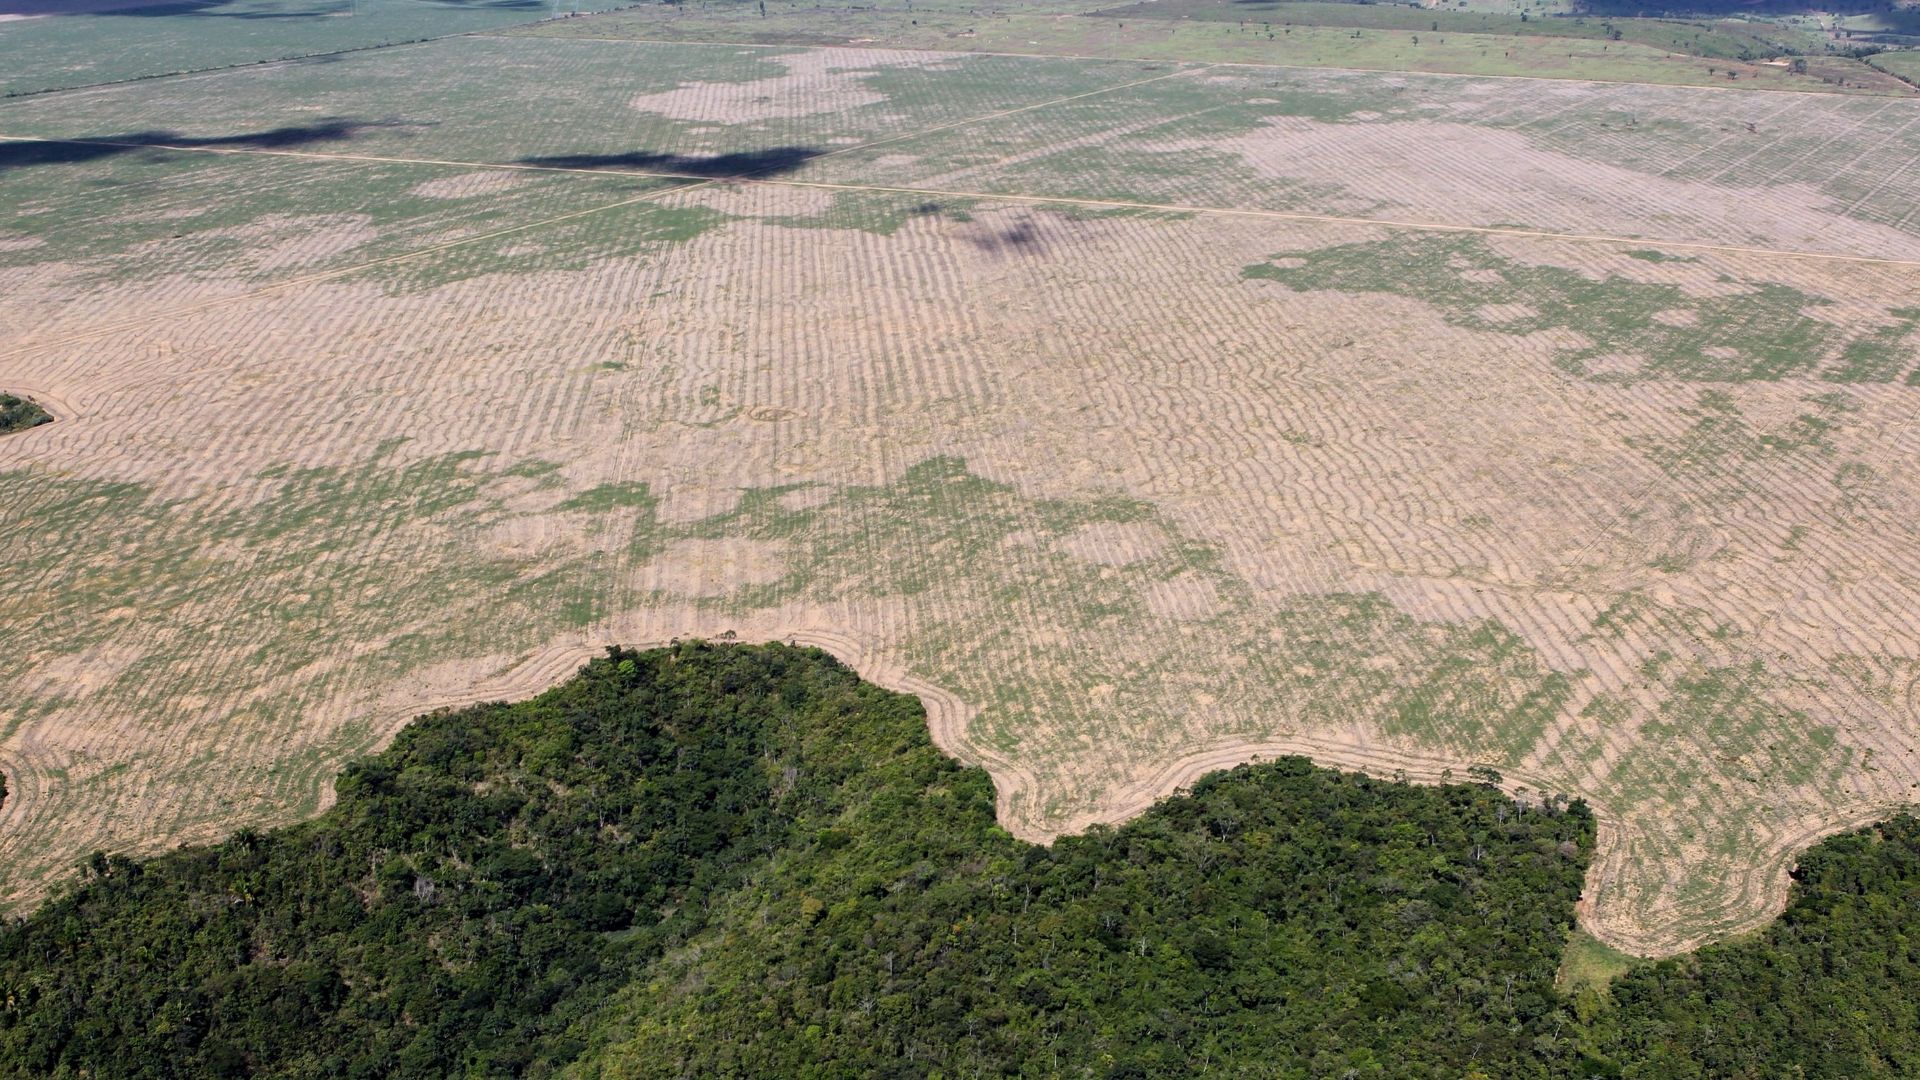
9: Brazil
Planet Damage Score: 37
Total CO₂ emissions: ~480 million metric tons
Per capita CO₂ emissions: ~2.2 metric tons
Deforestation/Land use impact: ~13 million hectares lost since 2000
Waste/Pollution impact: Methane from cattle ranching
Brazil’s Amazon destruction makes it one of the most damaging nations globally.
 Ibama from Brasil, Wikimedia Commons
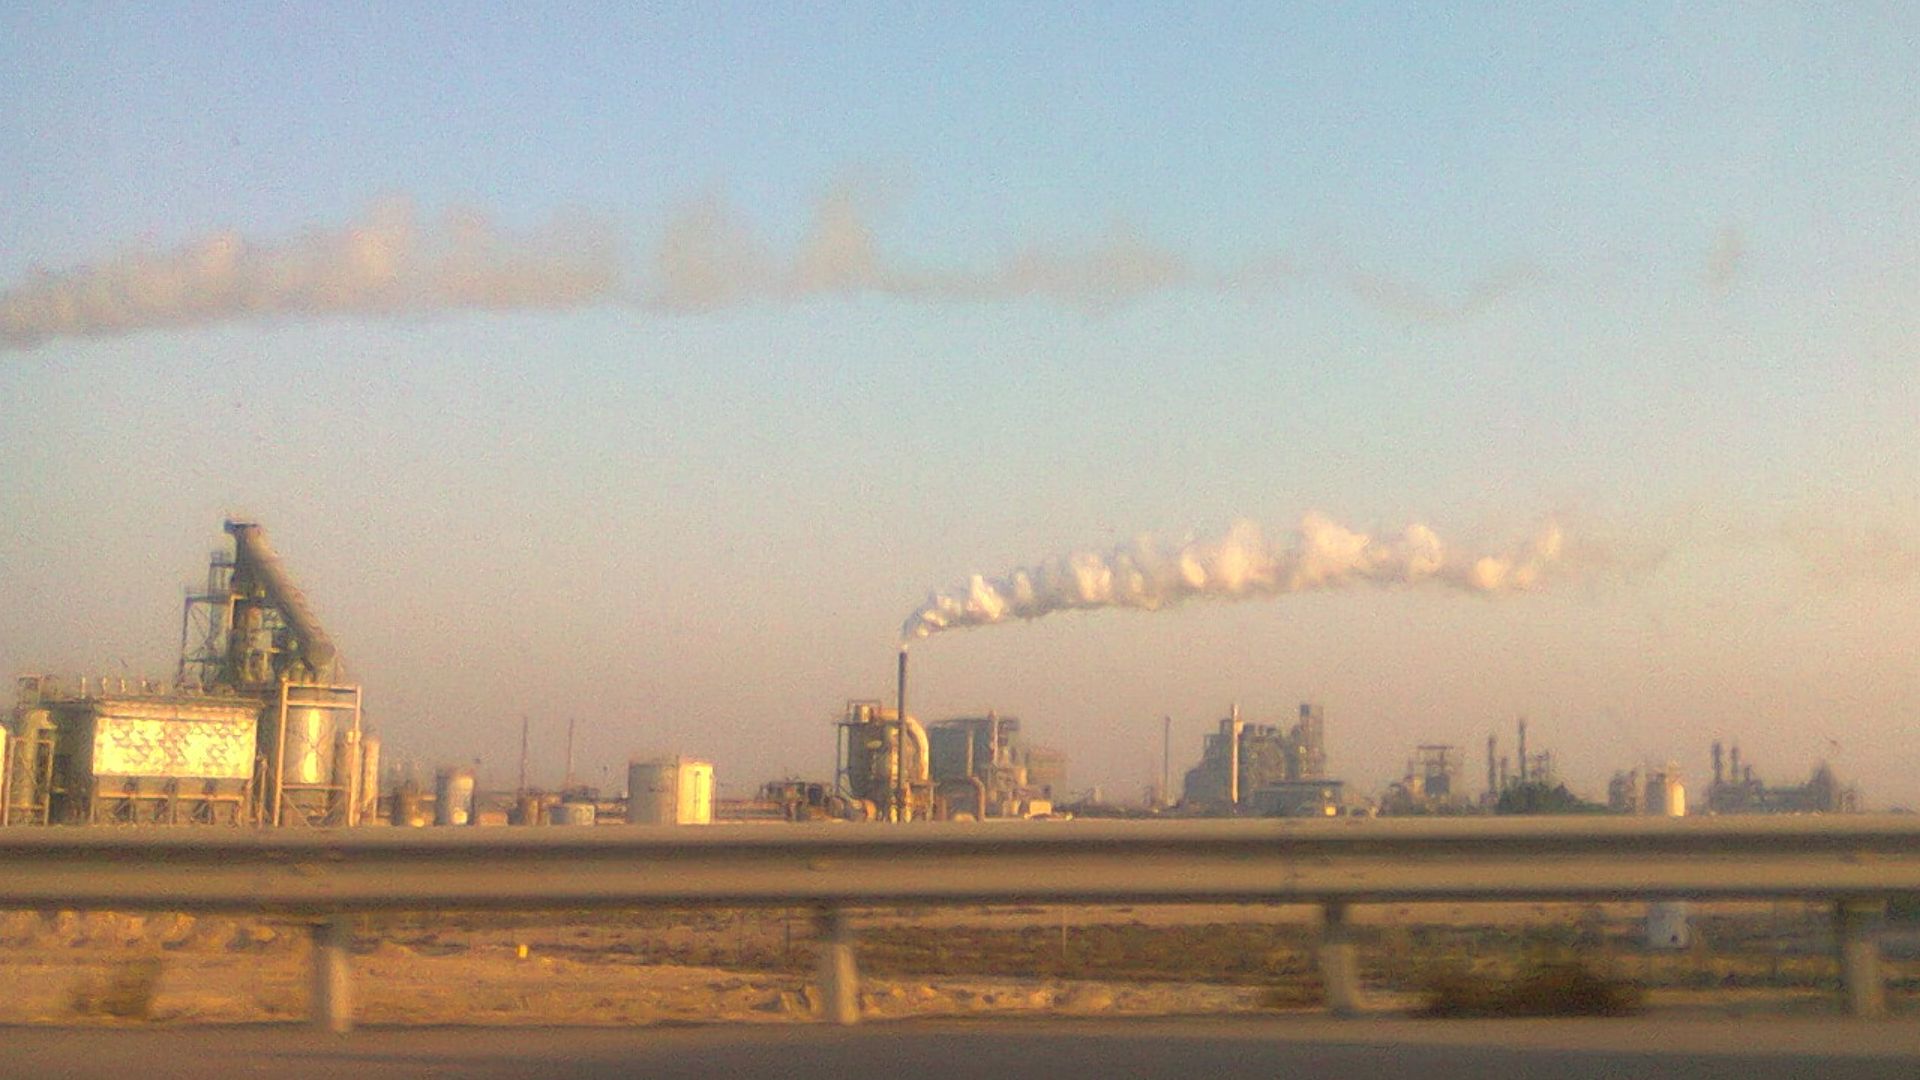
8: Saudi Arabia
Planet Damage Score: 38
Total CO₂ emissions: ~600 million metric tons
Per capita CO₂ emissions: ~17.5 metric tons
Deforestation/Land use impact: Minimal, but land stressed
Waste/Pollution impact: Heavy desalination energy demand
Saudi Arabia’s oil dependence gives it one of the highest per-person footprints.
 Suresh Babunair, Wikimedia Commons
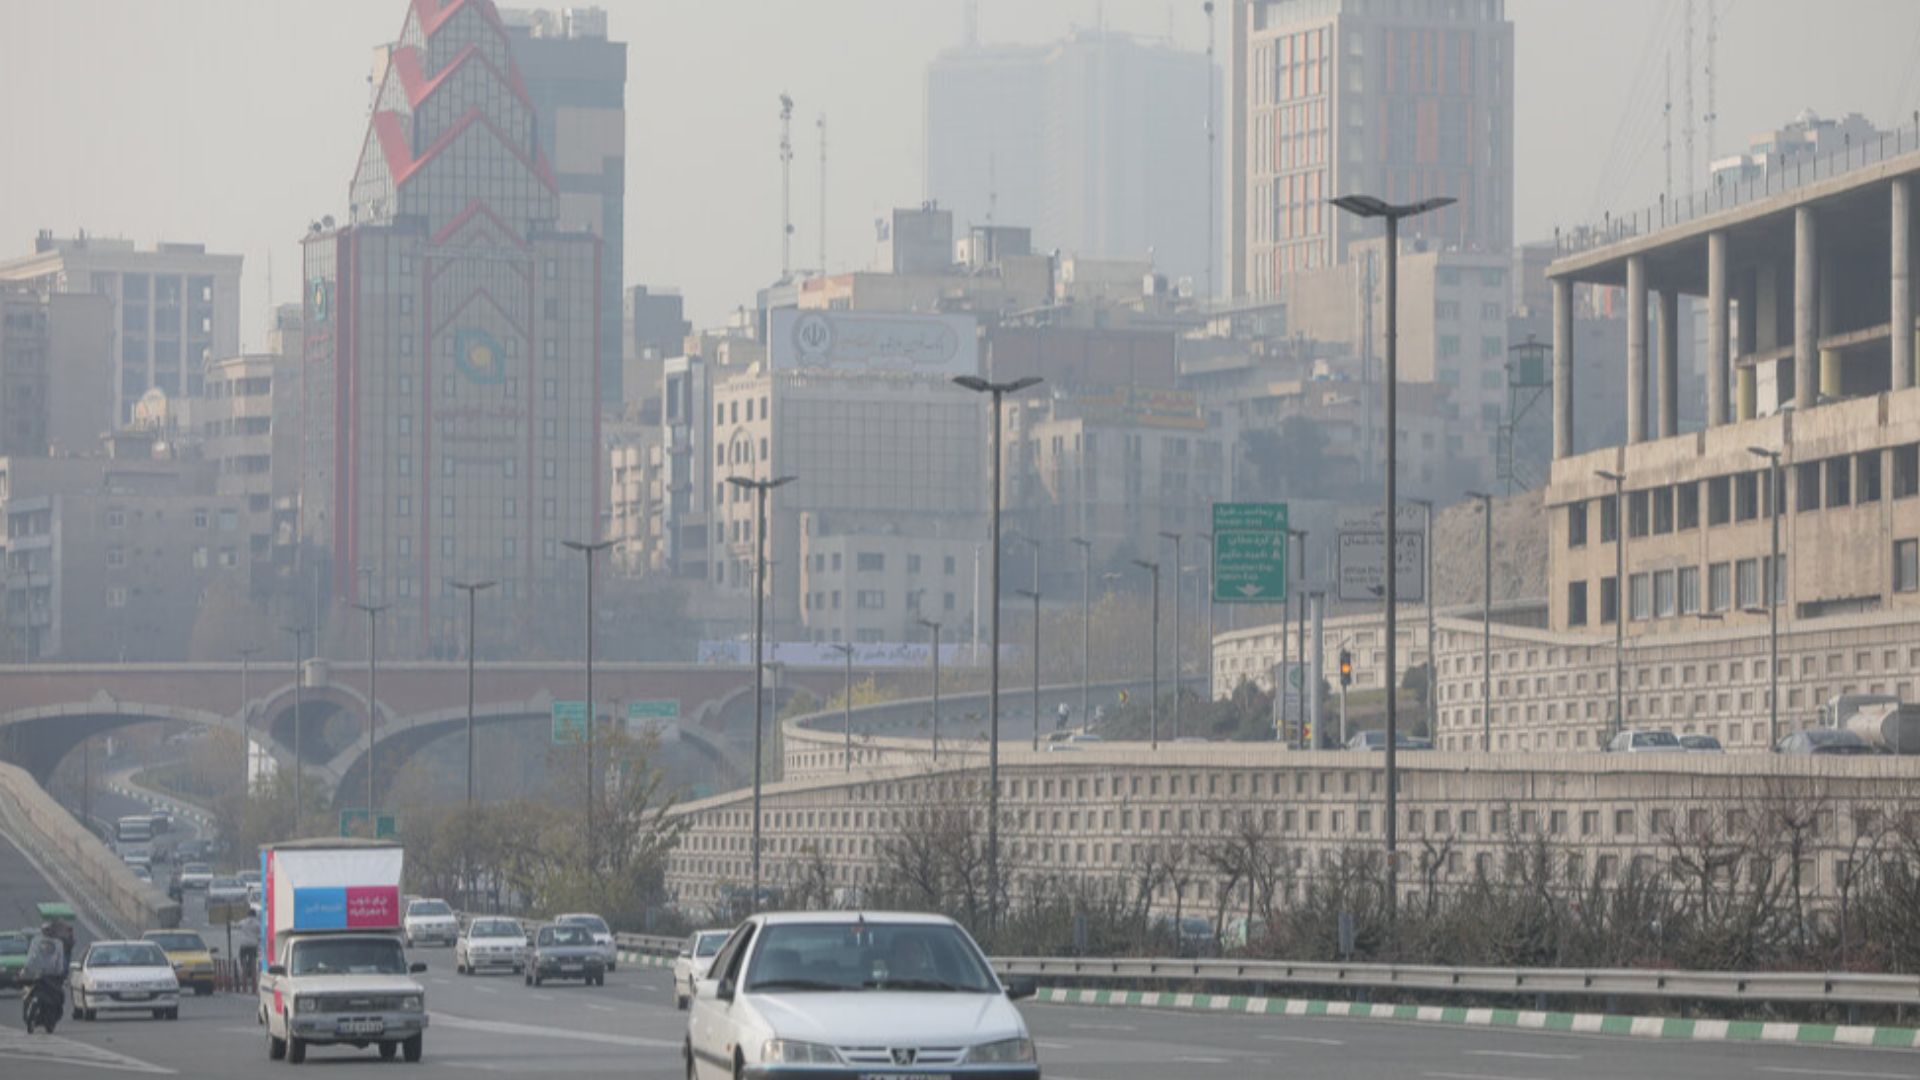
7: Iran
Planet Damage Score: 38
Total CO₂ emissions: ~700 million metric tons
Per capita CO₂ emissions: ~8.4 metric tons
Deforestation/Land use impact: ~1.3 million hectares lost since 2000
Waste/Pollution impact: ~40,000 annual deaths from air pollution
Iran’s coal and oil dependence ensures a heavy environmental toll.
 Hamid Vakili, Wikimedia Commons
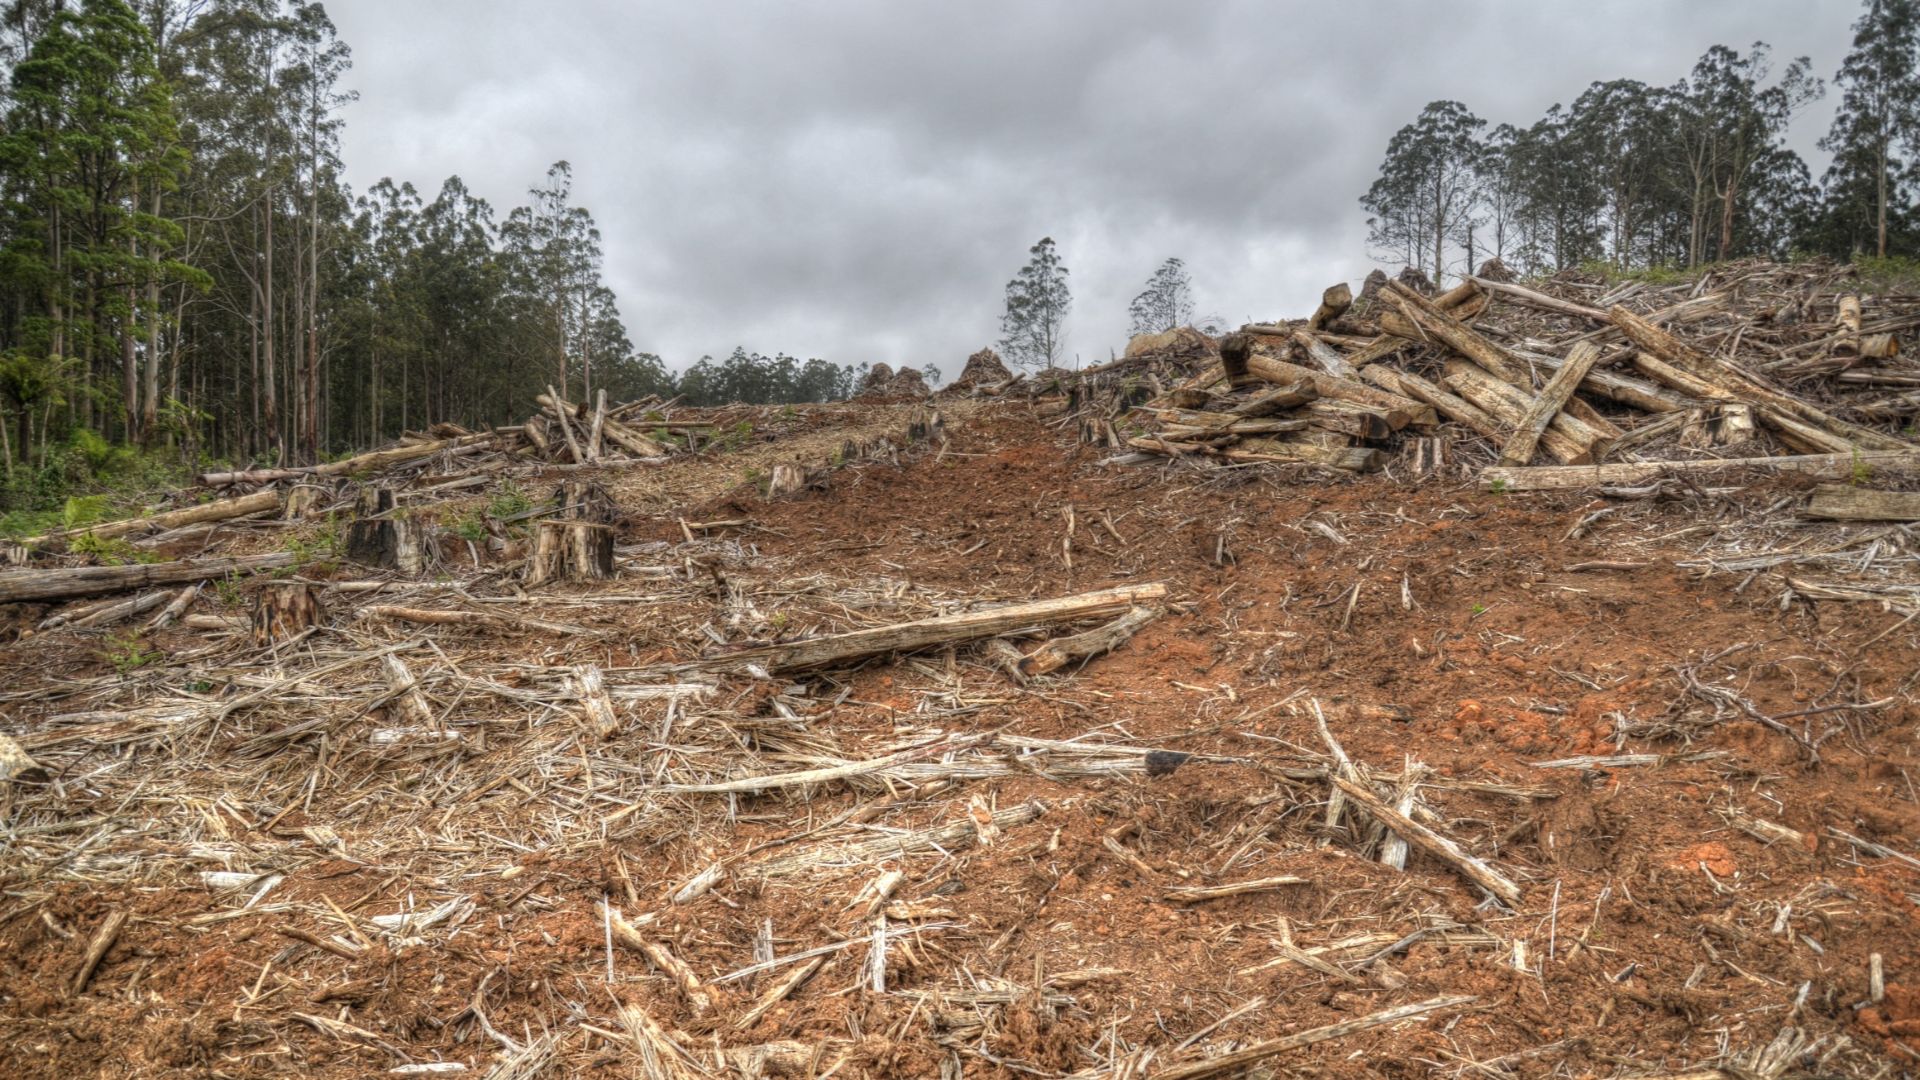
6: Australia
Planet Damage Score: 40
Total CO₂ emissions: ~400 million metric tons
Per capita CO₂ emissions: ~15.5 metric tons
Deforestation/Land use impact: ~500,000 hectares lost yearly
Waste/Pollution impact: Coal exports drive global footprint
Australia combines high per-person emissions with large-scale land clearing.
 Peter Campbell, Wikimedia Commons
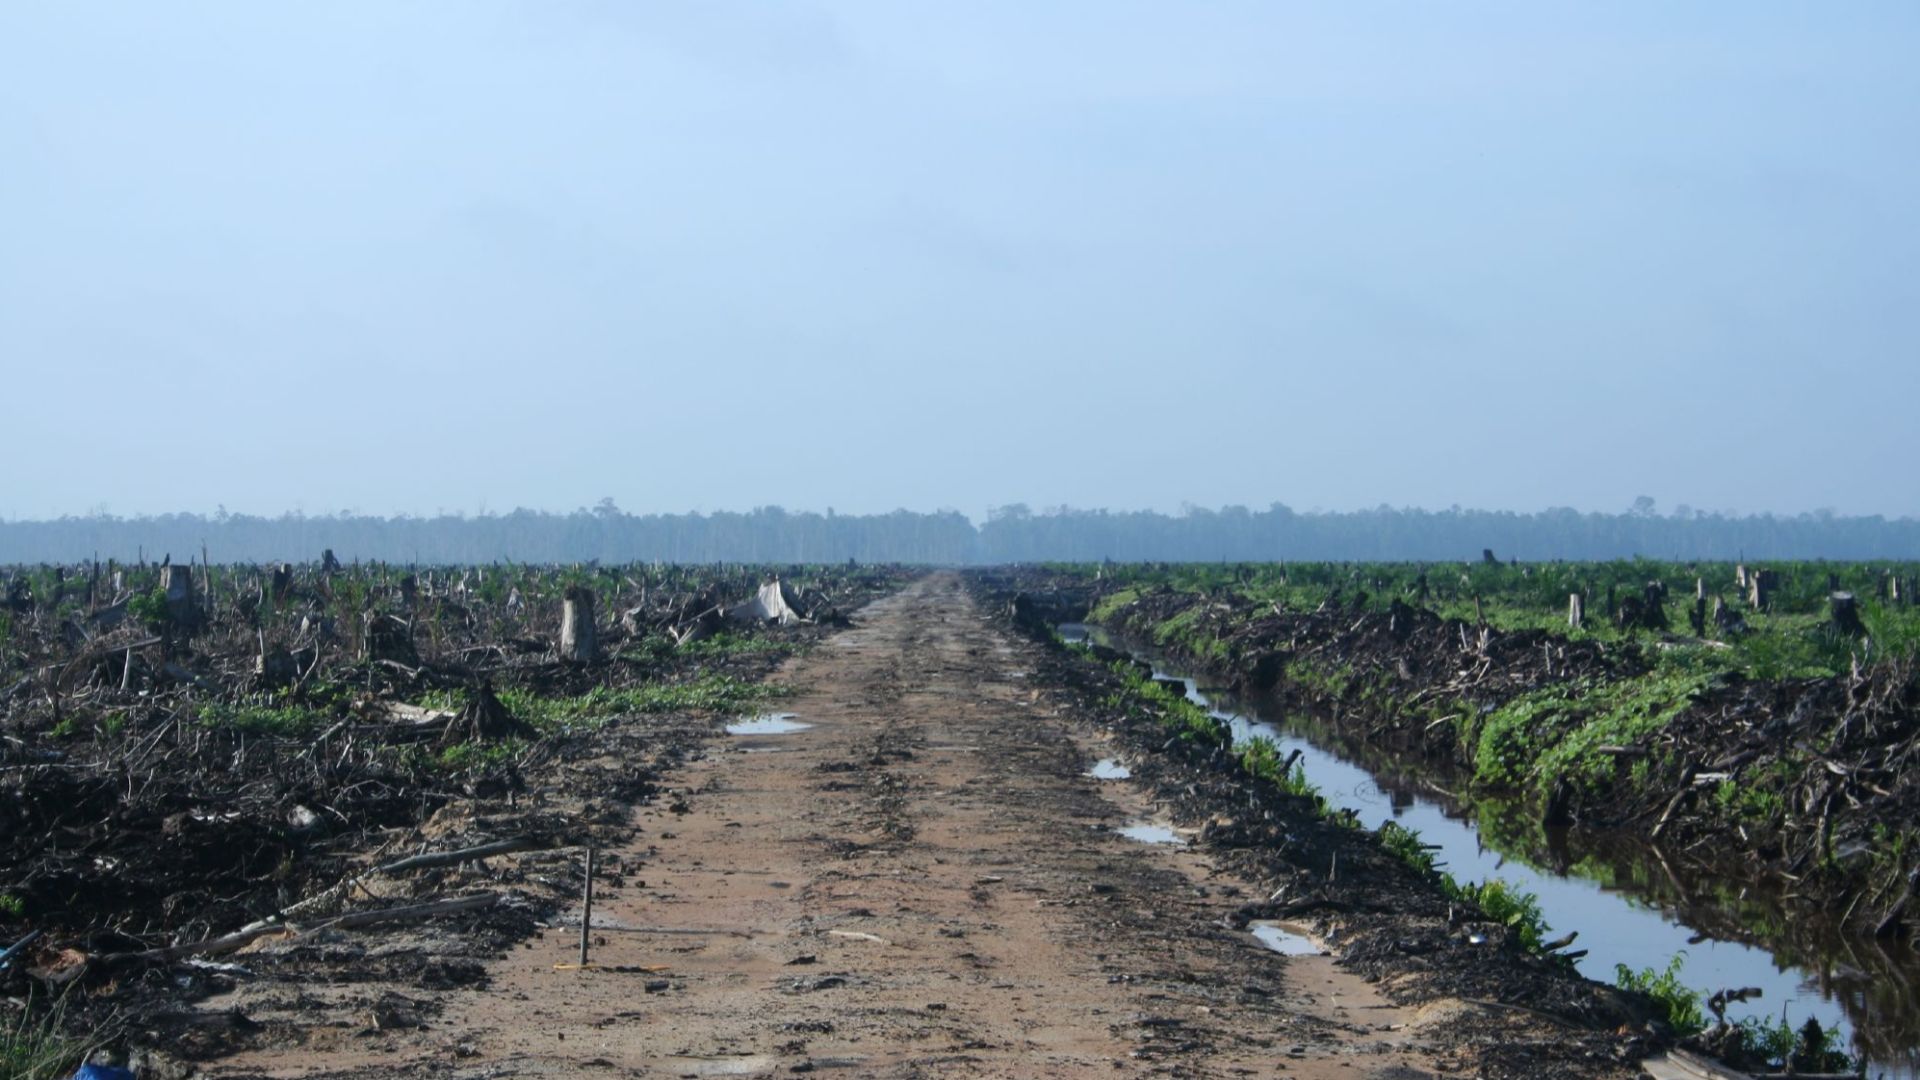
5: Indonesia
Planet Damage Score: 40
Total CO₂ emissions: ~650 million metric tons
Per capita CO₂ emissions: ~2.4 metric tons
Deforestation/Land use impact: ~9 million hectares lost since 2000
Waste/Pollution impact: ~3 million tons plastic leakage yearly
Indonesia’s rainforest destruction and plastic waste are among the worst globally.
4: Russia
Planet Damage Score: 42
Total CO₂ emissions: ~1.7 billion metric tons
Per capita CO₂ emissions: ~11.5 metric tons
Deforestation/Land use impact: ~2 million hectares lost annually
Waste/Pollution impact: Fossil fuels ~85% of energy mix
Russia’s coal and oil reliance make it a global powerhouse polluter.
 Alt-n-Anela, Wikimedia Commons
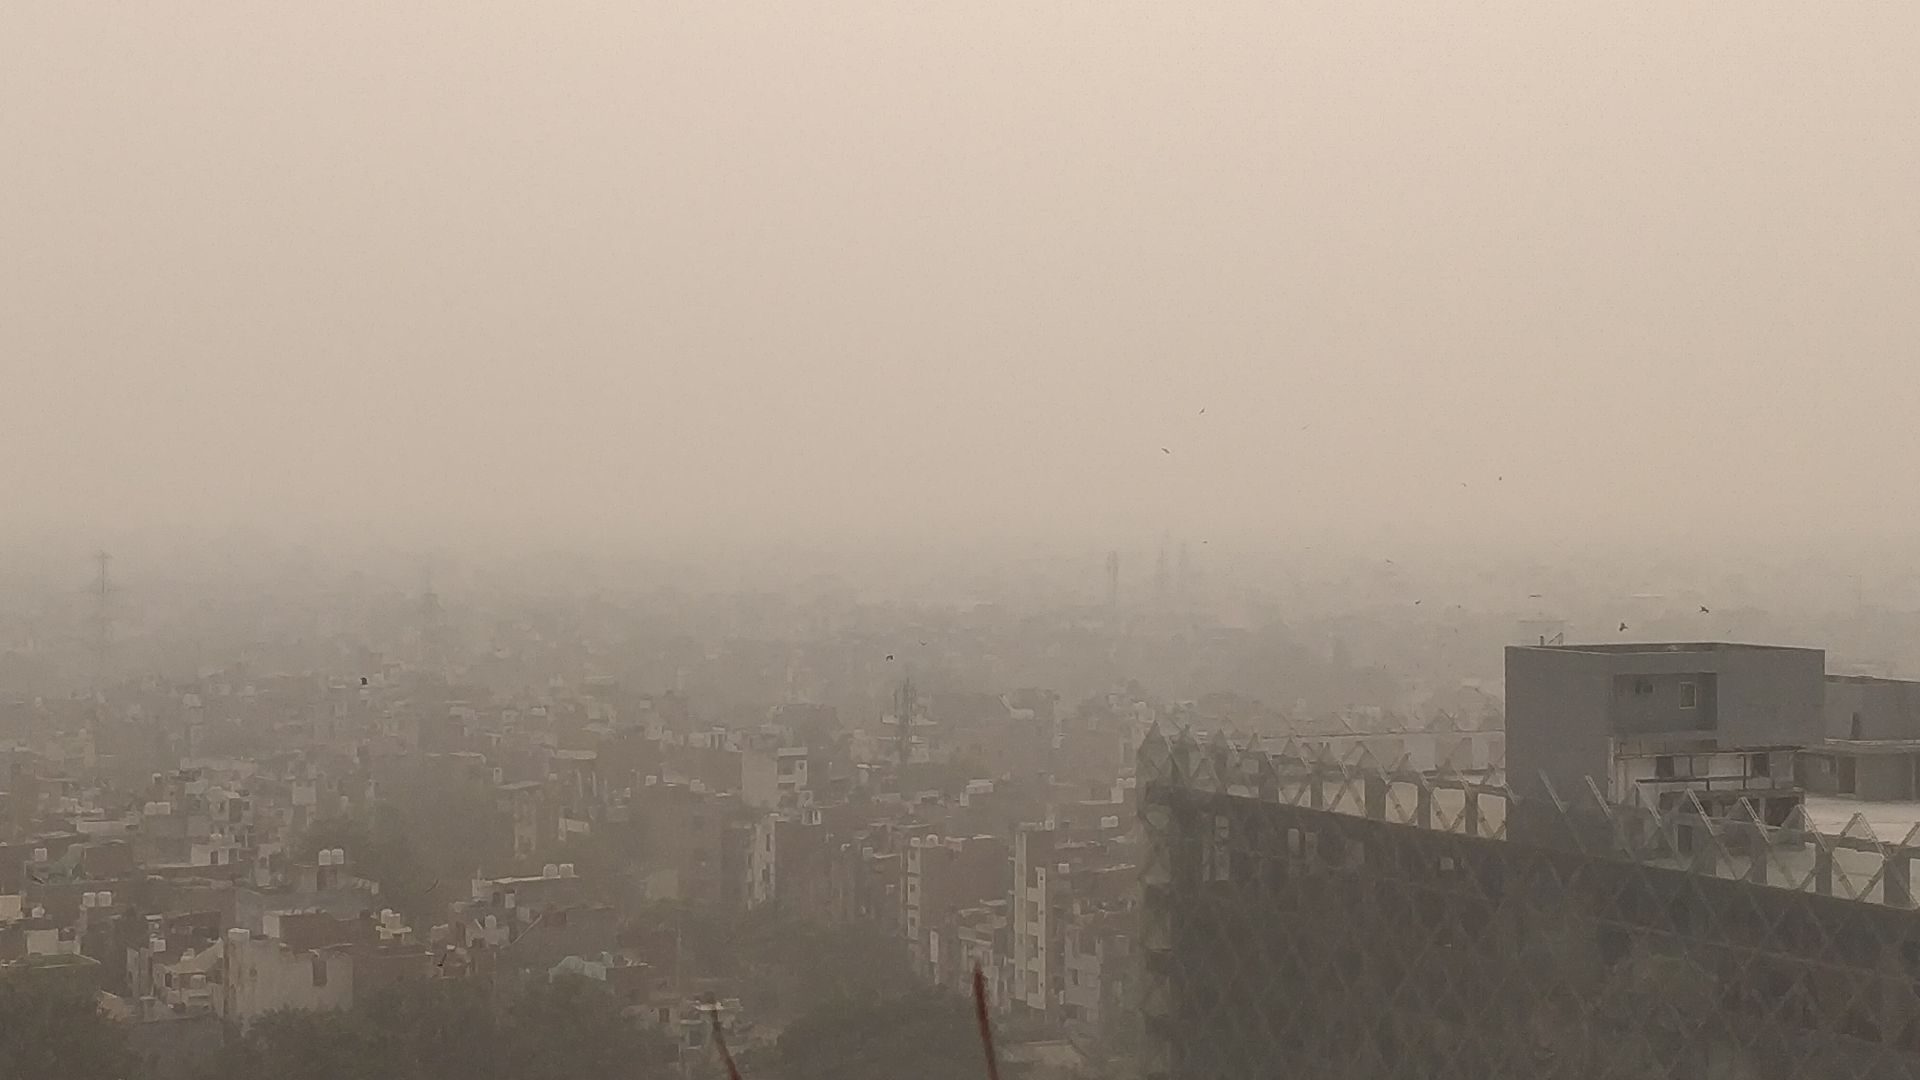
3: India
Planet Damage Score: 46
Total CO₂ emissions: ~2.7 billion metric tons
Per capita CO₂ emissions: ~2.0 metric tons
Deforestation/Land use impact: ~500,000 hectares lost yearly
Waste/Pollution impact: ~1.6 million annual deaths from air pollution
India’s size and coal reliance secure its place in the top three.
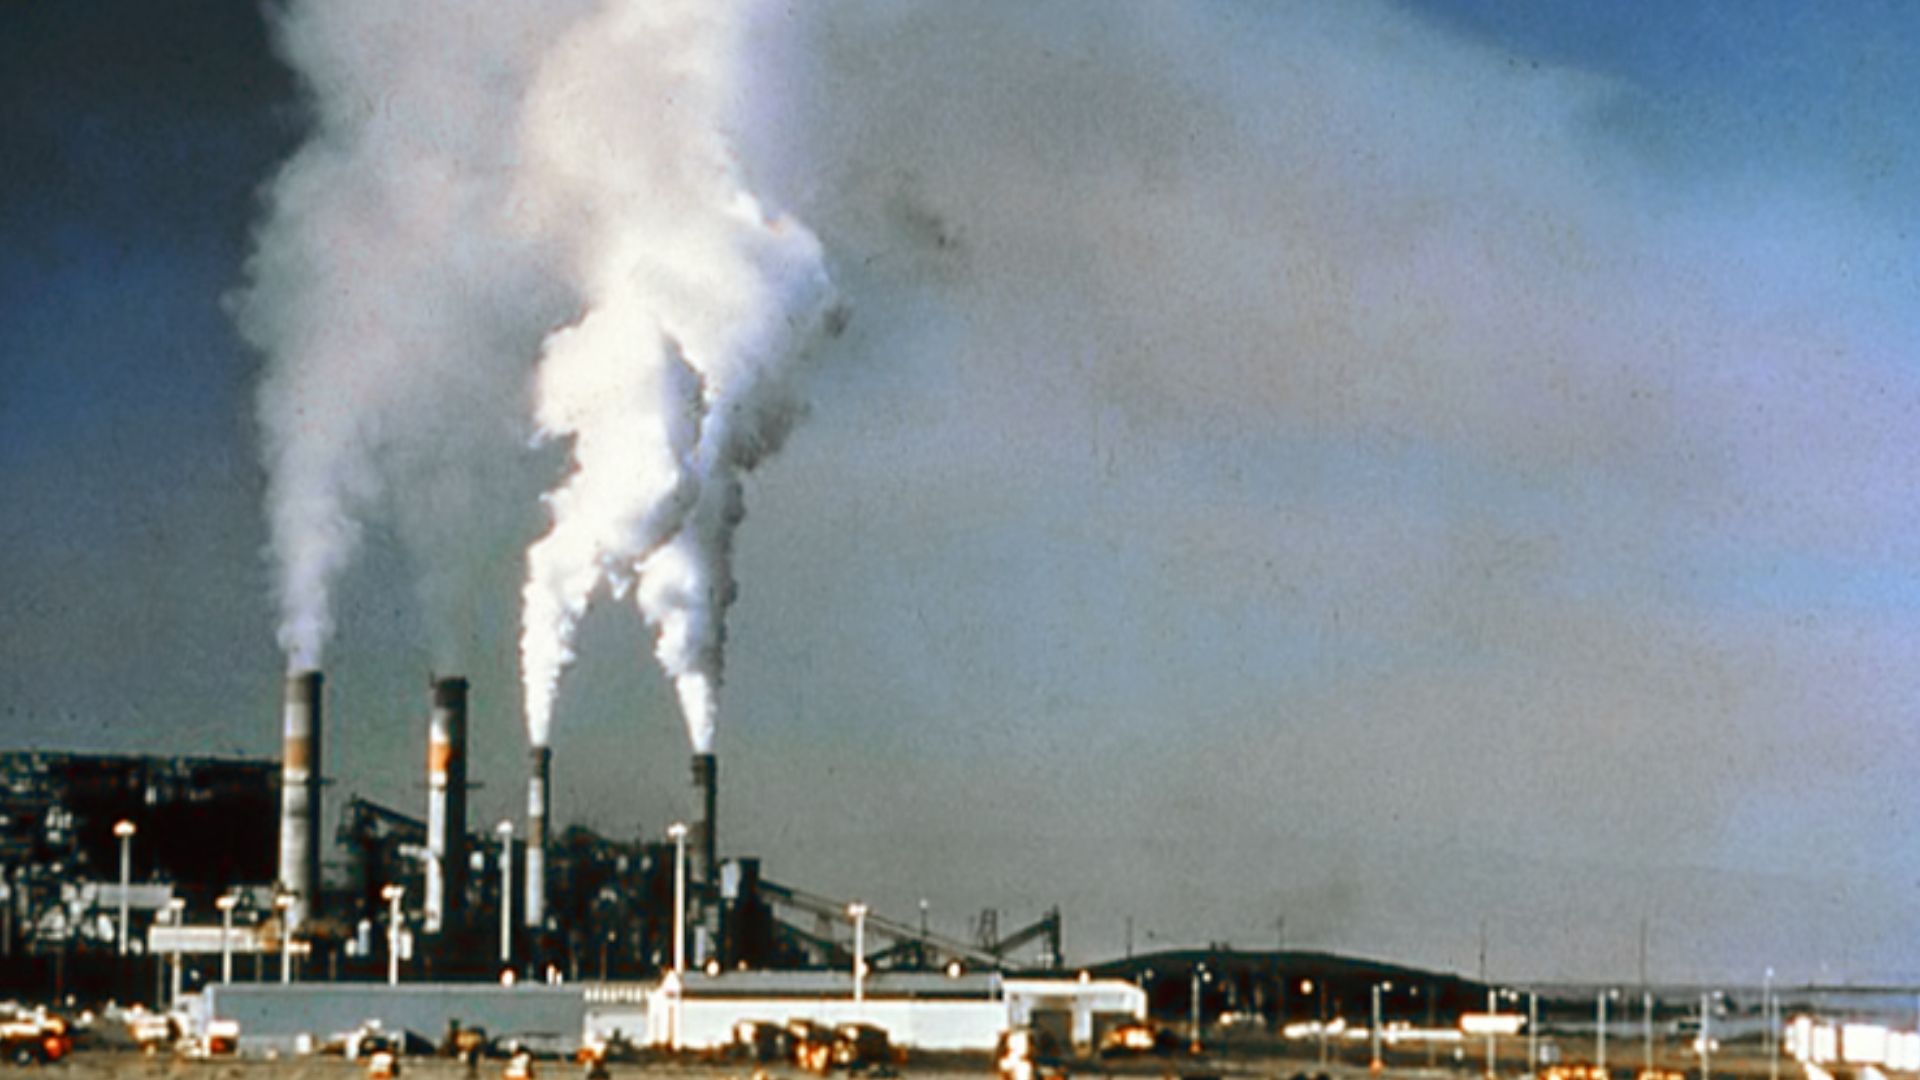
2: United States
Planet Damage Score: 58
Total CO₂ emissions: ~5.4 billion metric tons
Per capita CO₂ emissions: ~15 metric tons
Deforestation/Land use impact: ~400,000 hectares lost annually
Waste/Pollution impact: ~800 kg waste per person annually
The U.S. is the world’s second-biggest polluter, with one of the largest per-person footprints.
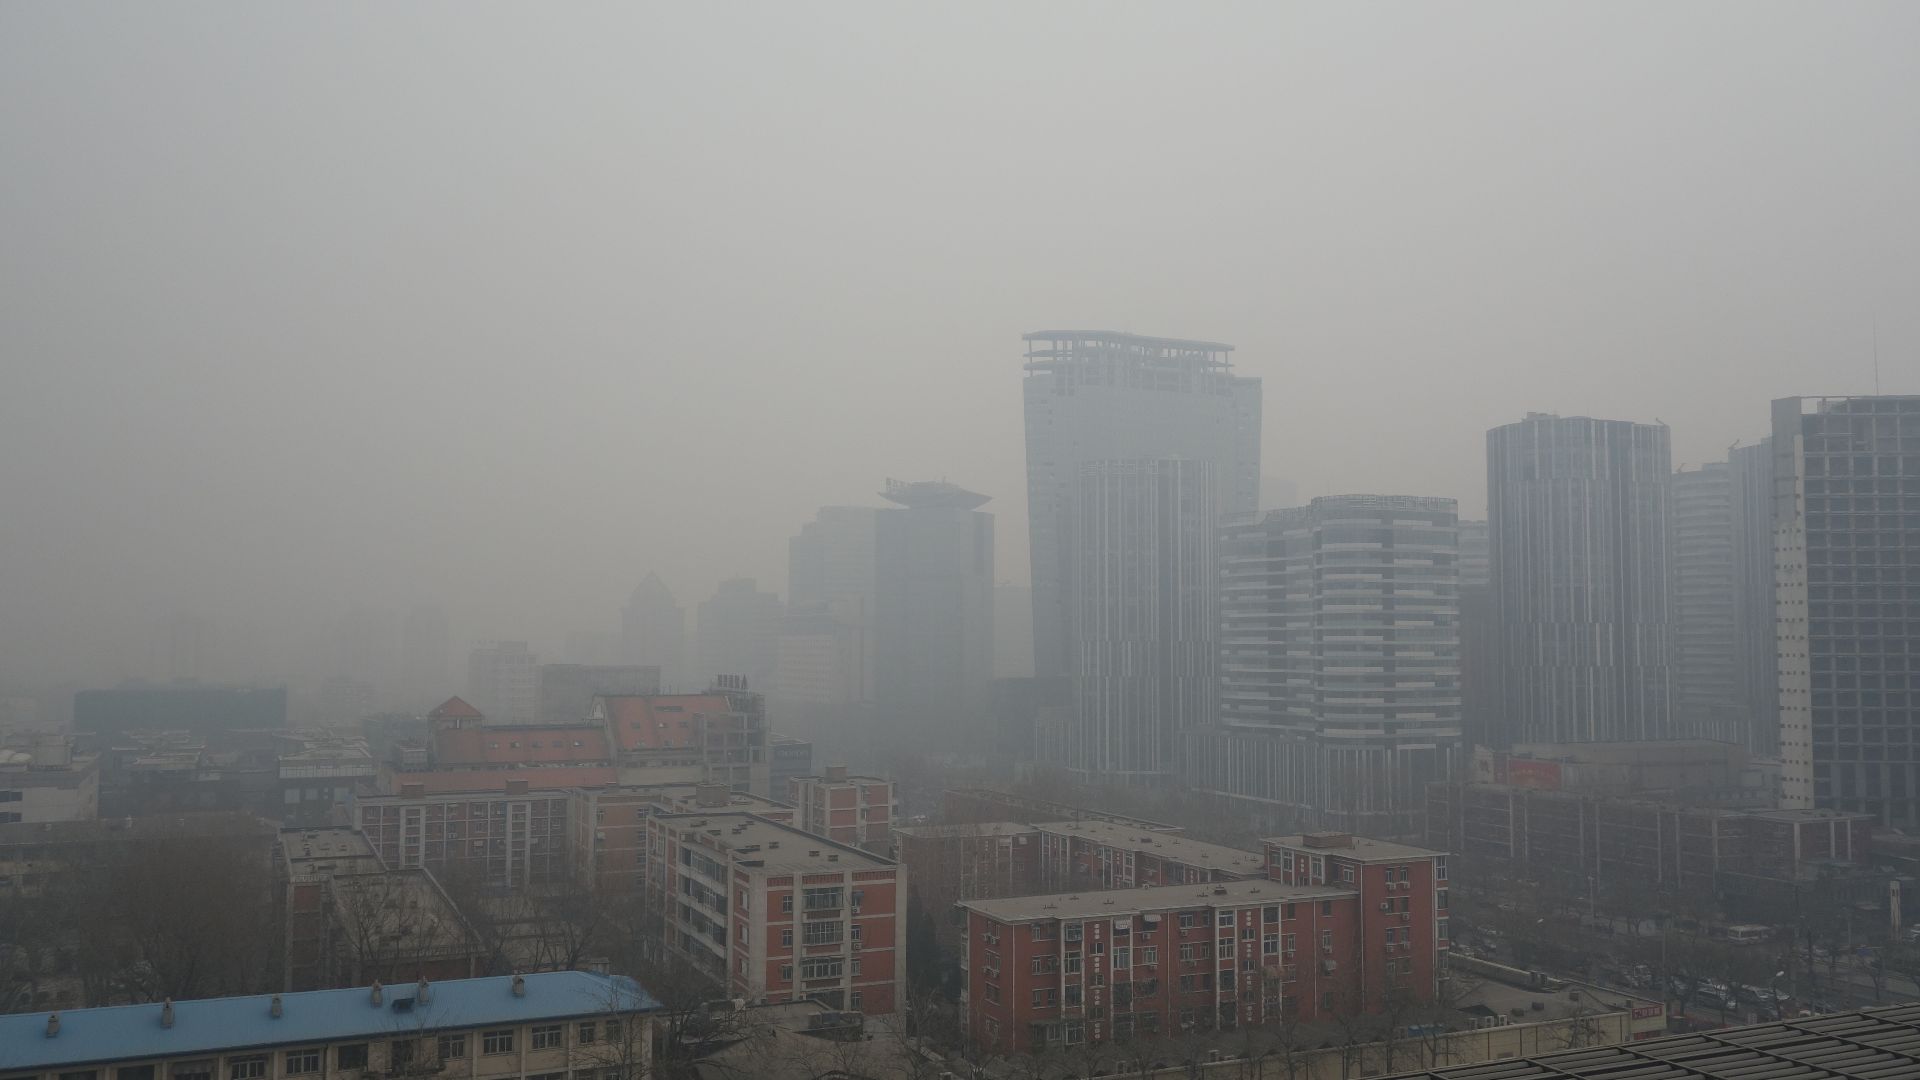
1: China
Planet Damage Score: 60
Total CO₂ emissions: ~11 billion metric tons
Per capita CO₂ emissions: ~8.2 metric tons
Deforestation/Land use impact: ~8% of global forest loss
Waste/Pollution impact: ~3.5 million tons plastic leakage annually
China tops the Dirty 30, producing more emissions and waste than any other nation.
 Kentaro IEMOTO from Tokyo, Japan, Wikimedia Commons
You Might Also Like:
Ranking The Top 25 Food Festivals In The World—According To Foodies
Ranking The Fastest Growing Cities In America—According To Data
Ranking The Countries With The Longest Life Expectancies—According To Data