
Road Rage Isn’t Just Honking
Some states don’t just have traffic—they have confrontation. Using a four-part Road Rage Index built from Armed Road Rage Incidents (ARRI), aggressive-driving fatal crashes, speeding-related deaths, and regional self-reported aggression rates, we ranked the 30 most road-ragey states from relatively calm to outright combustible.
30: Vermont
Road Rage Index: 18.4
Low ARRI totals and limited aggressive-driving fatal crash coding keep Vermont near the bottom of the national ranking. Even with moderate speeding share, the Northeast’s lower self-reported aggression rates help suppress the overall score and prevent confrontation patterns from escalating statewide.
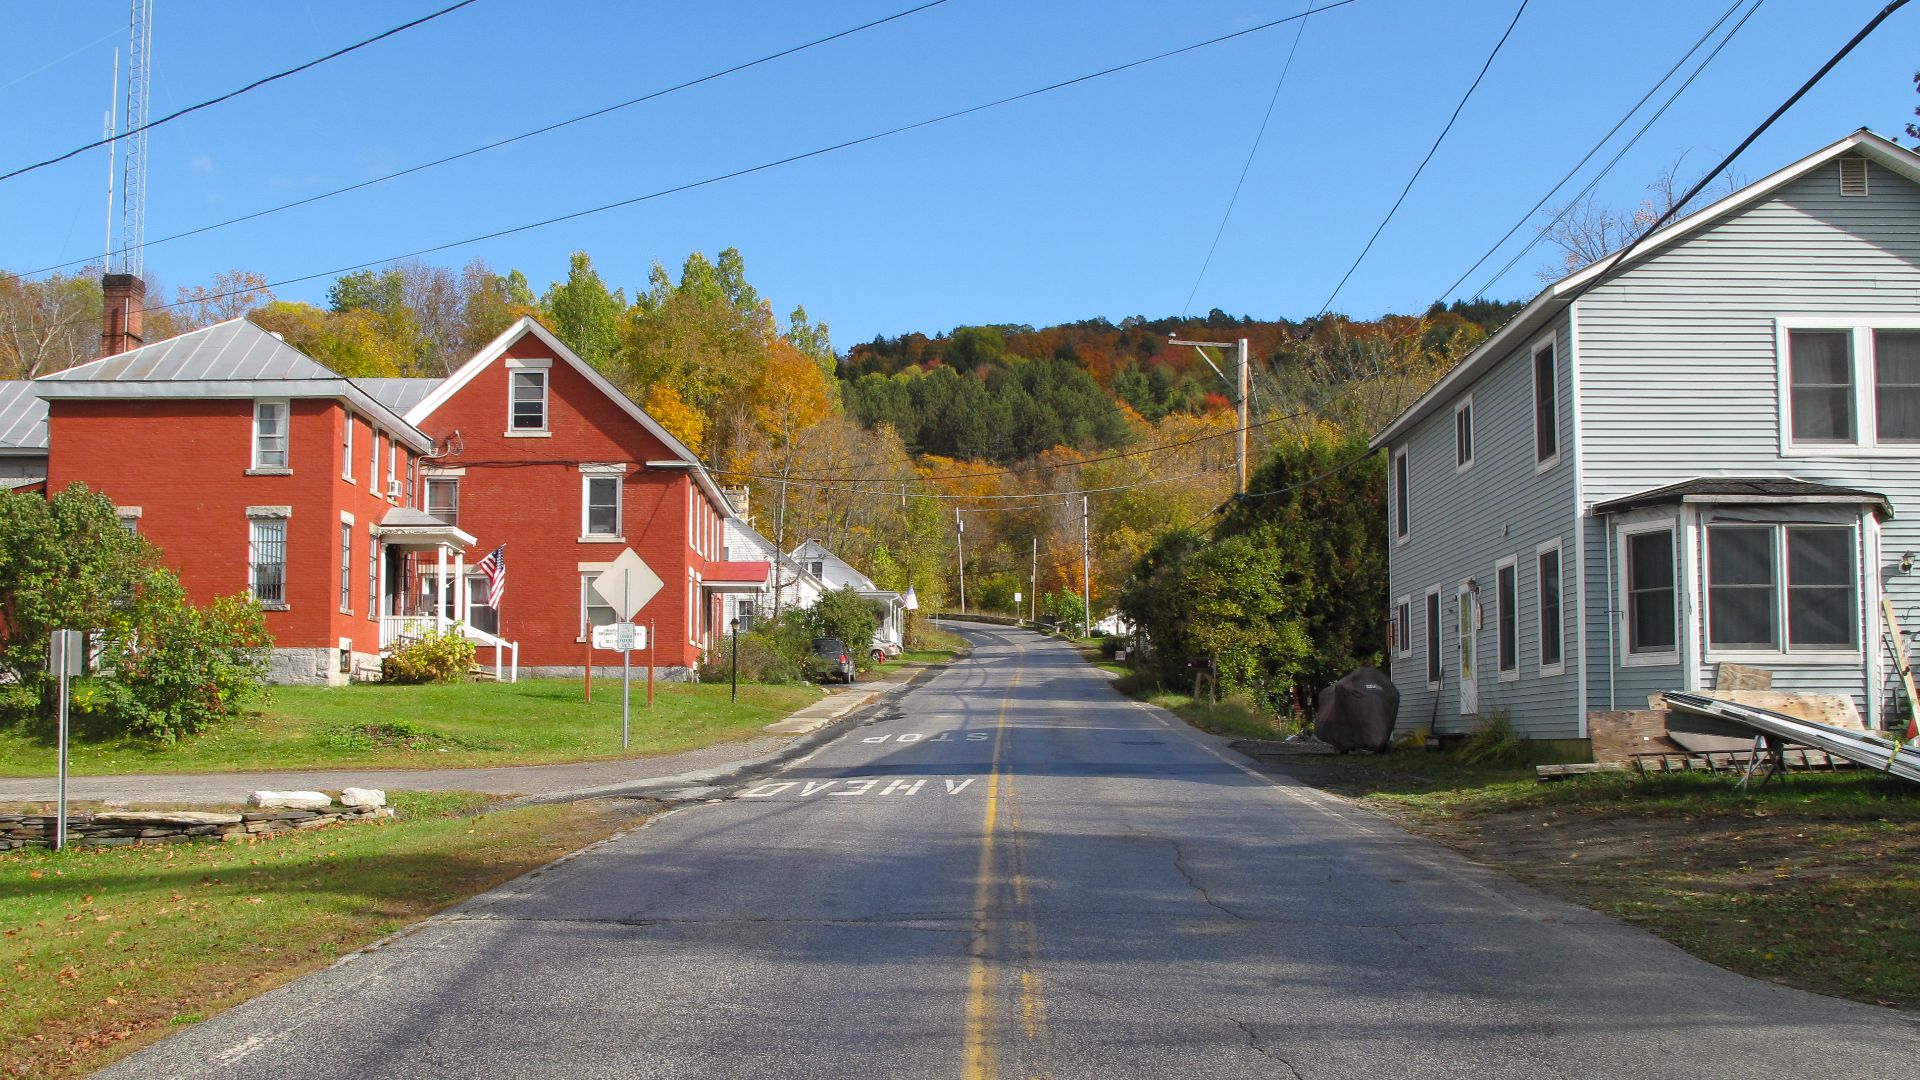 Michael Calore, Wikimedia Commons
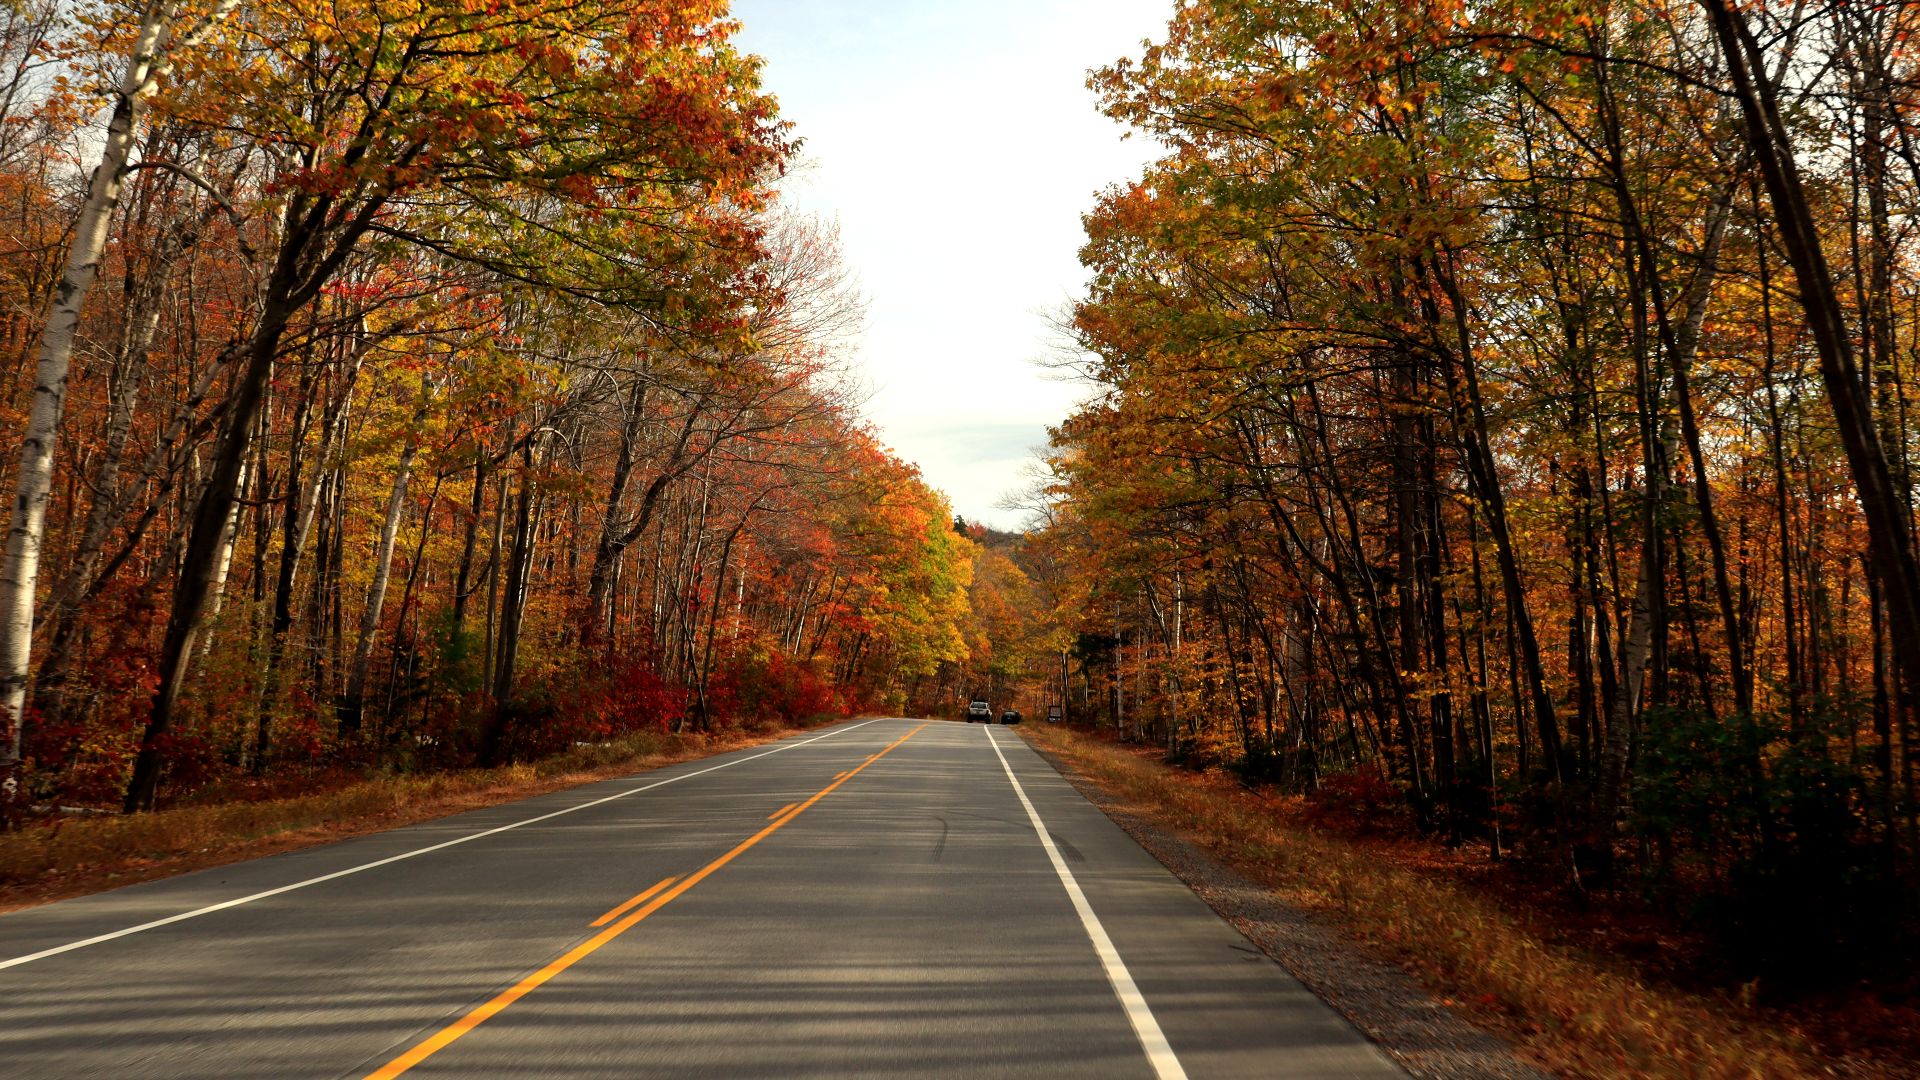
29: Maine
Road Rage Index: 19.7
Sparse population density and very low ARRI activity keep Maine’s measurable confrontation risk minimal. Speed contributes to some fatal crashes, particularly on rural highways, but aggressive behavioral patterns remain comparatively restrained when viewed across the full three-year index.
 Steve Garry from Manchester, United Kingdom, Wikimedia Commons
28: New Hampshire
Road Rage Index: 21.1
Speeding-related fatalities are elevated compared to some neighboring states, yet armed confrontations remain rare overall. Combined with moderate aggressive-driving crash factors, New Hampshire stays on the calmer side of the spectrum despite occasional high-speed corridors.
 Arnabacharjee, Wikimedia Commons
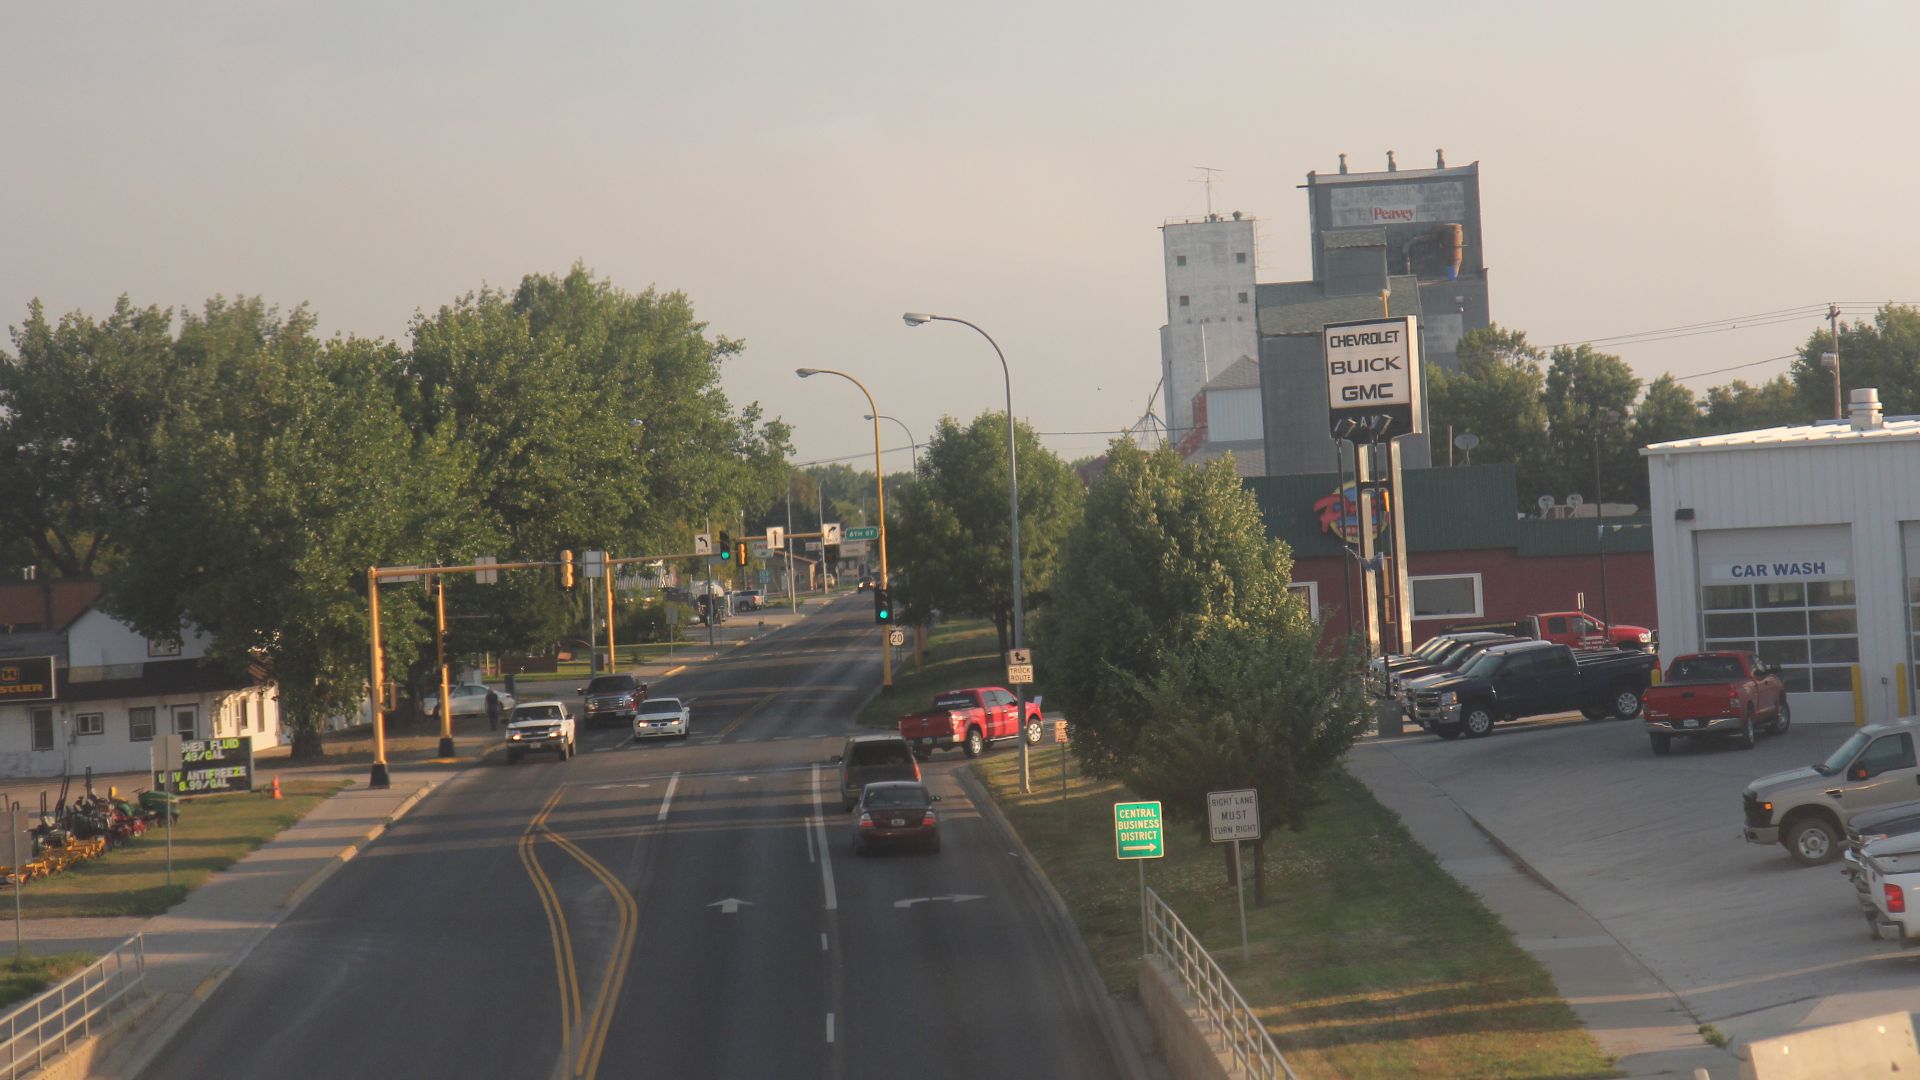
27: North Dakota
Road Rage Index: 22.5
Wide-open highways raise speed-related fatality risk, but ARRI levels remain very low in per-capita terms. Aggressive-driving fatal crashes do occur, though not at the sustained rates seen in higher-ranked Southern and Southwestern states.
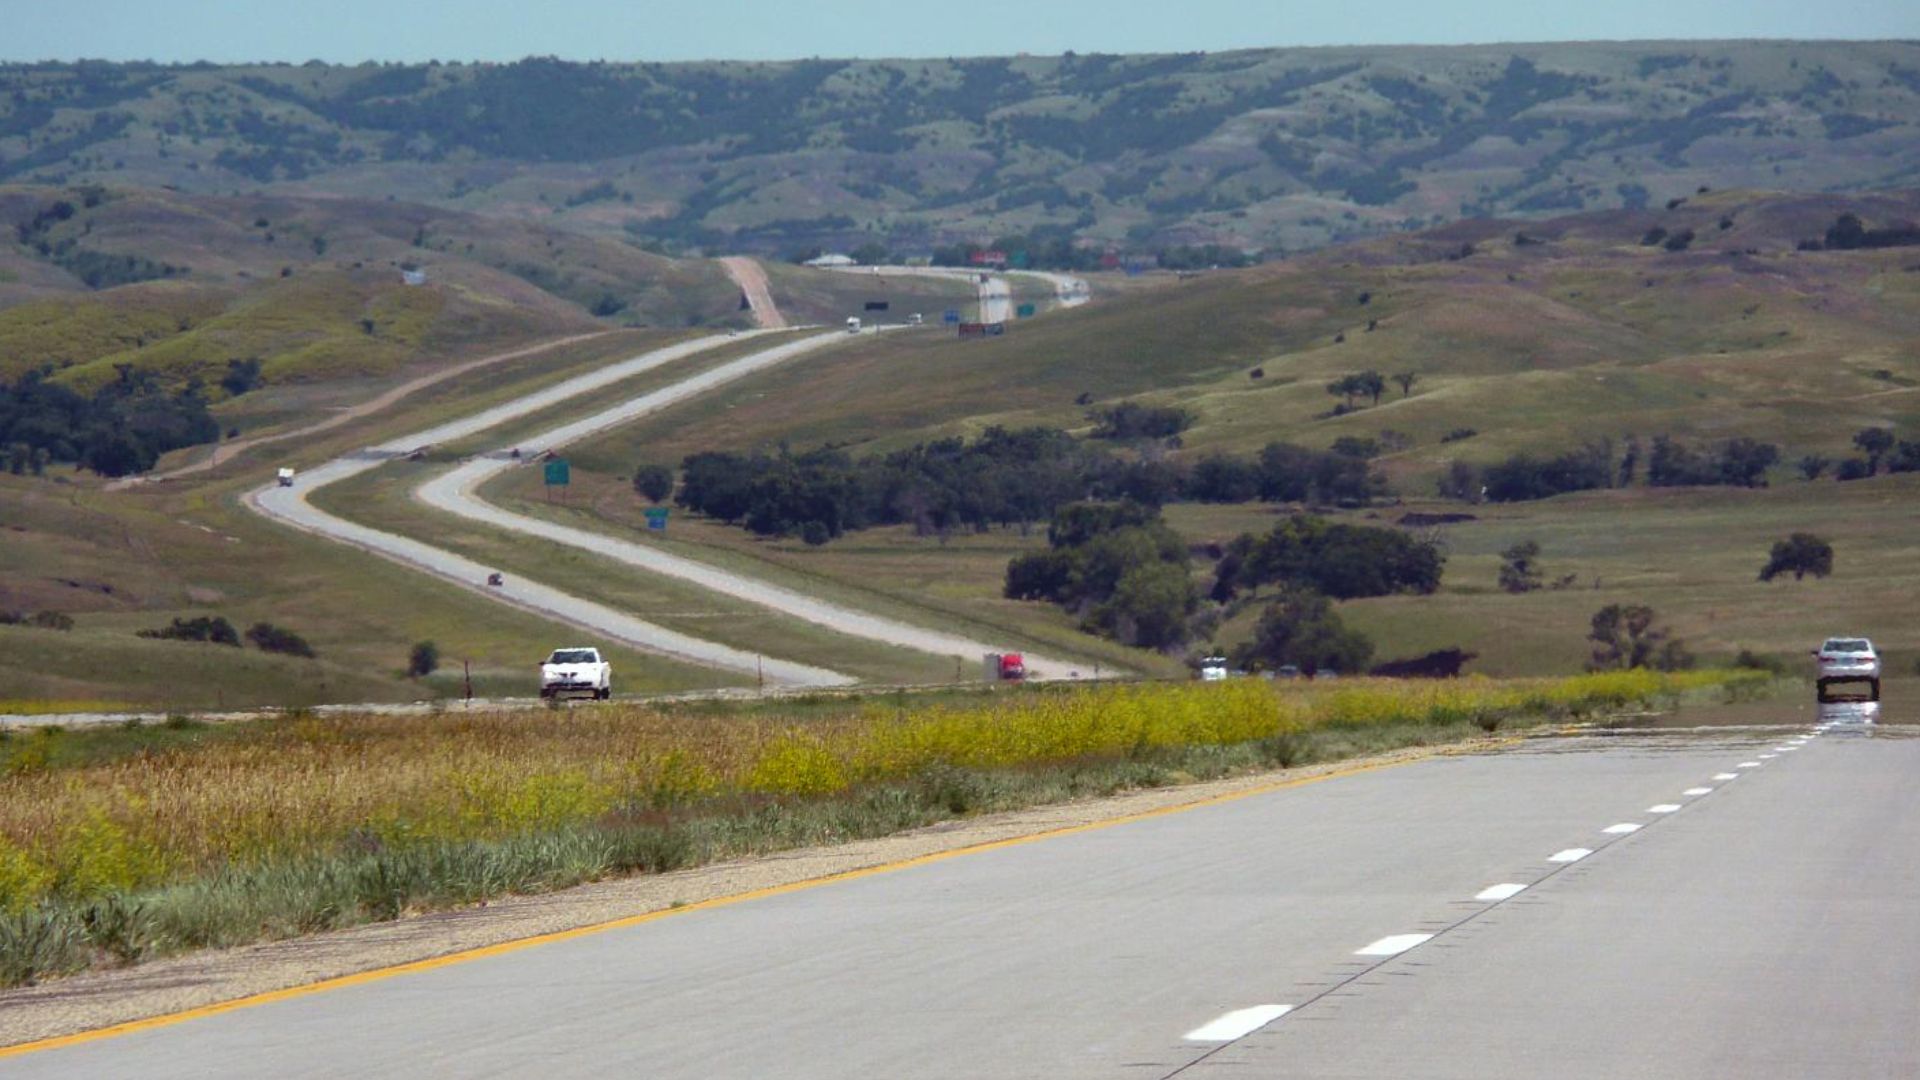
26: South Dakota
Road Rage Index: 23.3
Speeding influences fatal crash outcomes here, particularly on rural interstates, yet documented armed roadway confrontations remain limited. The overall aggression footprint stays below the national midpoint when all four weighted factors are applied.
 Andrea Church from United States, Wikimedia Commons
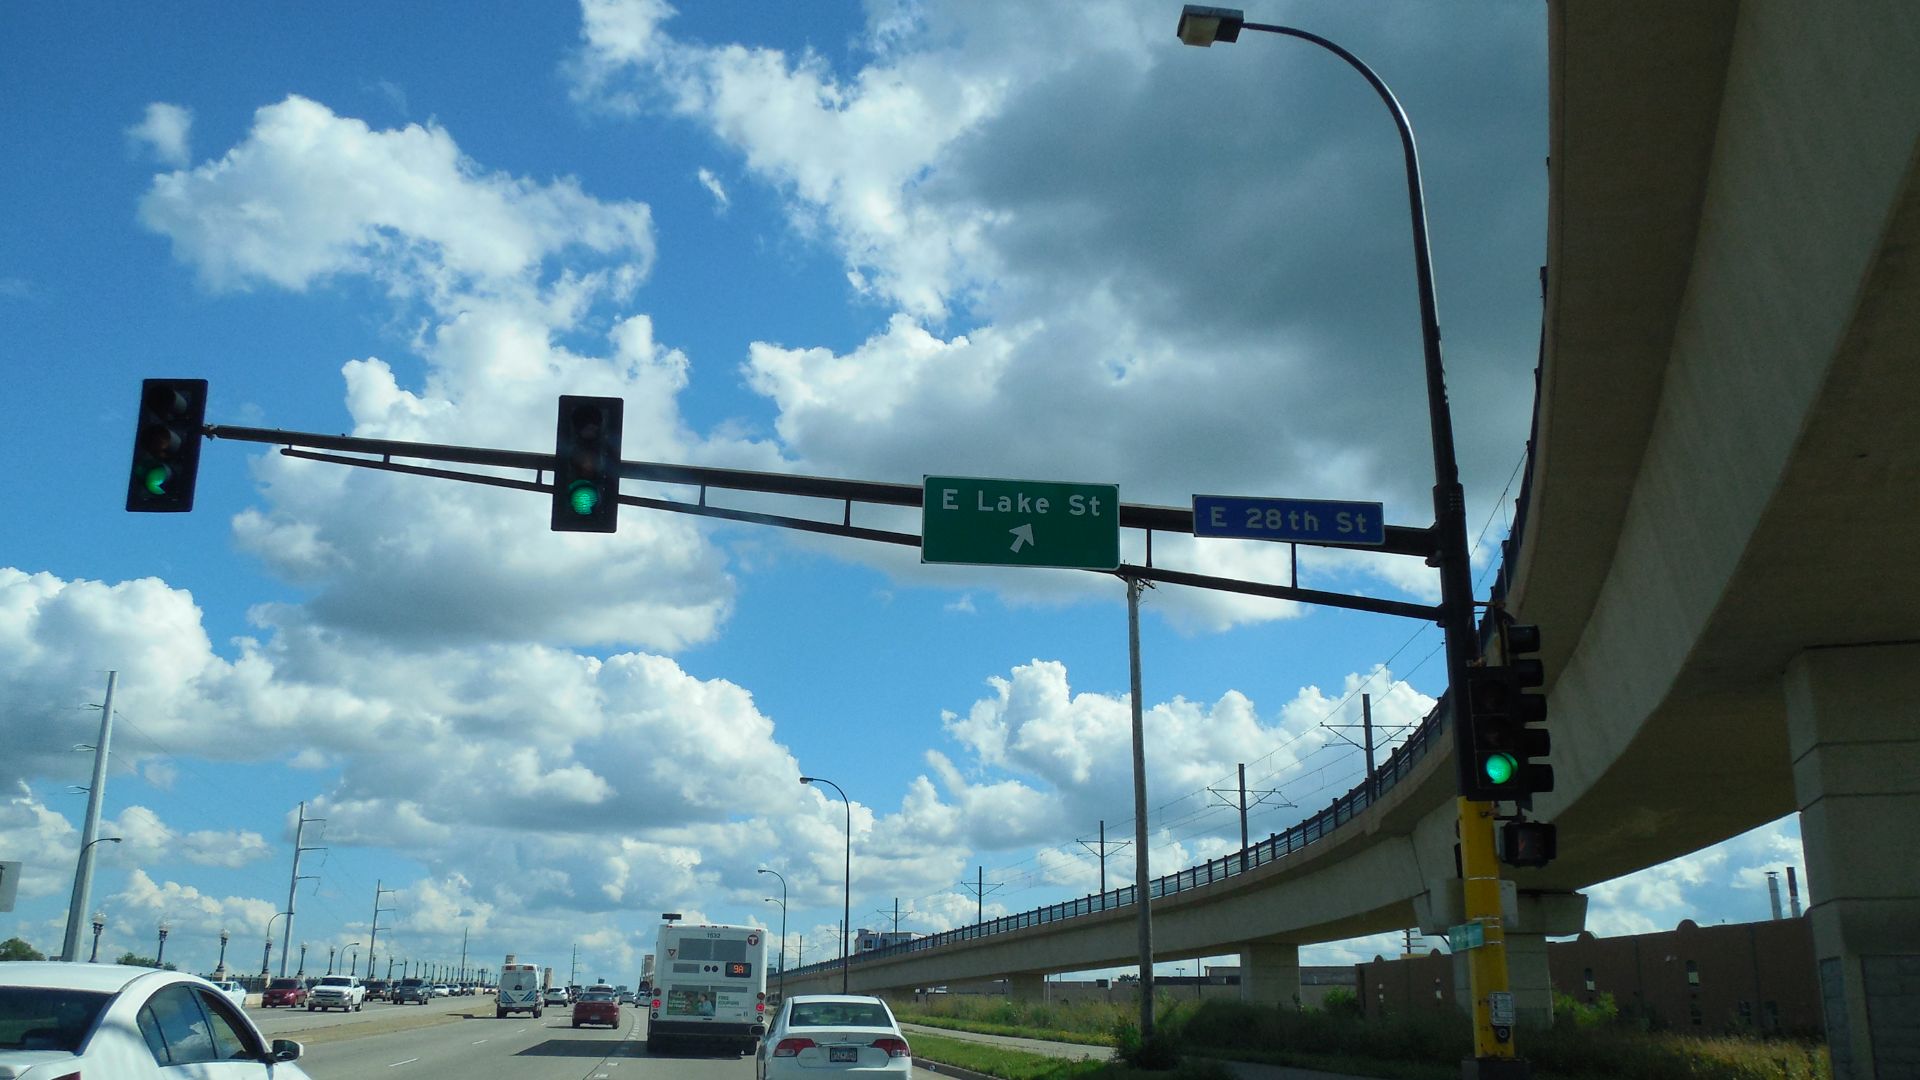
25: Minnesota
Road Rage Index: 25.9
Urban congestion in the Twin Cities contributes to aggressive crash coding, but ARRI remains modest relative to population. Regional self-reported aggression data also tempers the overall score, keeping Minnesota from climbing further up the ranking.
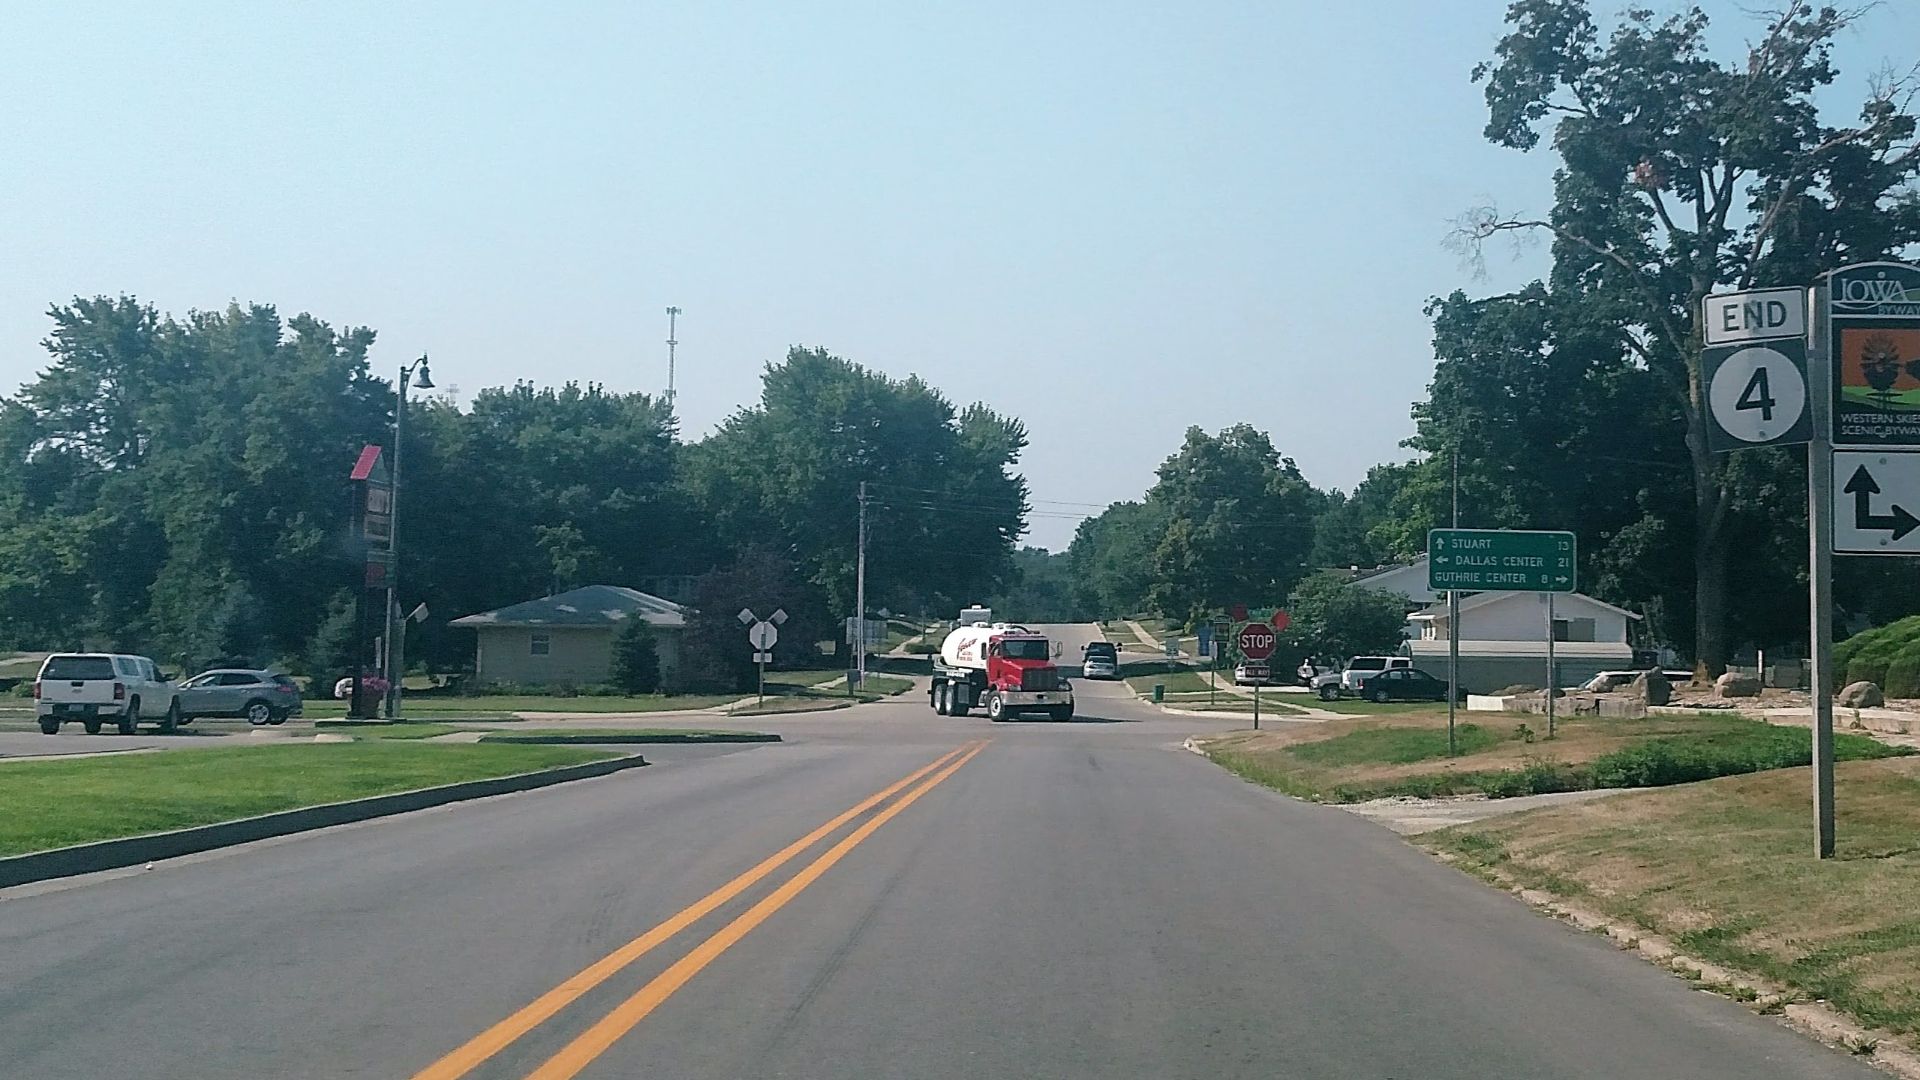
24: Iowa
Road Rage Index: 27.2
Rural speed plays a noticeable role in fatal outcomes, especially on long stretches of highway travel. However, armed confrontations and aggressive-driving fatal factors remain comparatively uncommon, preventing Iowa from entering the upper tier of road rage states.
 Brandonrush, Wikimedia Commons
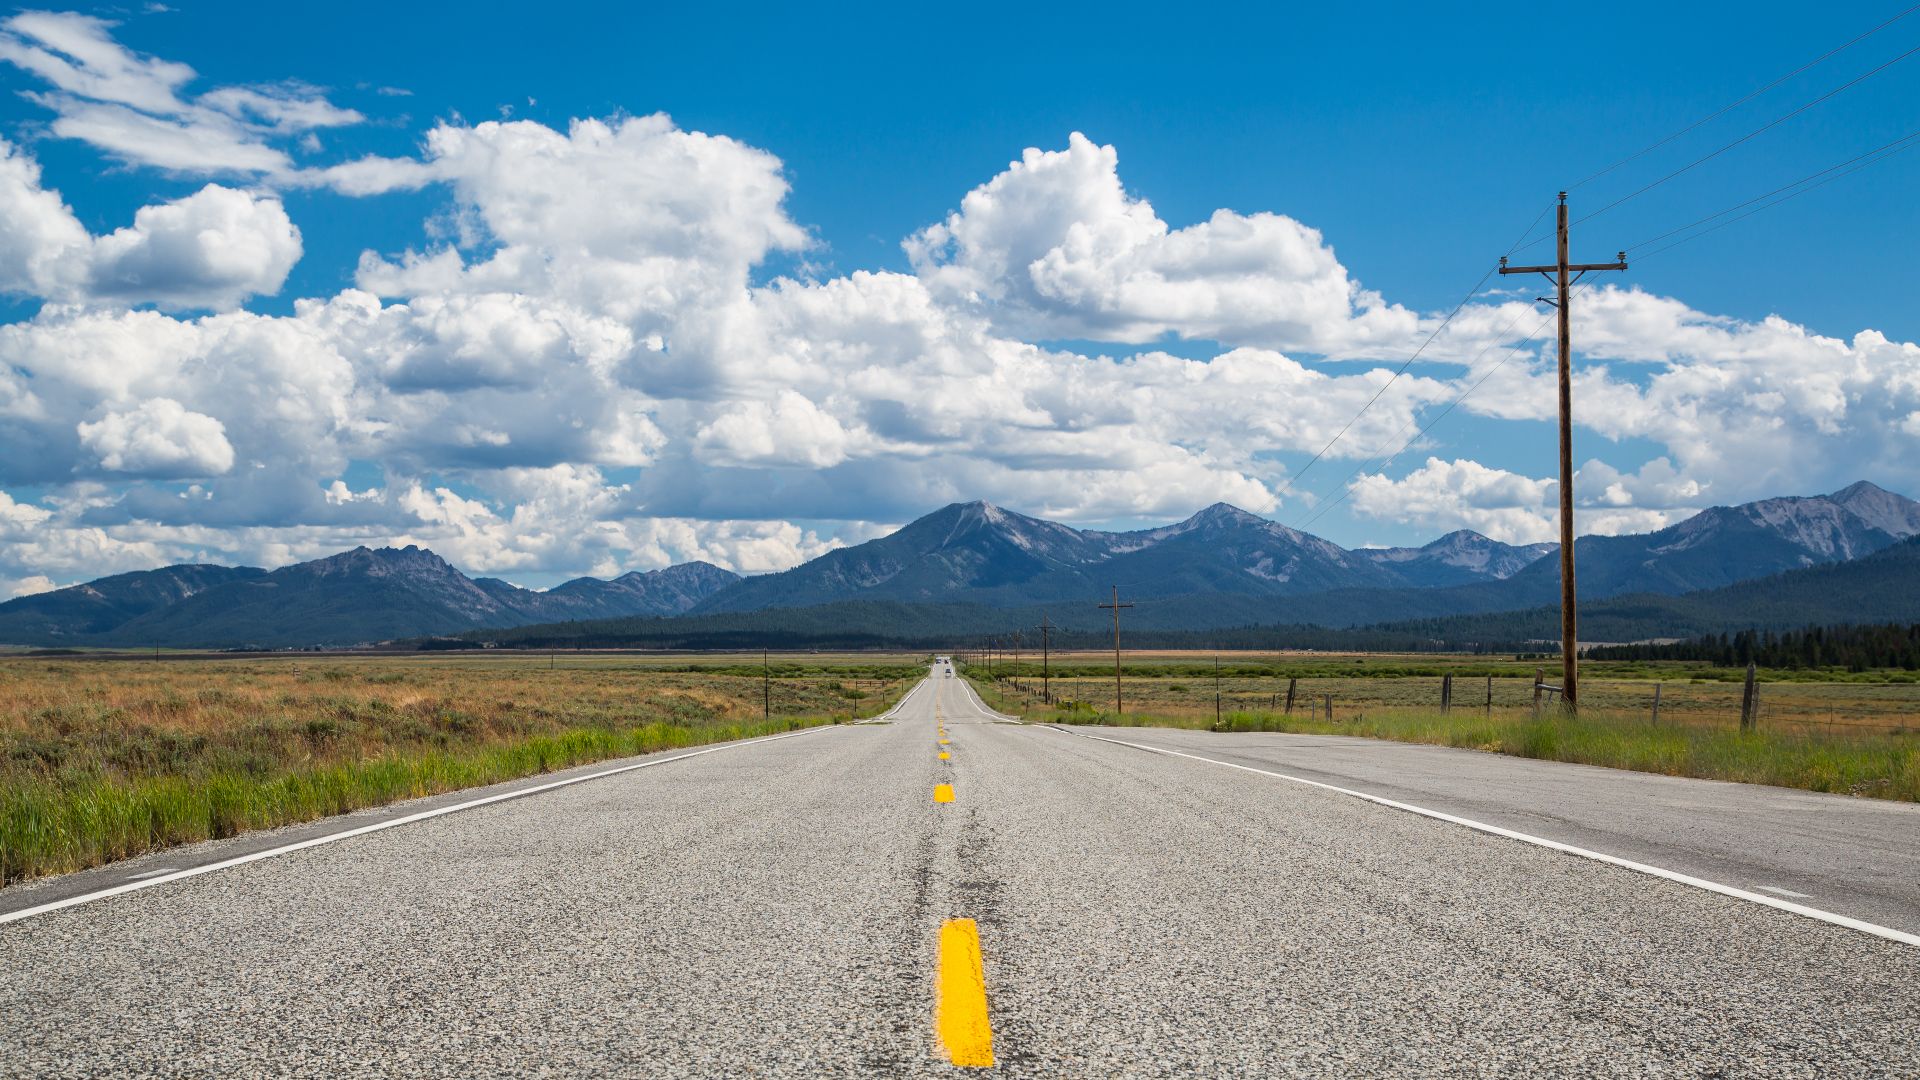
23: Idaho
Road Rage Index: 28.6
Speed-linked fatalities are notable across Idaho’s highway system, and aggressive crash coding appears at moderate levels. ARRI activity is present but not dominant, keeping the state solidly in the middle of the national road rage spectrum.
 GPS from San Francisco, USA, Wikimedia Commons
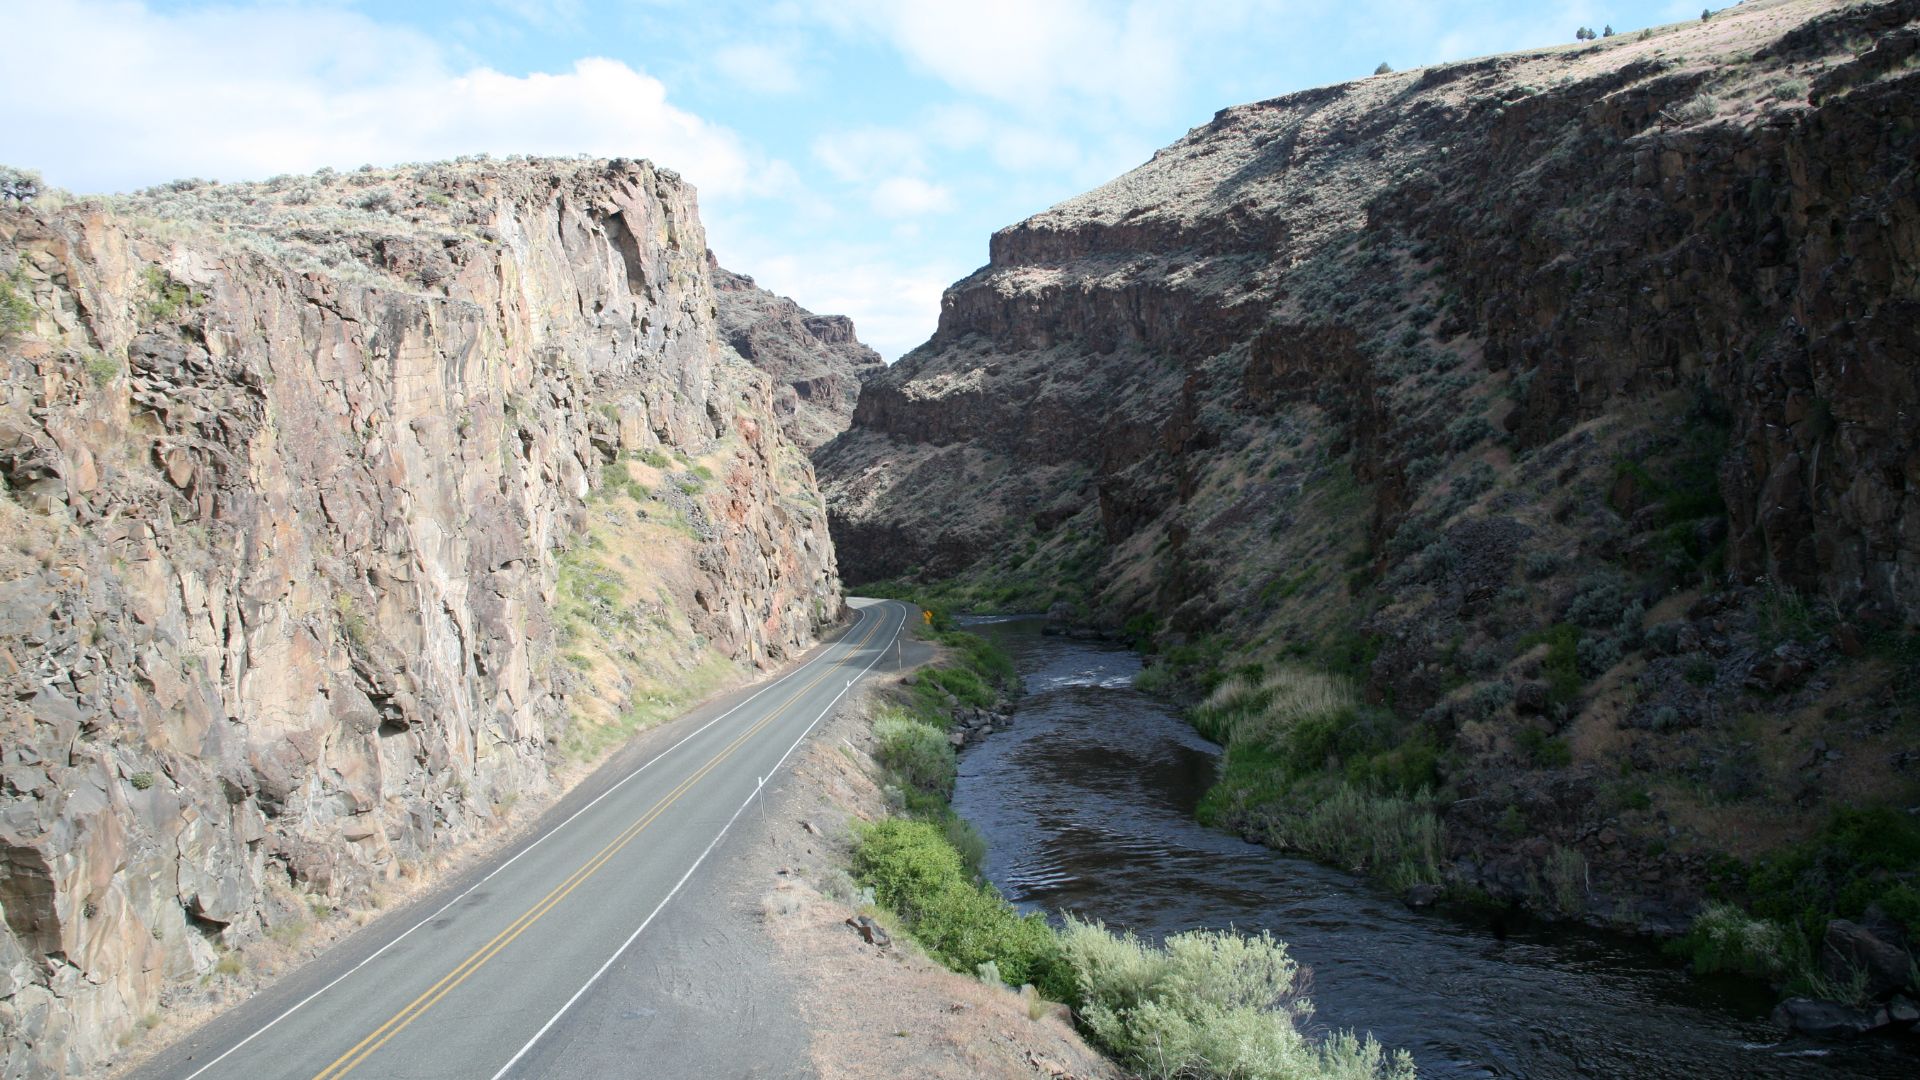
22: Oregon
Road Rage Index: 30.4
A higher speeding share and moderate ARRI rate push Oregon upward in the composite scoring. Aggressive-driving fatal crash indicators add measurable weight, especially in growing urban corridors where traffic density continues to rise.
21: Washington
Road Rage Index: 31.8
Metro congestion around Seattle and Tacoma contributes to moderate ARRI totals and aggressive crash coding. Speeding remains a significant factor in fatal outcomes, nudging Washington into the upper-middle range nationally.

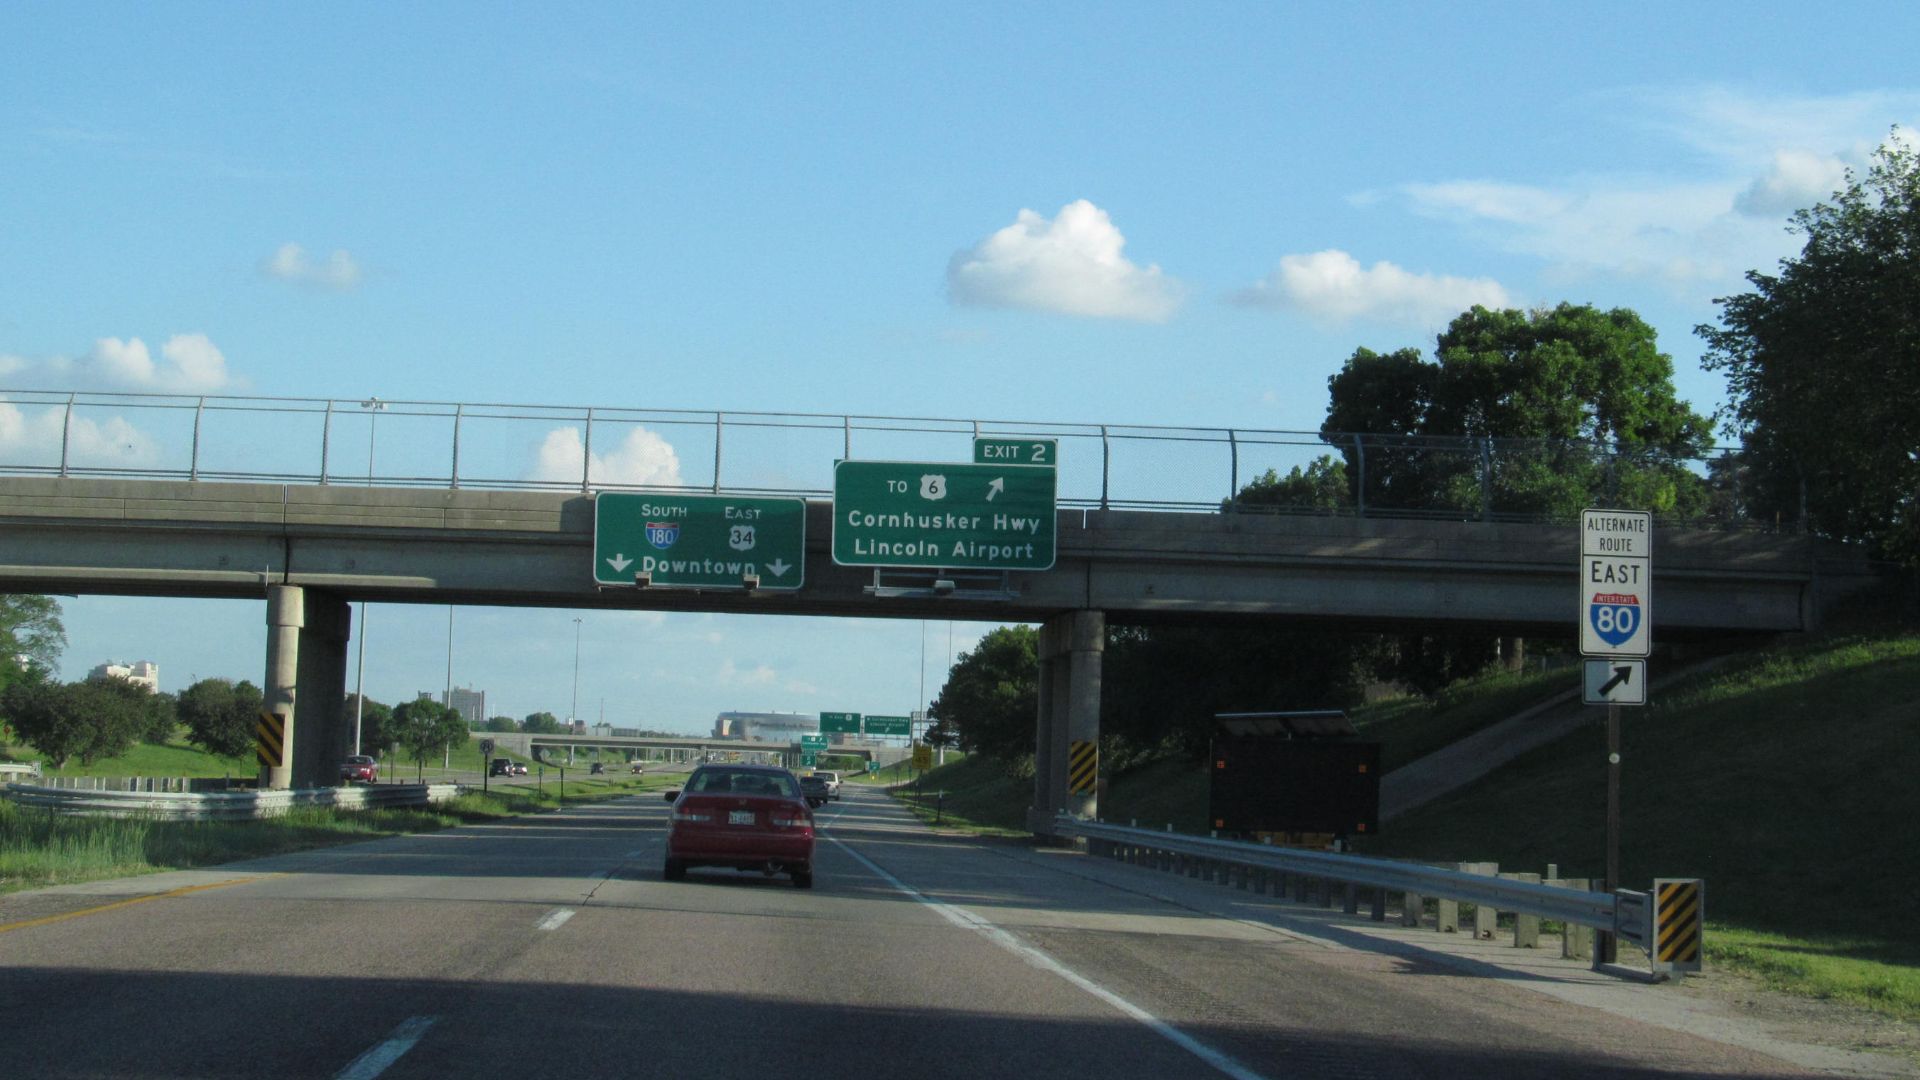
20: Nebraska
Road Rage Index: 33.1
Open highways drive a meaningful speed-related fatality share, but armed roadway confrontations remain relatively controlled compared to higher-ranking states. Aggressive fatal crash factors sit near national averages across the three-year window.
 Doug Kerr from Albany, NY, United States, Wikimedia Commons
19: Arizona
Road Rage Index: 36.7
Rapid metro growth increases both ARRI presence and aggressive-driving crash indicators statewide. The Western region’s slightly higher self-reported aggression rates add incremental weight to Arizona’s overall composite score.

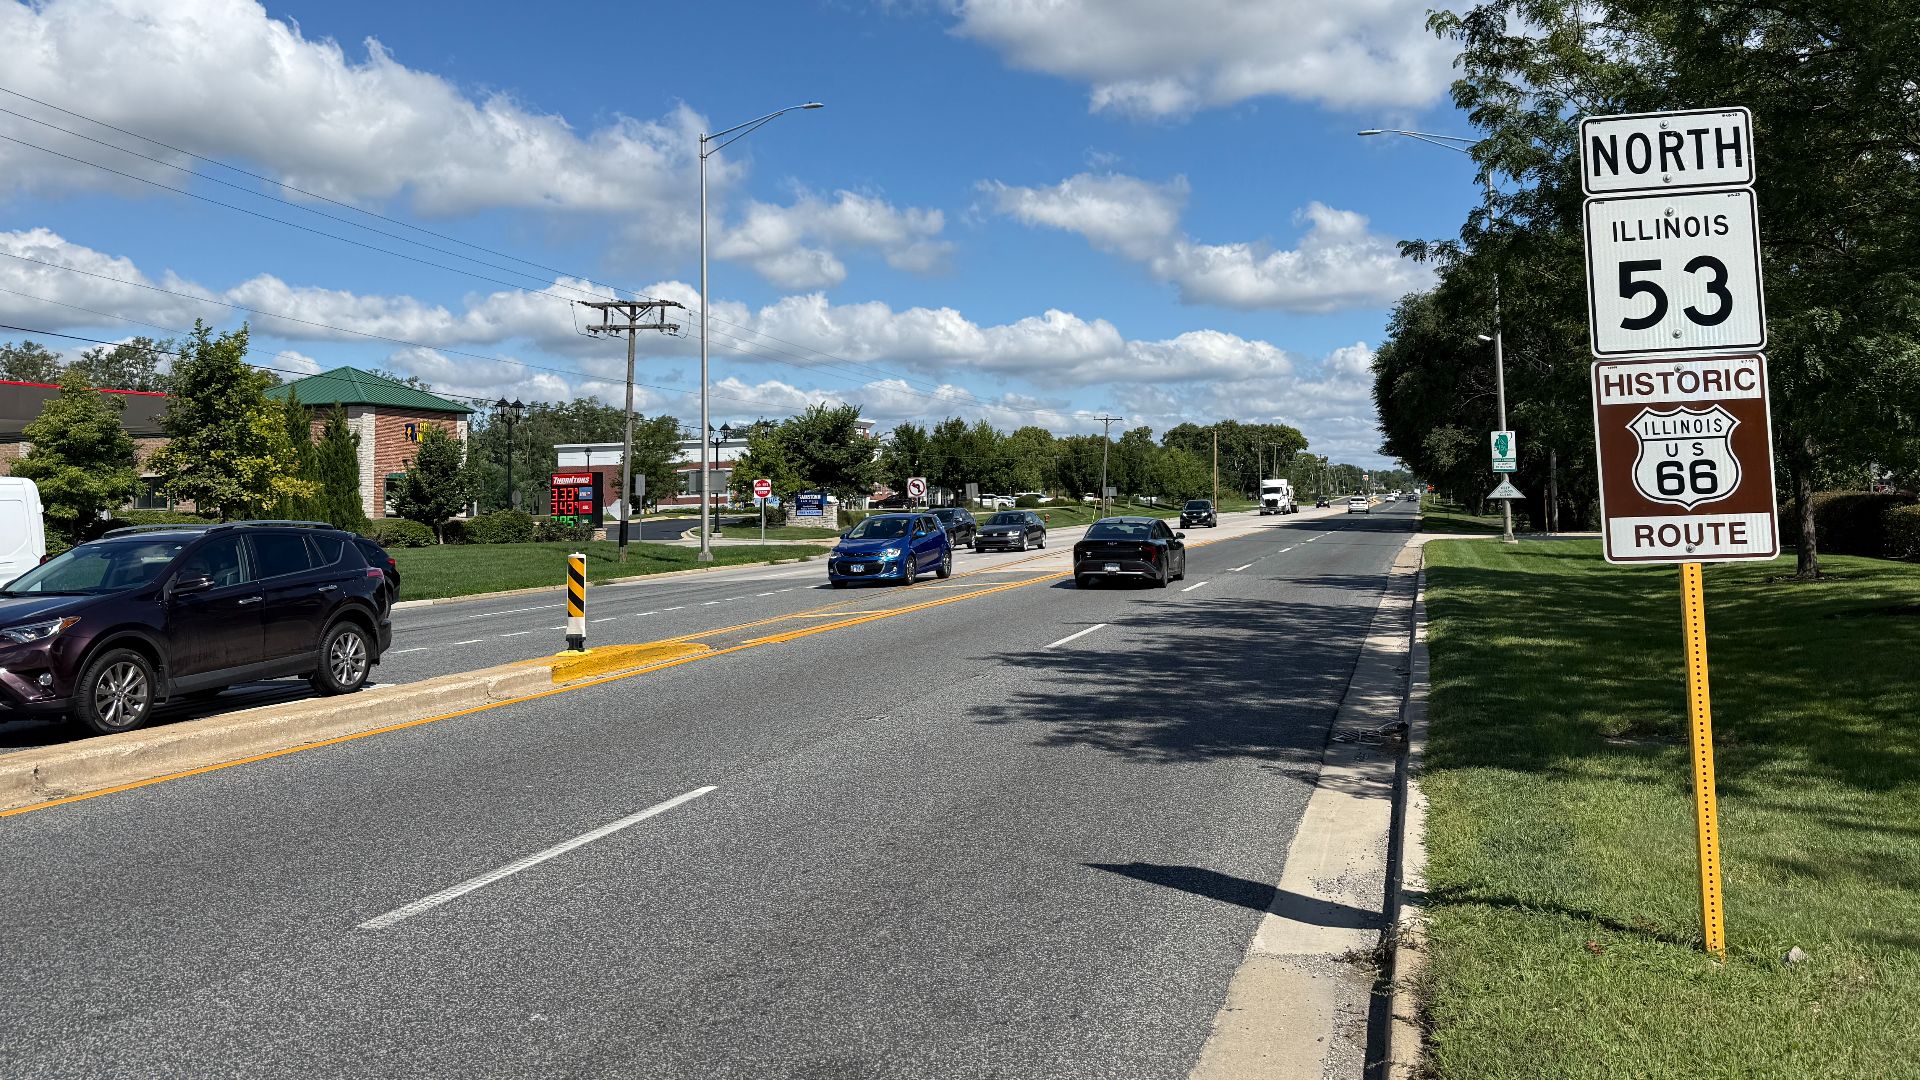
18: Illinois
Road Rage Index: 38.9
Chicago-area traffic pressure elevates confrontation risk and aggressive crash coding across the state. ARRI totals are moderate but significant in volume, contributing meaningfully to Illinois’ upper-middle ranking.
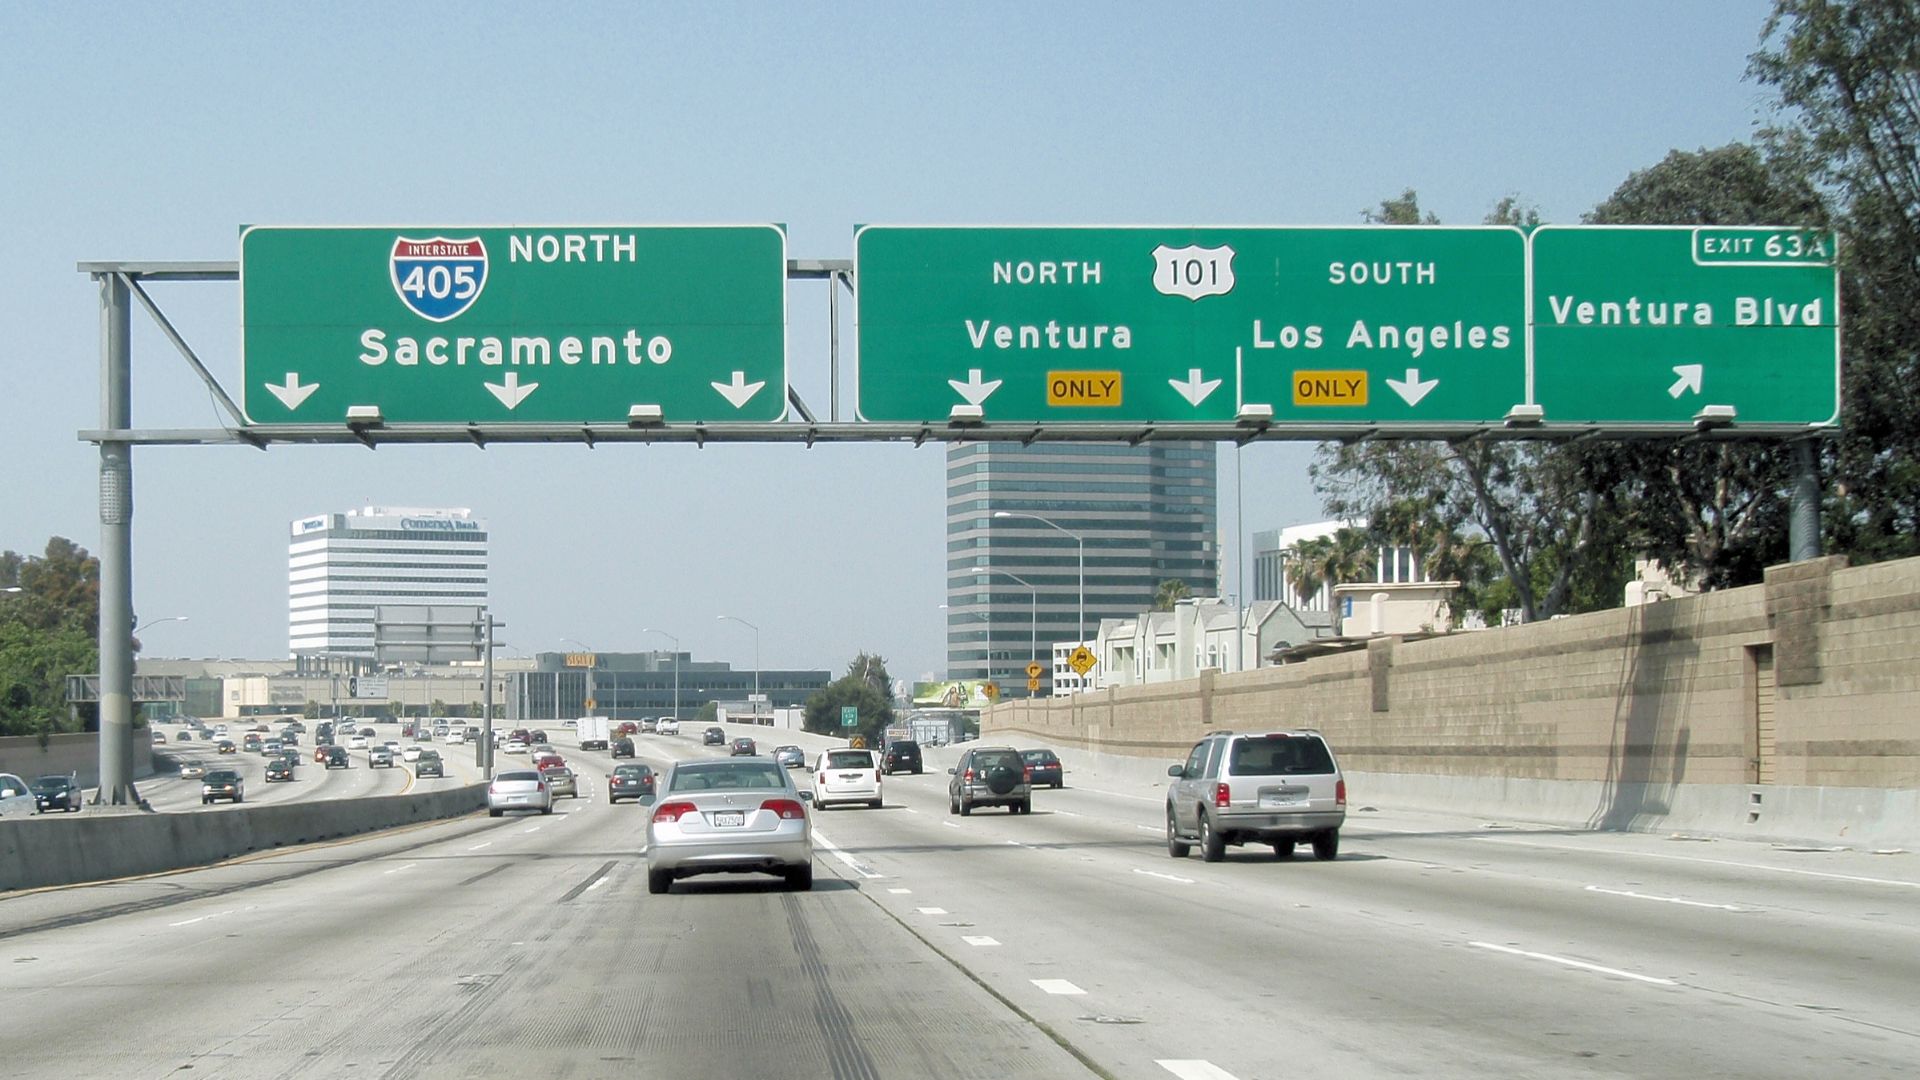
17: California
Road Rage Index: 41.3
High population density drives ARRI volume and aggressive fatal crash factors in major urban centers. Even with only moderate speeding share, the state’s exposure and frequency of incidents elevate its overall index position.
 The original uploader was Coolcaesar at English Wikipedia., Wikimedia Commons
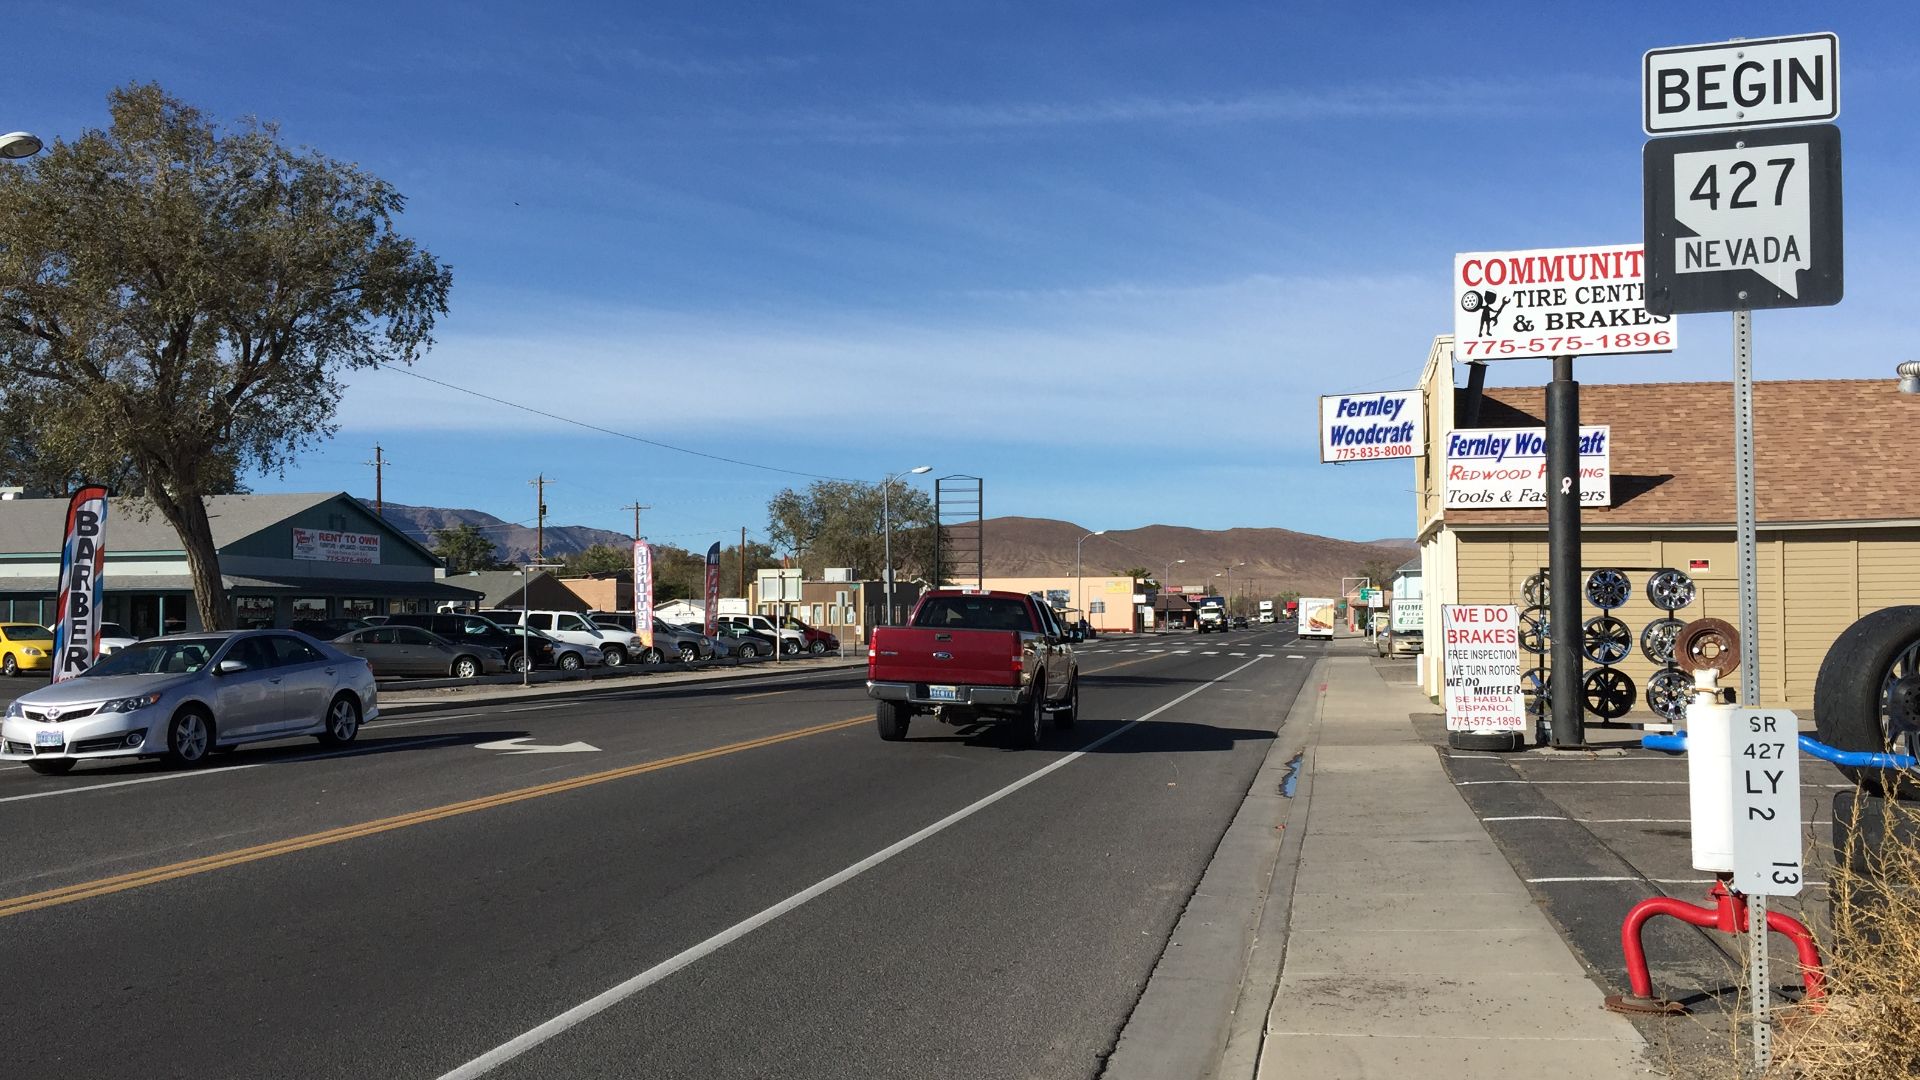
16: Nevada
Road Rage Index: 44.8
Aggressive-driving fatal crash rates are high relative to population size, and ARRI presence is consistently measurable. Speeding plays a major role in fatal incidents, particularly on major desert corridors.
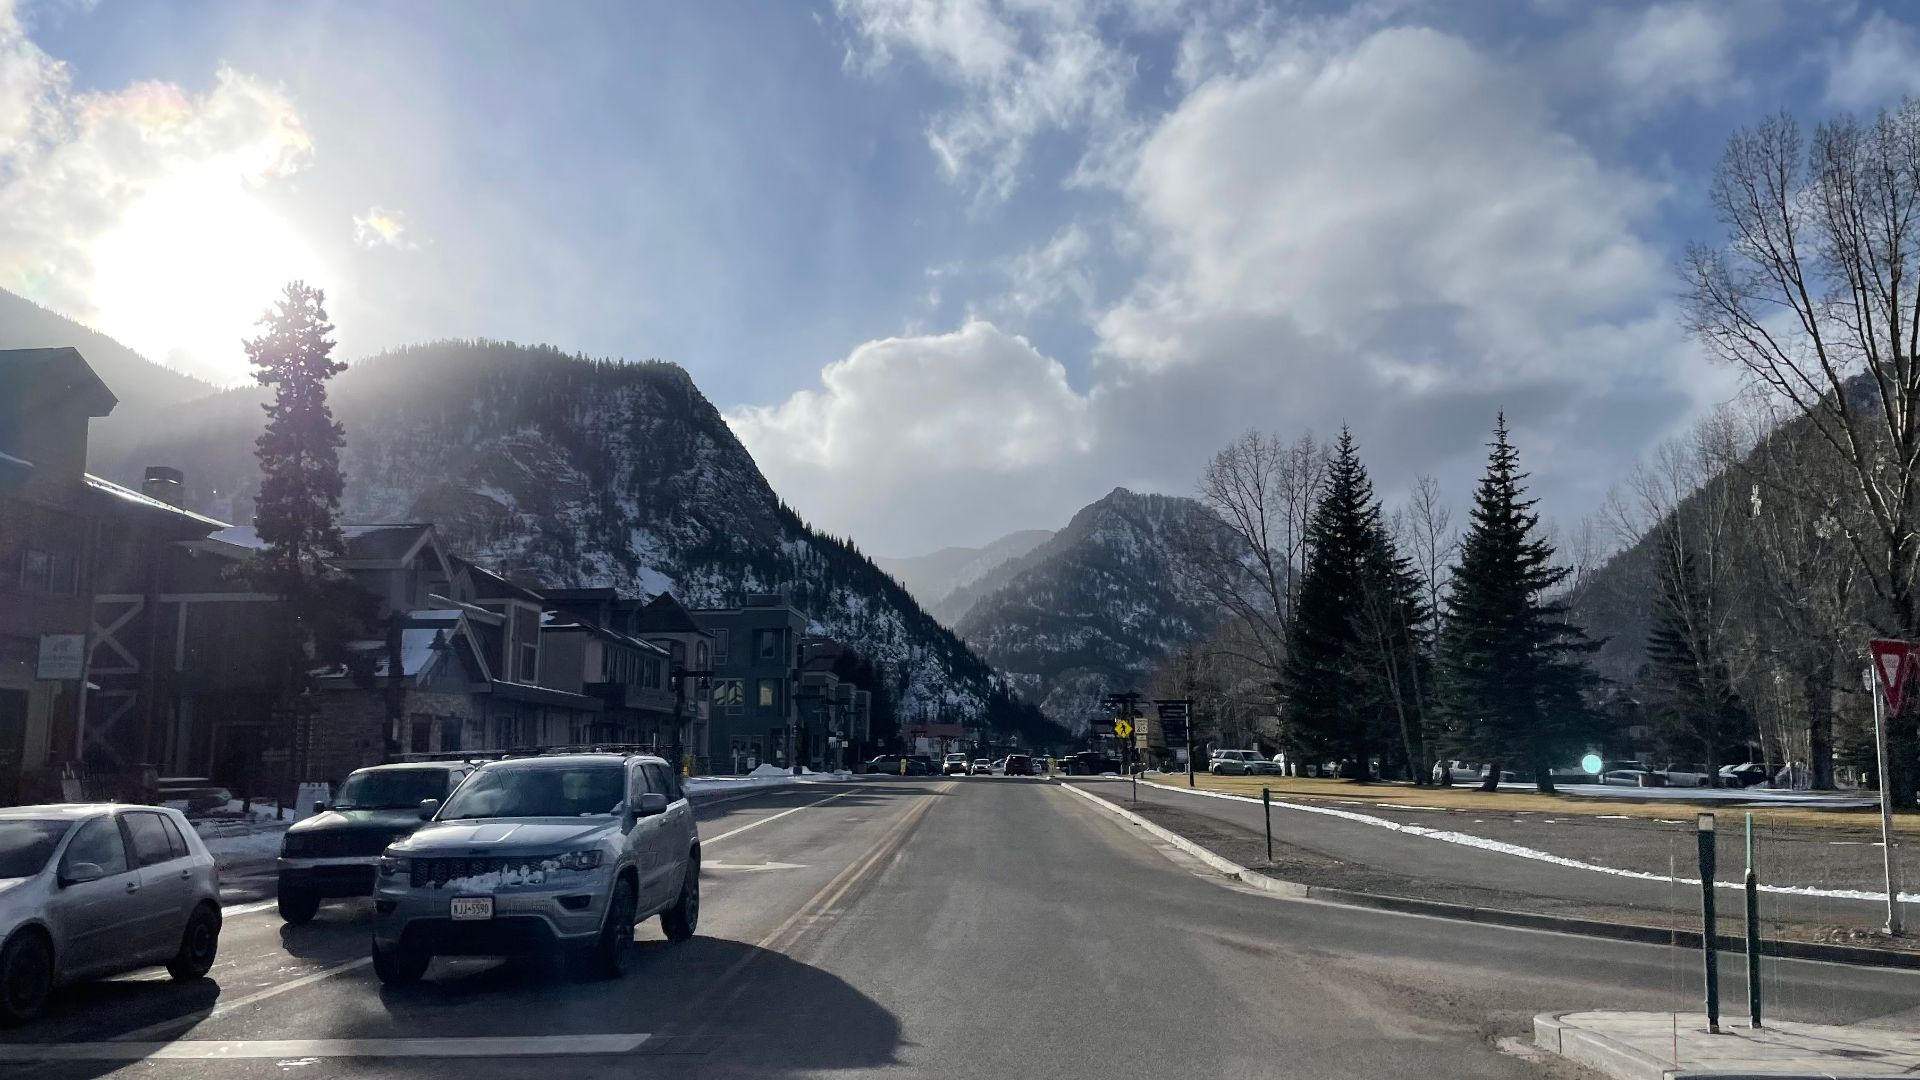
15: Colorado
Road Rage Index: 46.9
Mountain highways and urban congestion combine with moderate-to-high ARRI levels across the state. Aggressive crash coding and speeding share together push Colorado firmly into the upper half of the rankings.
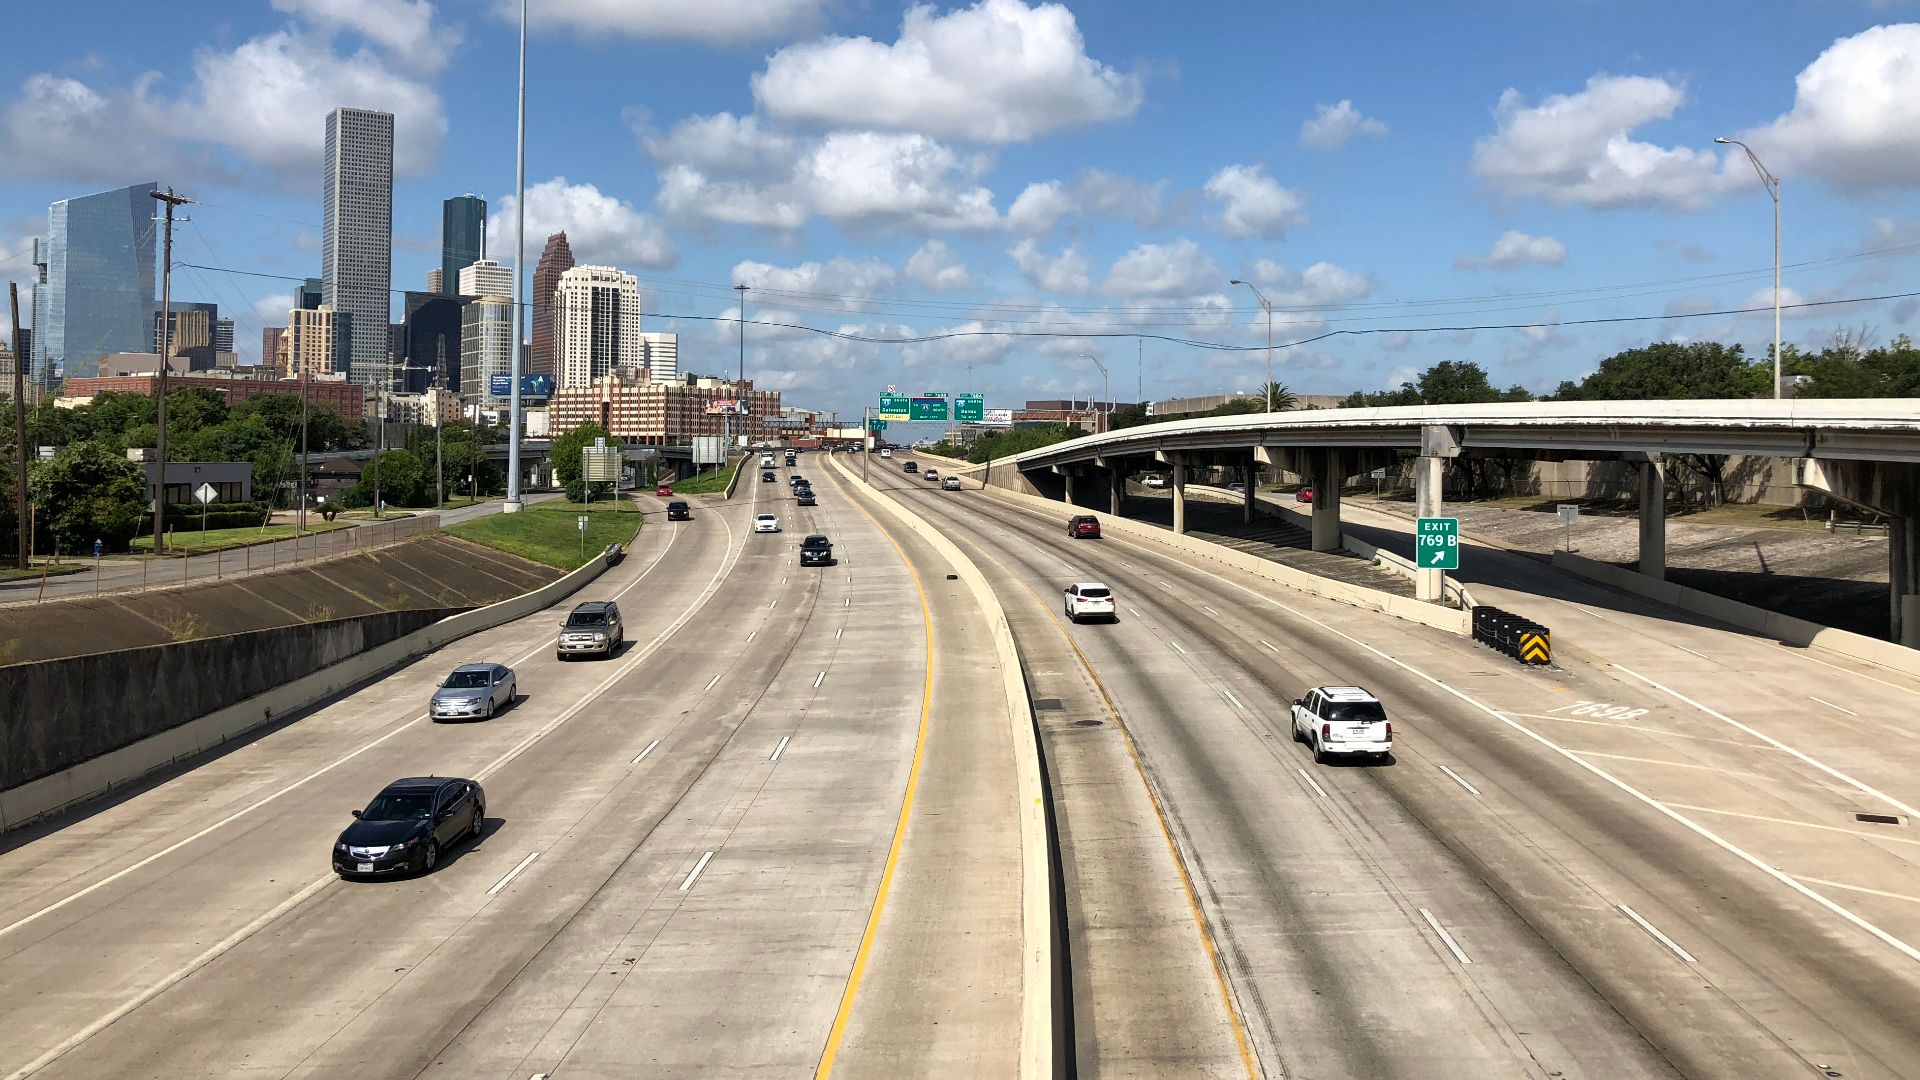
14: Texas
Road Rage Index: 49.7
High ARRI totals and aggressive fatal crash factors elevate Texas significantly in the composite. Speed-related fatalities remain persistently high across major interstate corridors and densely populated metro regions.
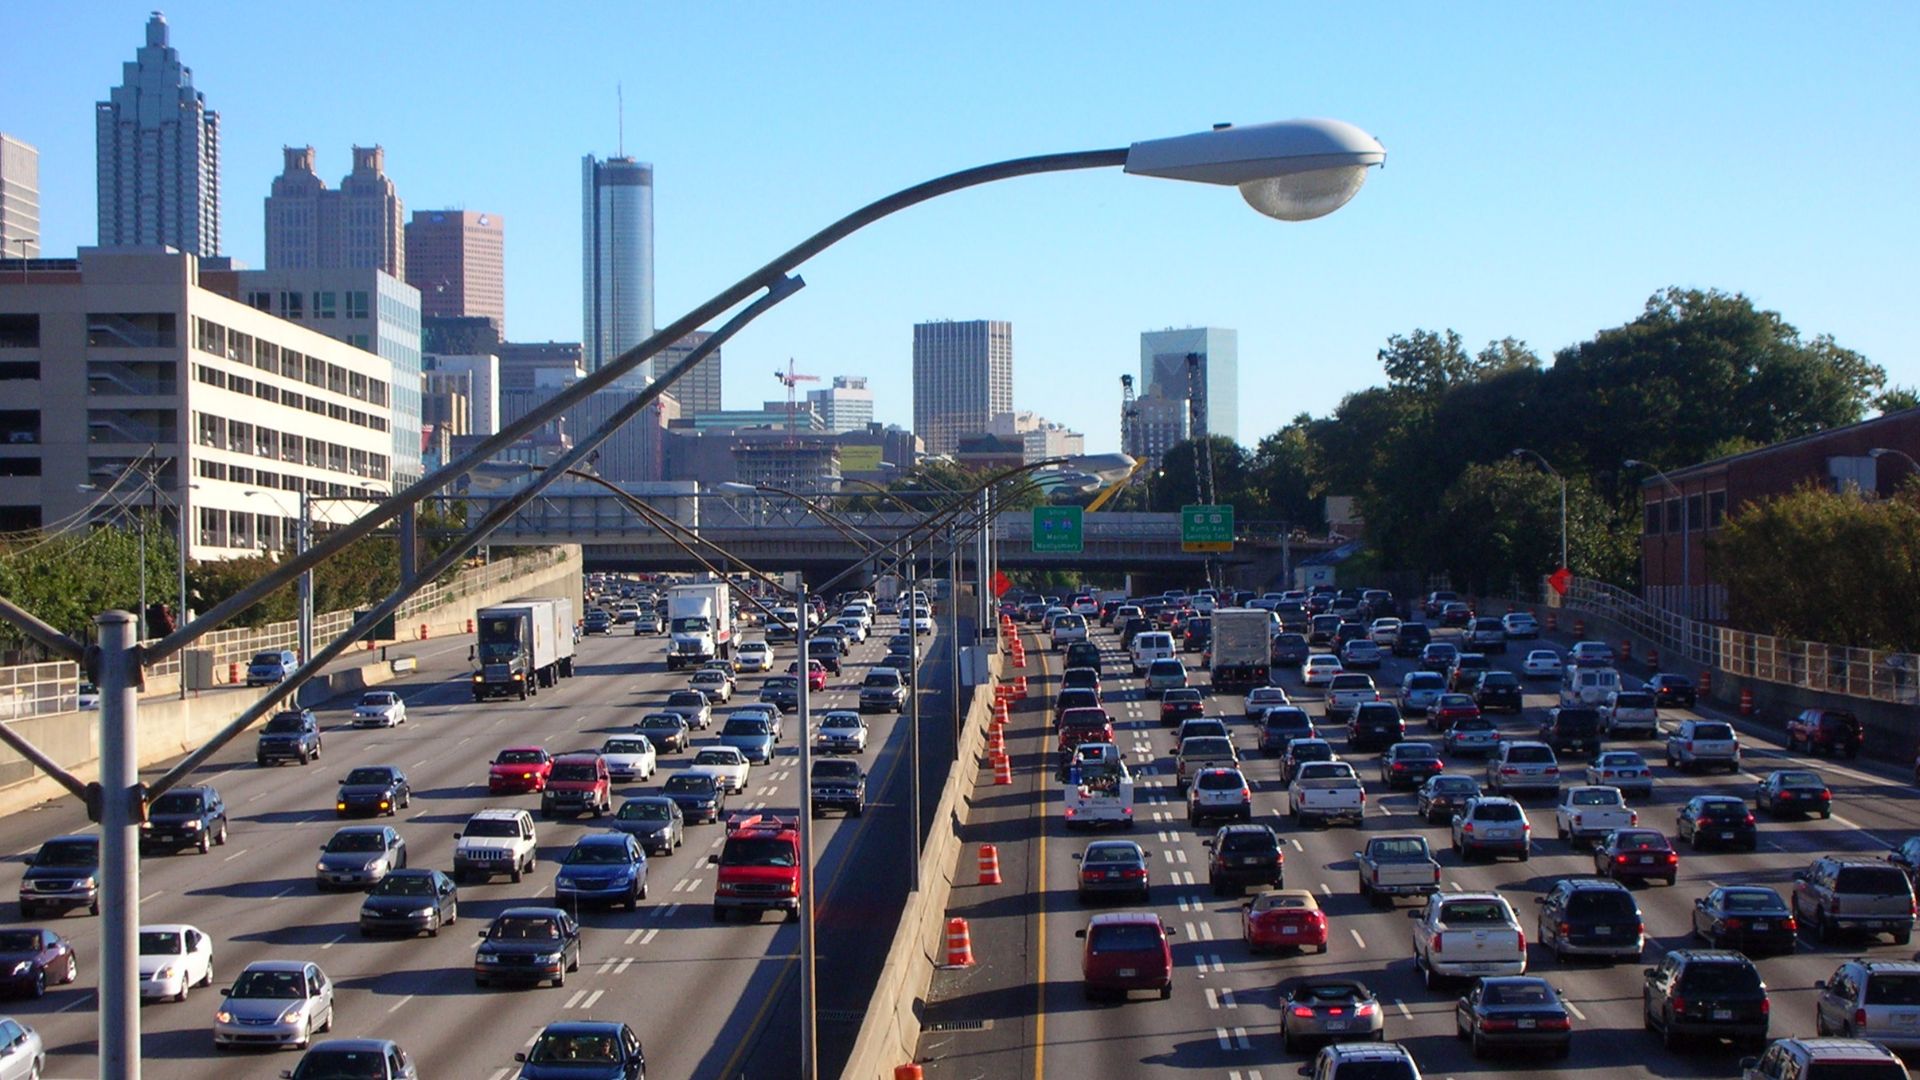
13: Georgia
Road Rage Index: 52.4
Urban driving stress fuels both confrontation incidents and aggressive fatal crash coding throughout Georgia. The Southern region’s higher self-reported aggression rates add measurable lift to the state’s overall score.
 Atlantacitizen at English Wikipedia, Wikimedia Commons
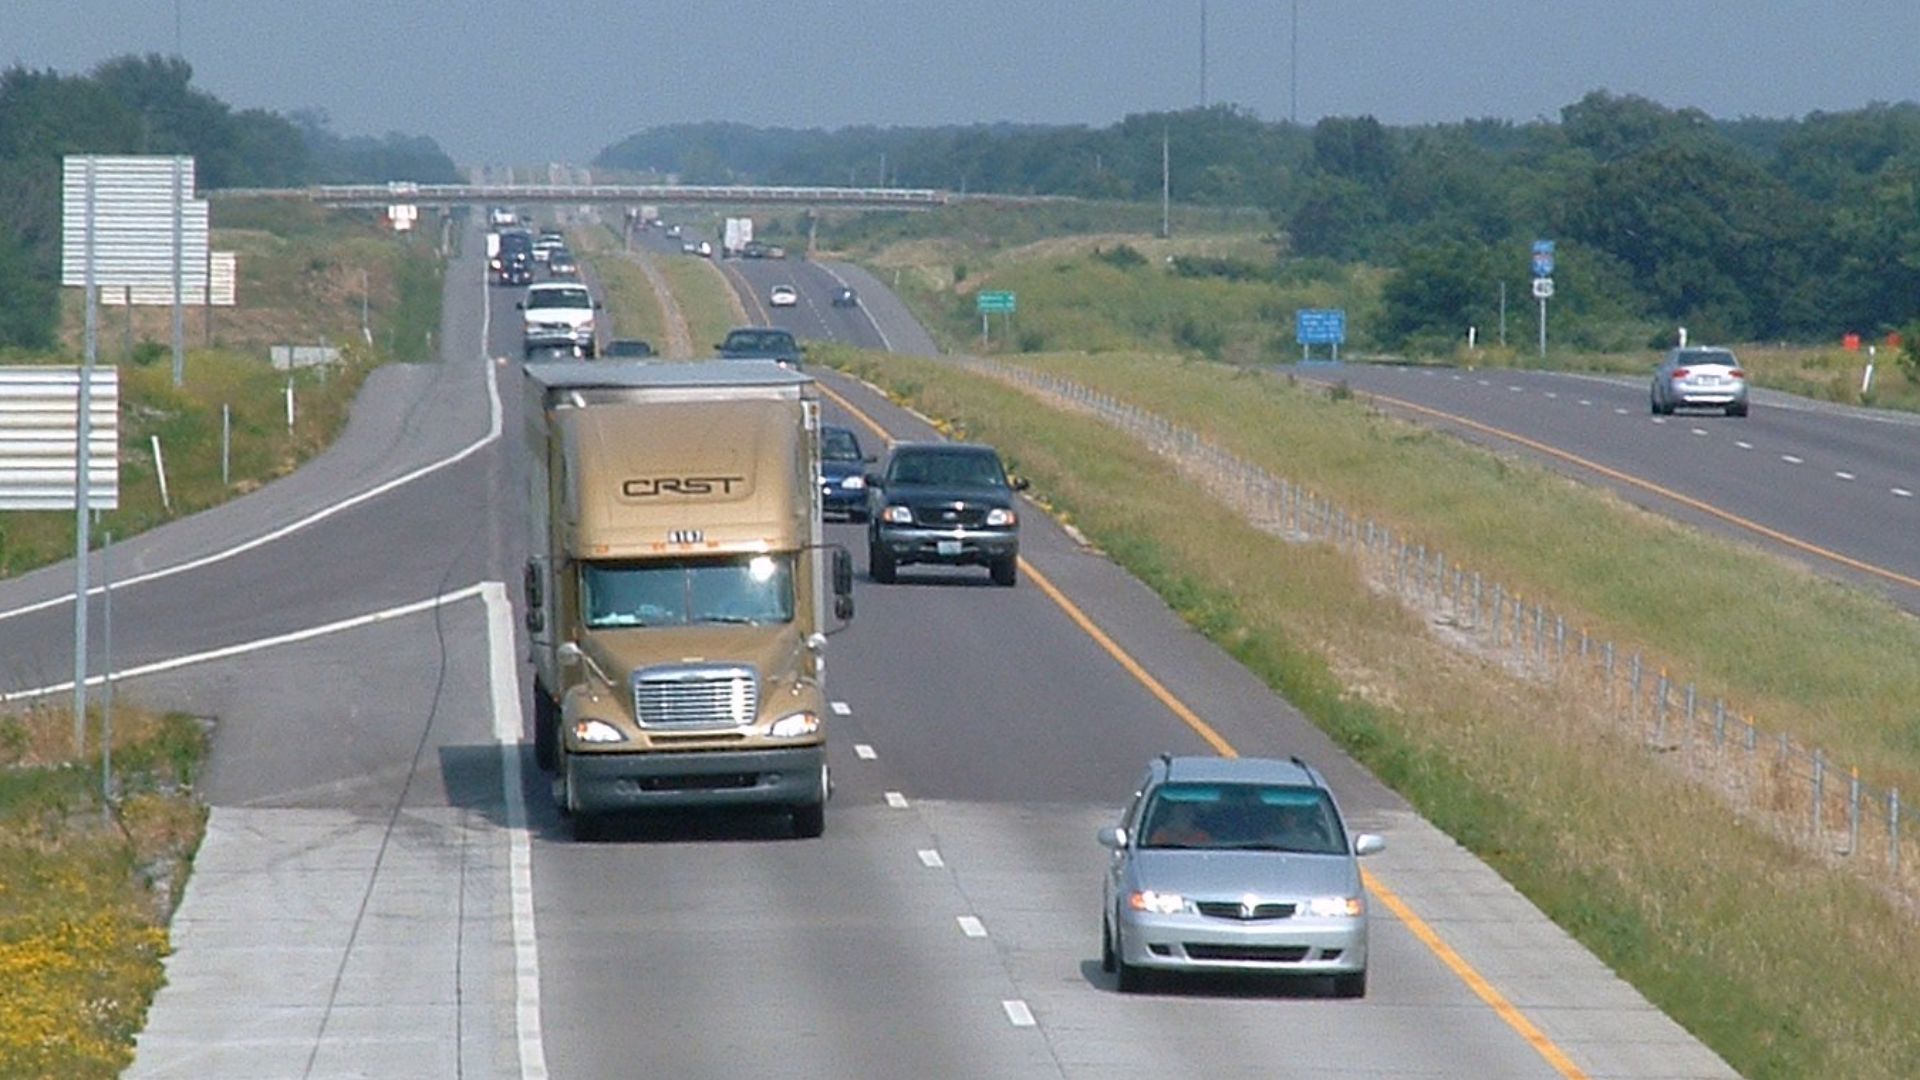
12: Missouri
Road Rage Index: 55.8
Speeding-related fatality share ranks among the higher states nationally, and ARRI contributes meaningfully to the overall composite. Aggressive crash coding reinforces the pattern across both rural and metro areas.
11: South Carolina
Road Rage Index: 58.6
Very high aggressive-driving fatal crash rates combine with elevated ARRI totals over the three-year window. Speeding further intensifies fatal outcomes, pushing South Carolina firmly into the top third of states.
 Thomsonmg2000, Wikimedia Commons
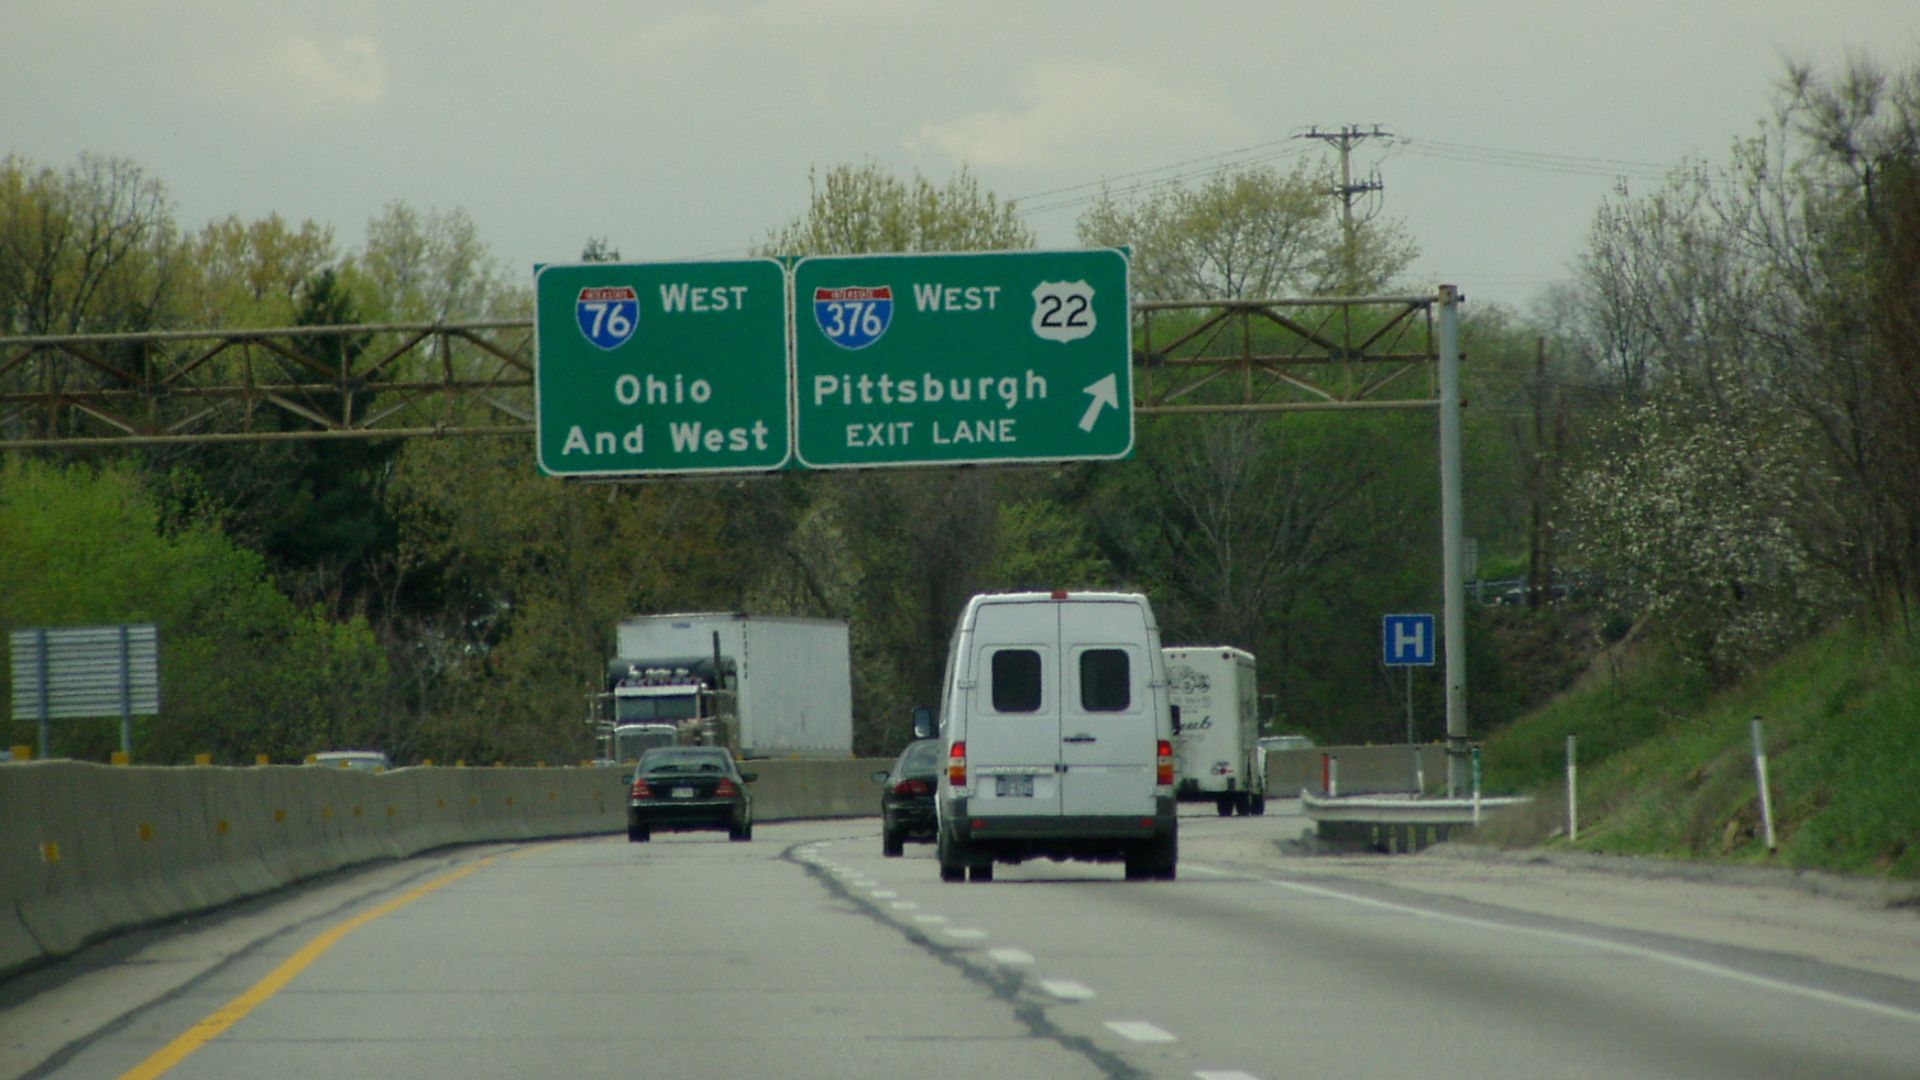
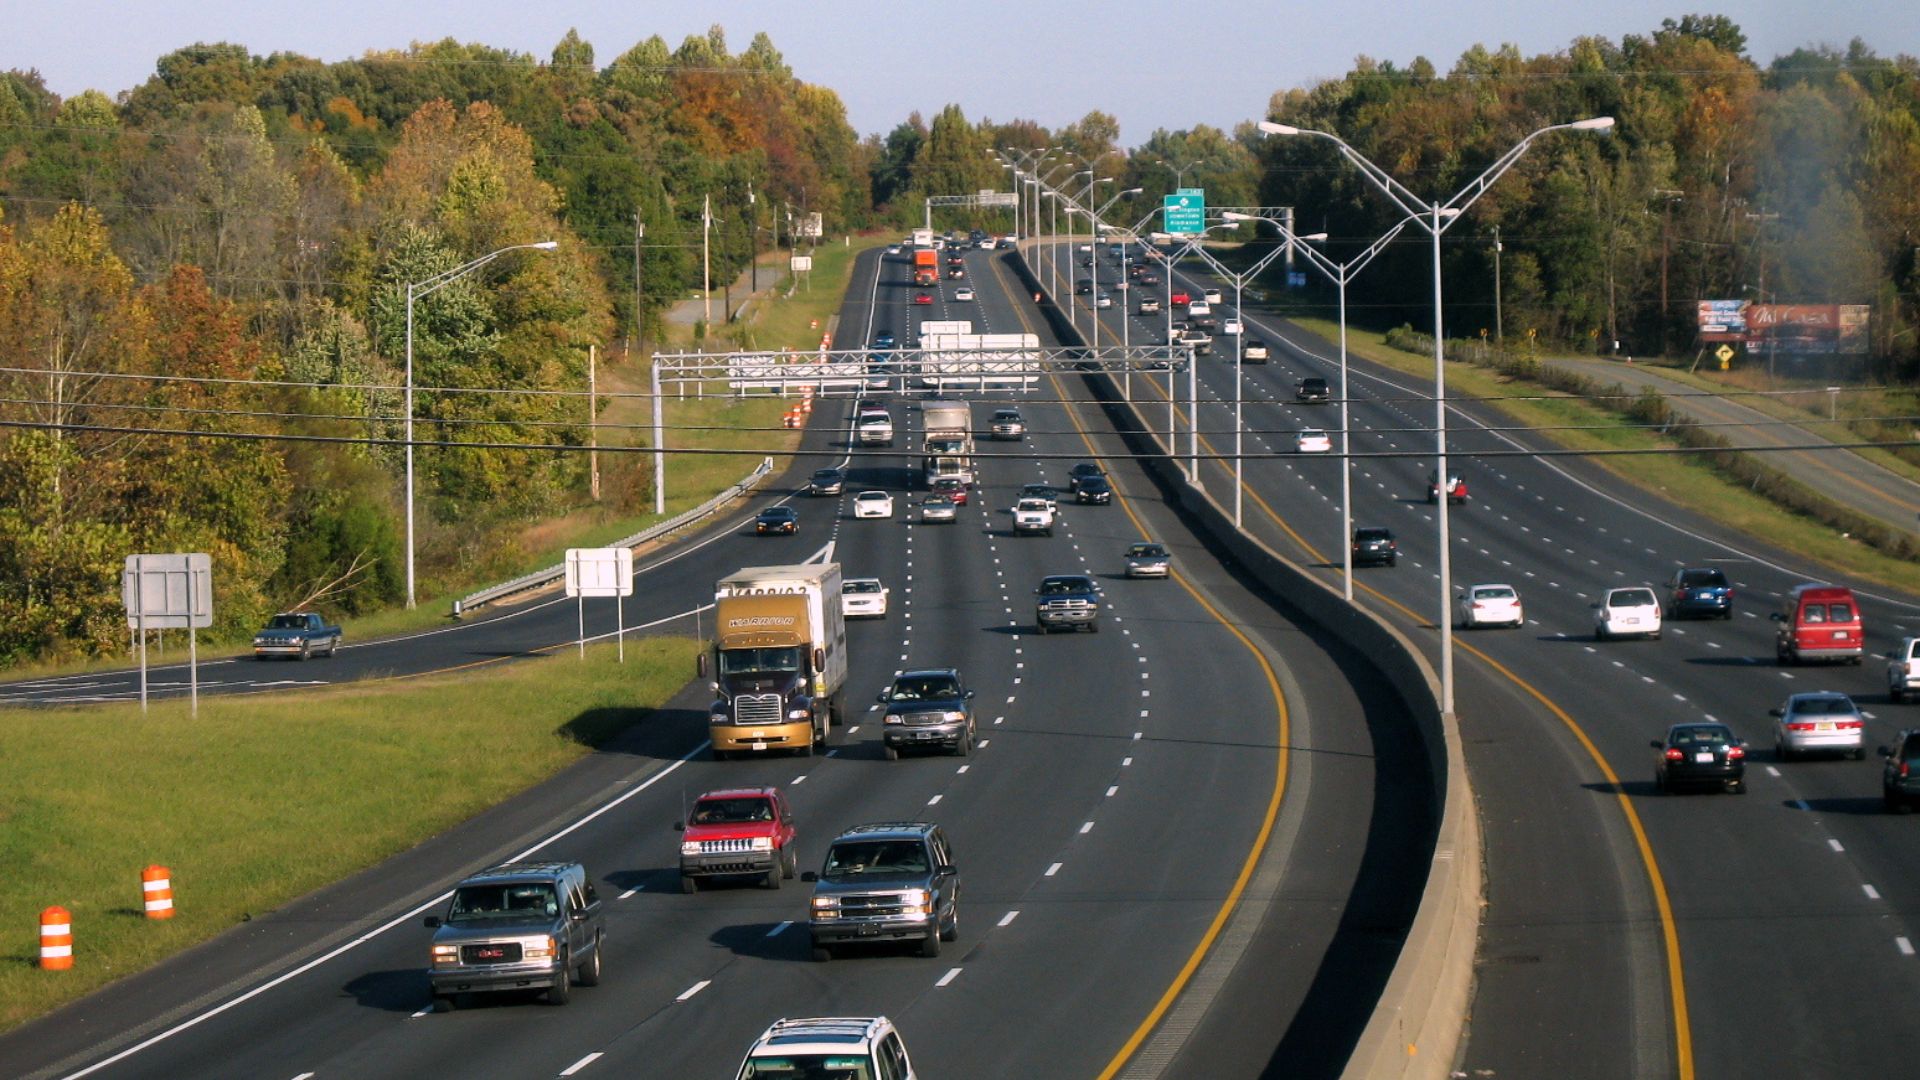
10: Pennsylvania
Road Rage Index: 61.2
One of the highest speeding fatality shares nationally, paired with steady ARRI presence across the state. Aggressive crash factors remain consistently elevated, particularly along heavily traveled corridors.
 Jeffrey M. Vinocur, Wikimedia Commons
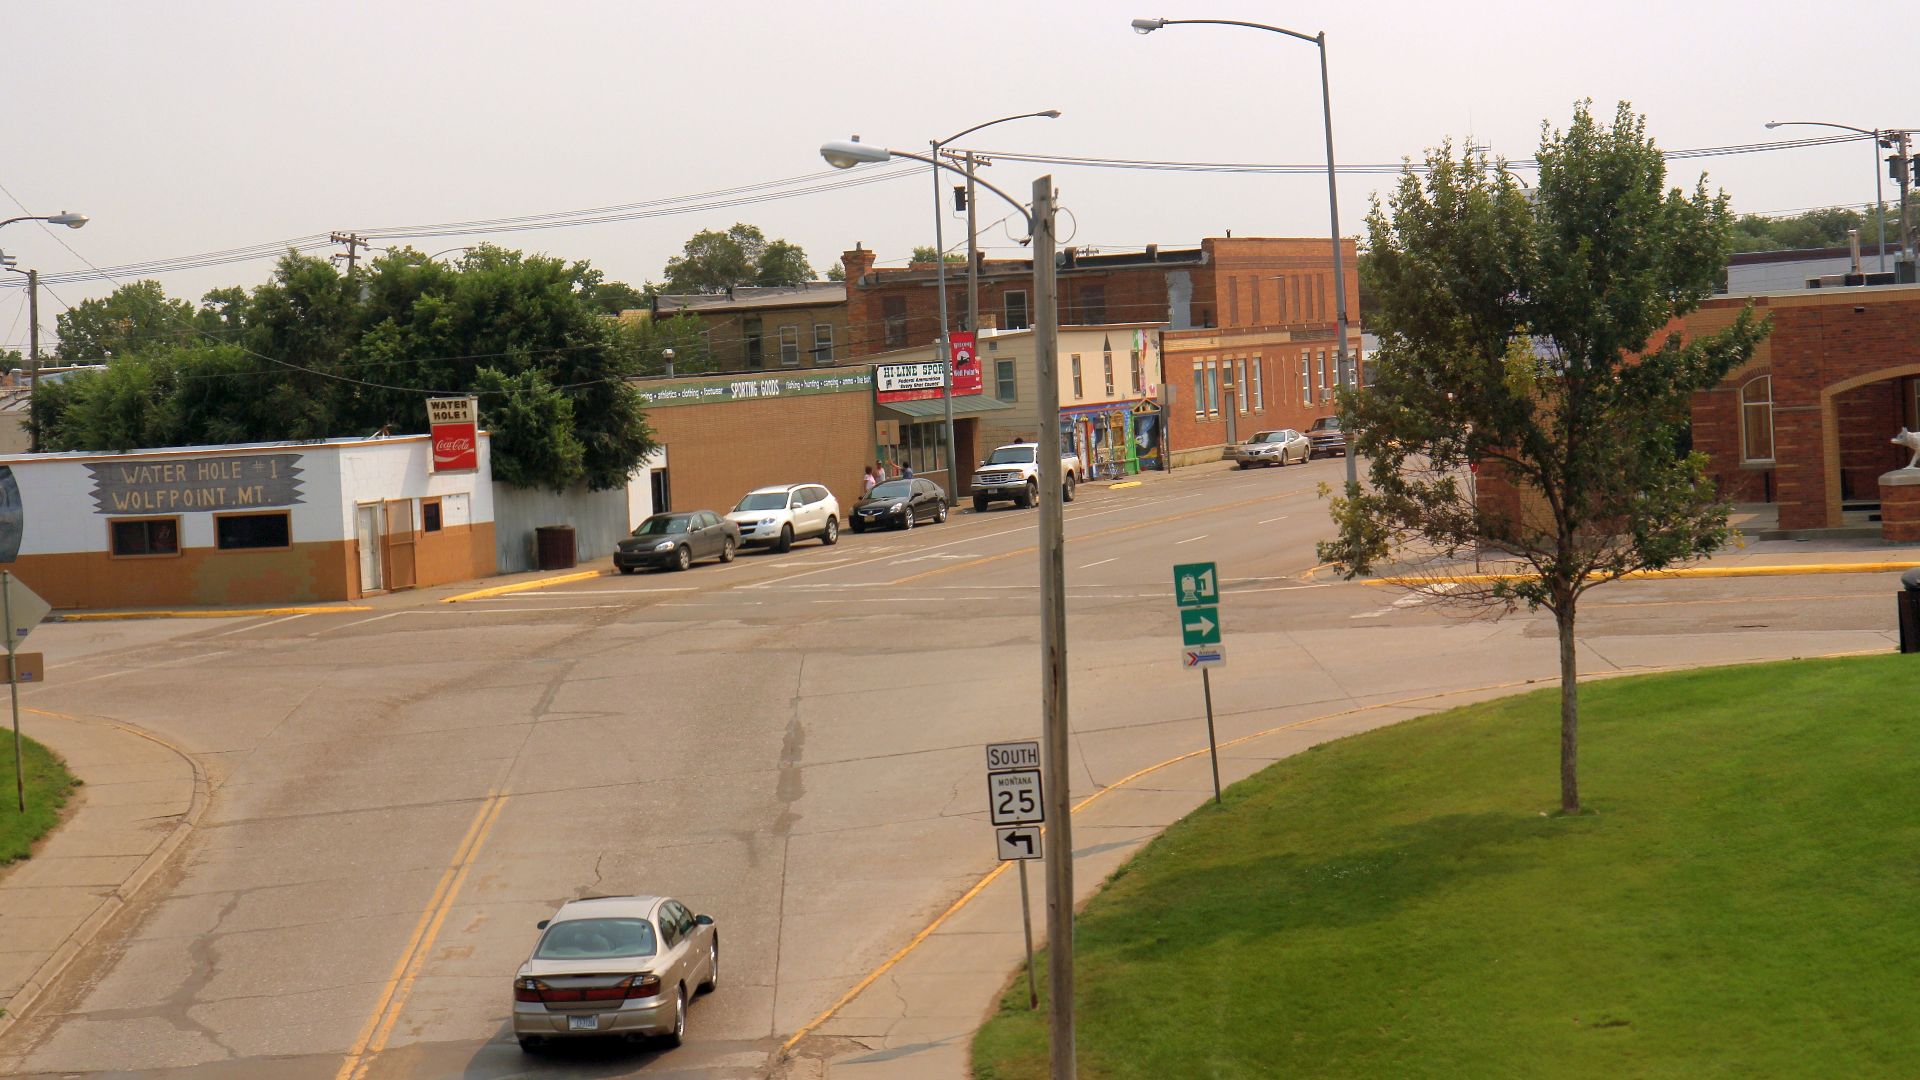
9: Montana
Road Rage Index: 64.9
Extreme speeding share and high aggressive fatal crash coding drive Montana upward in the rankings. Even adjusted for population, ARRI remains significant relative to overall fatal crash volume.
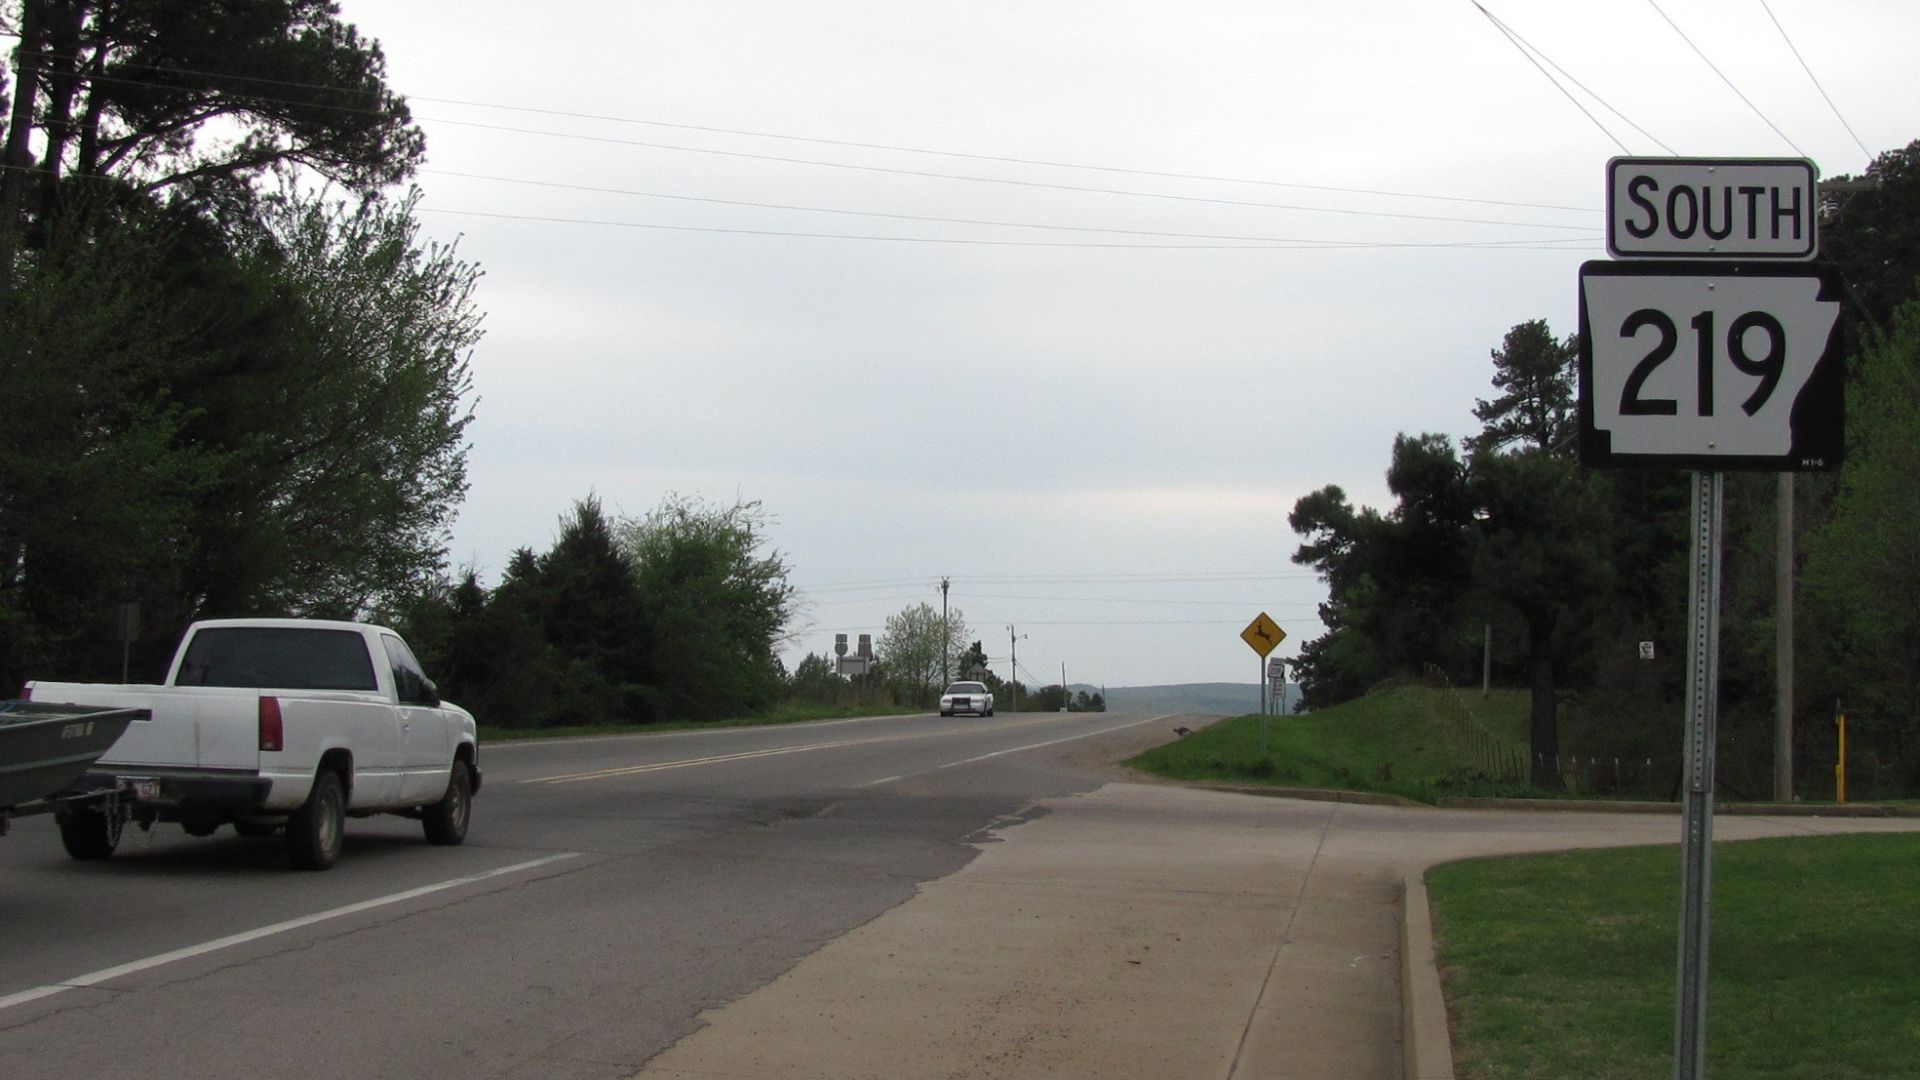
8: Arkansas
Road Rage Index: 68.1
Aggressive fatal crash factors rank near the top nationally, supported by elevated ARRI rates and strong speed involvement. The combination creates a consistently high composite score.
 John Phelan, Wikimedia Commons
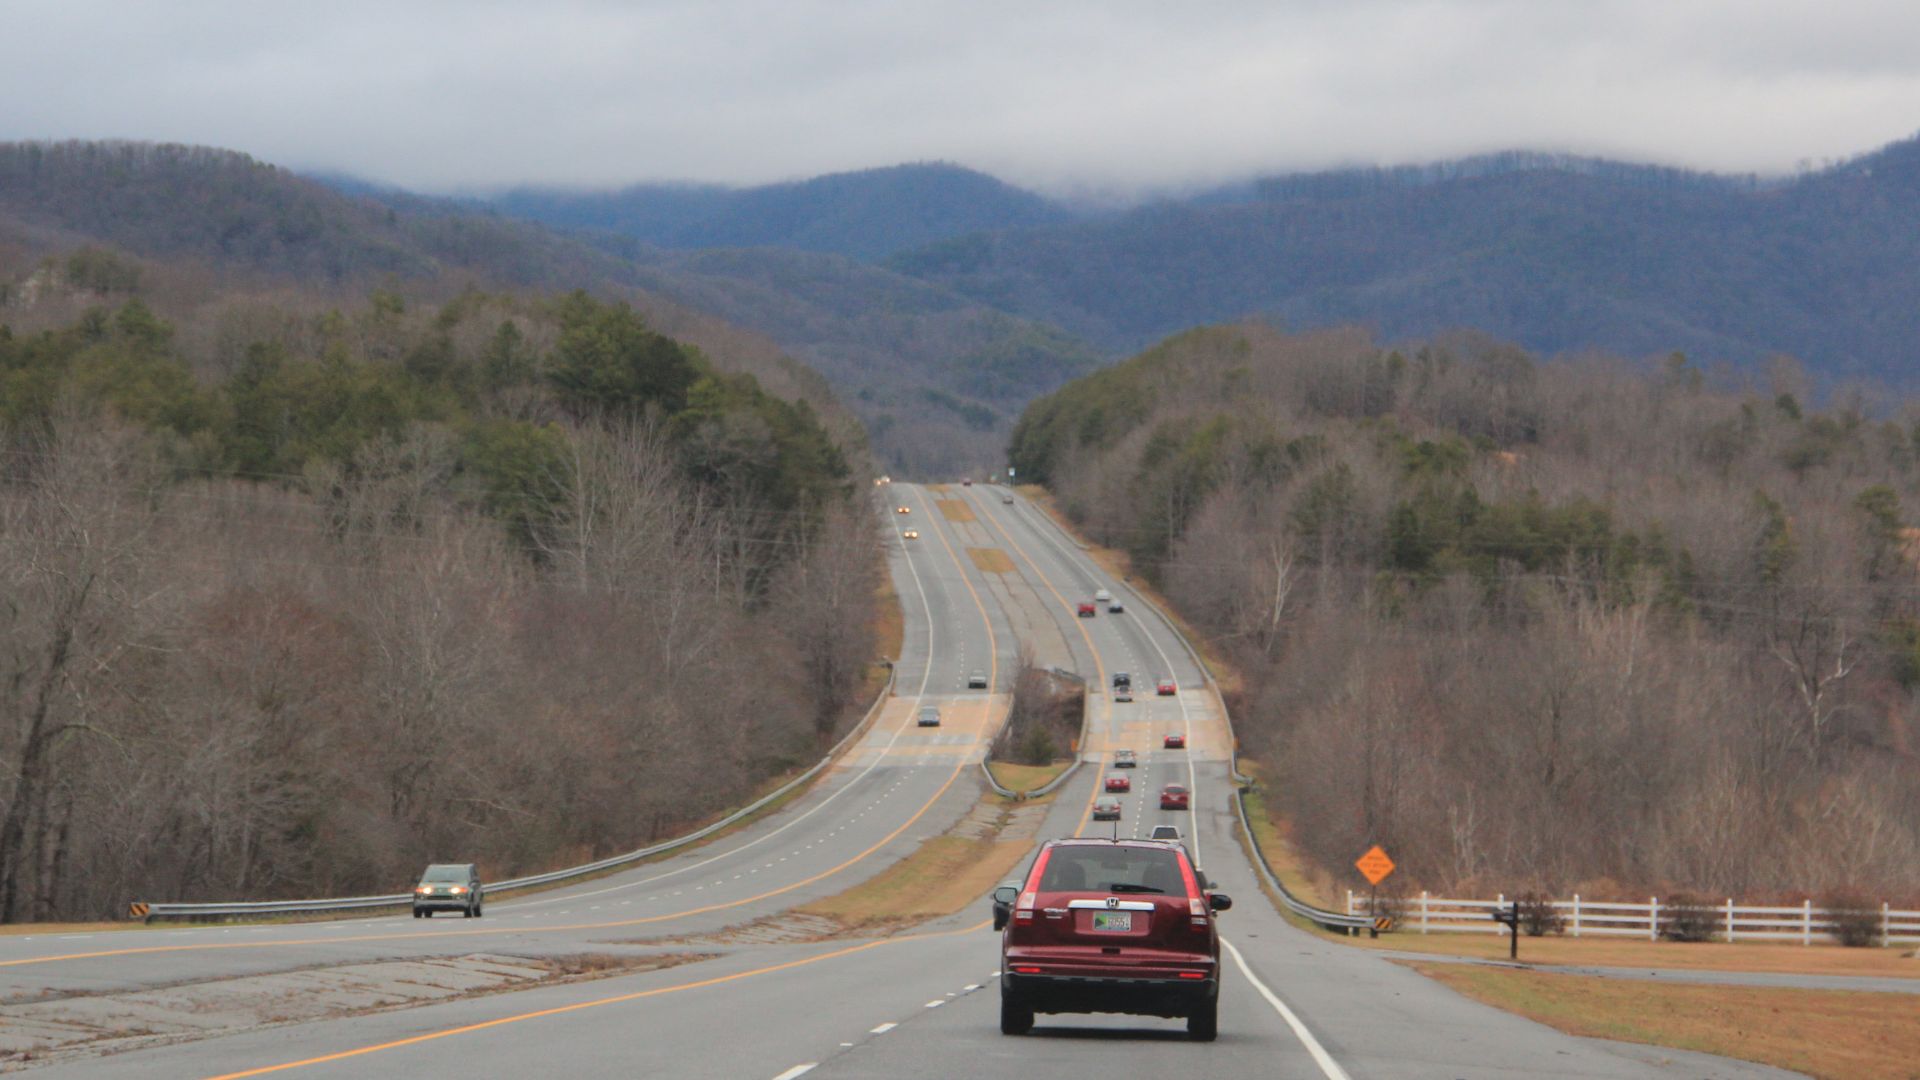
7: North Carolina
Road Rage Index: 71.6
A very high speeding fatality share and strong ARRI presence combine with aggressive crash coding across the state. Regional aggression weighting further boosts North Carolina’s overall index position.
 MPD01605~commonswiki, Wikimedia Commons
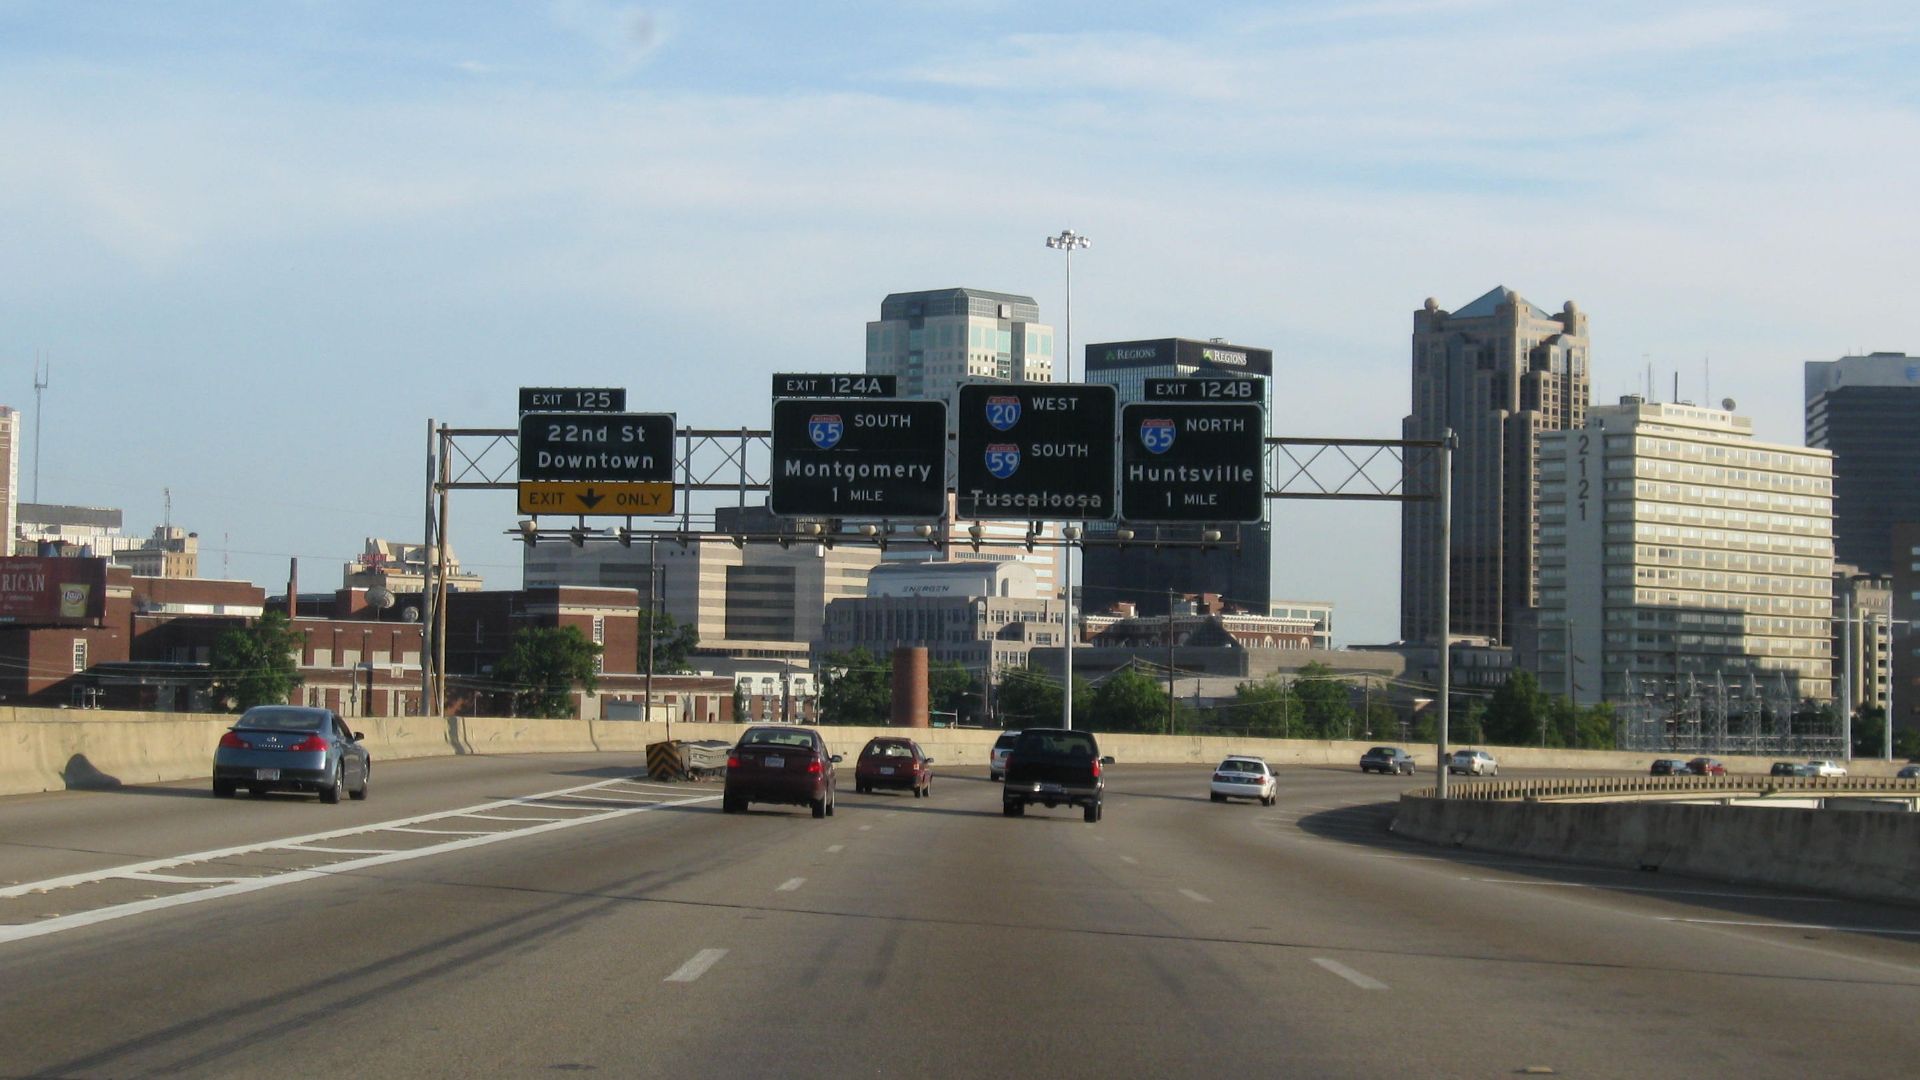
6: Alabama
Road Rage Index: 74.2
Very high ARRI and aggressive-driving fatal crashes push Alabama near the top of the rankings. Speeding remains a major contributing factor to fatal outcomes statewide.
 Airtuna08 (talk), Wikimedia Commons
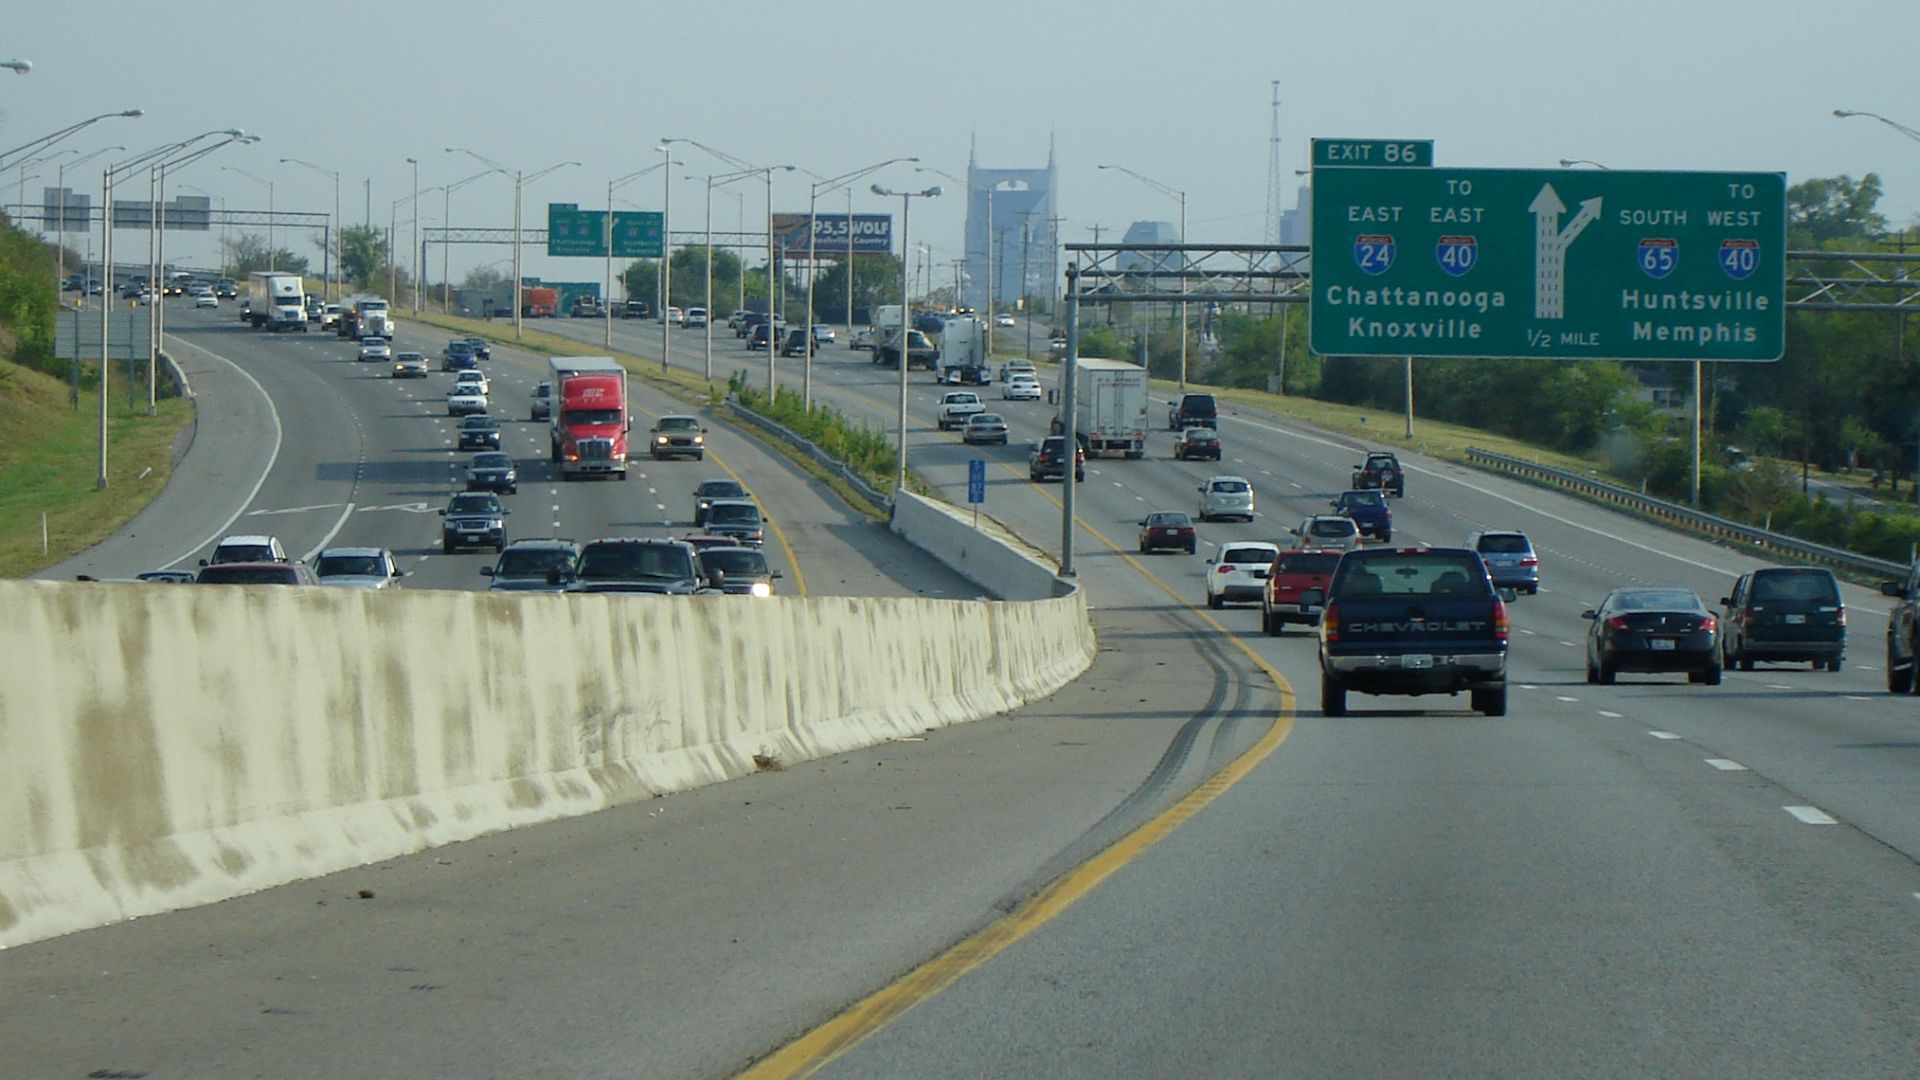
5: Tennessee
Road Rage Index: 77.5
Aggressive crash coding and ARRI rates both sit well above national averages. Speeding intensifies fatal outcomes along key corridors, reinforcing Tennessee’s high composite placement.
 Goldwiser at English Wikipedia, Wikimedia Commons
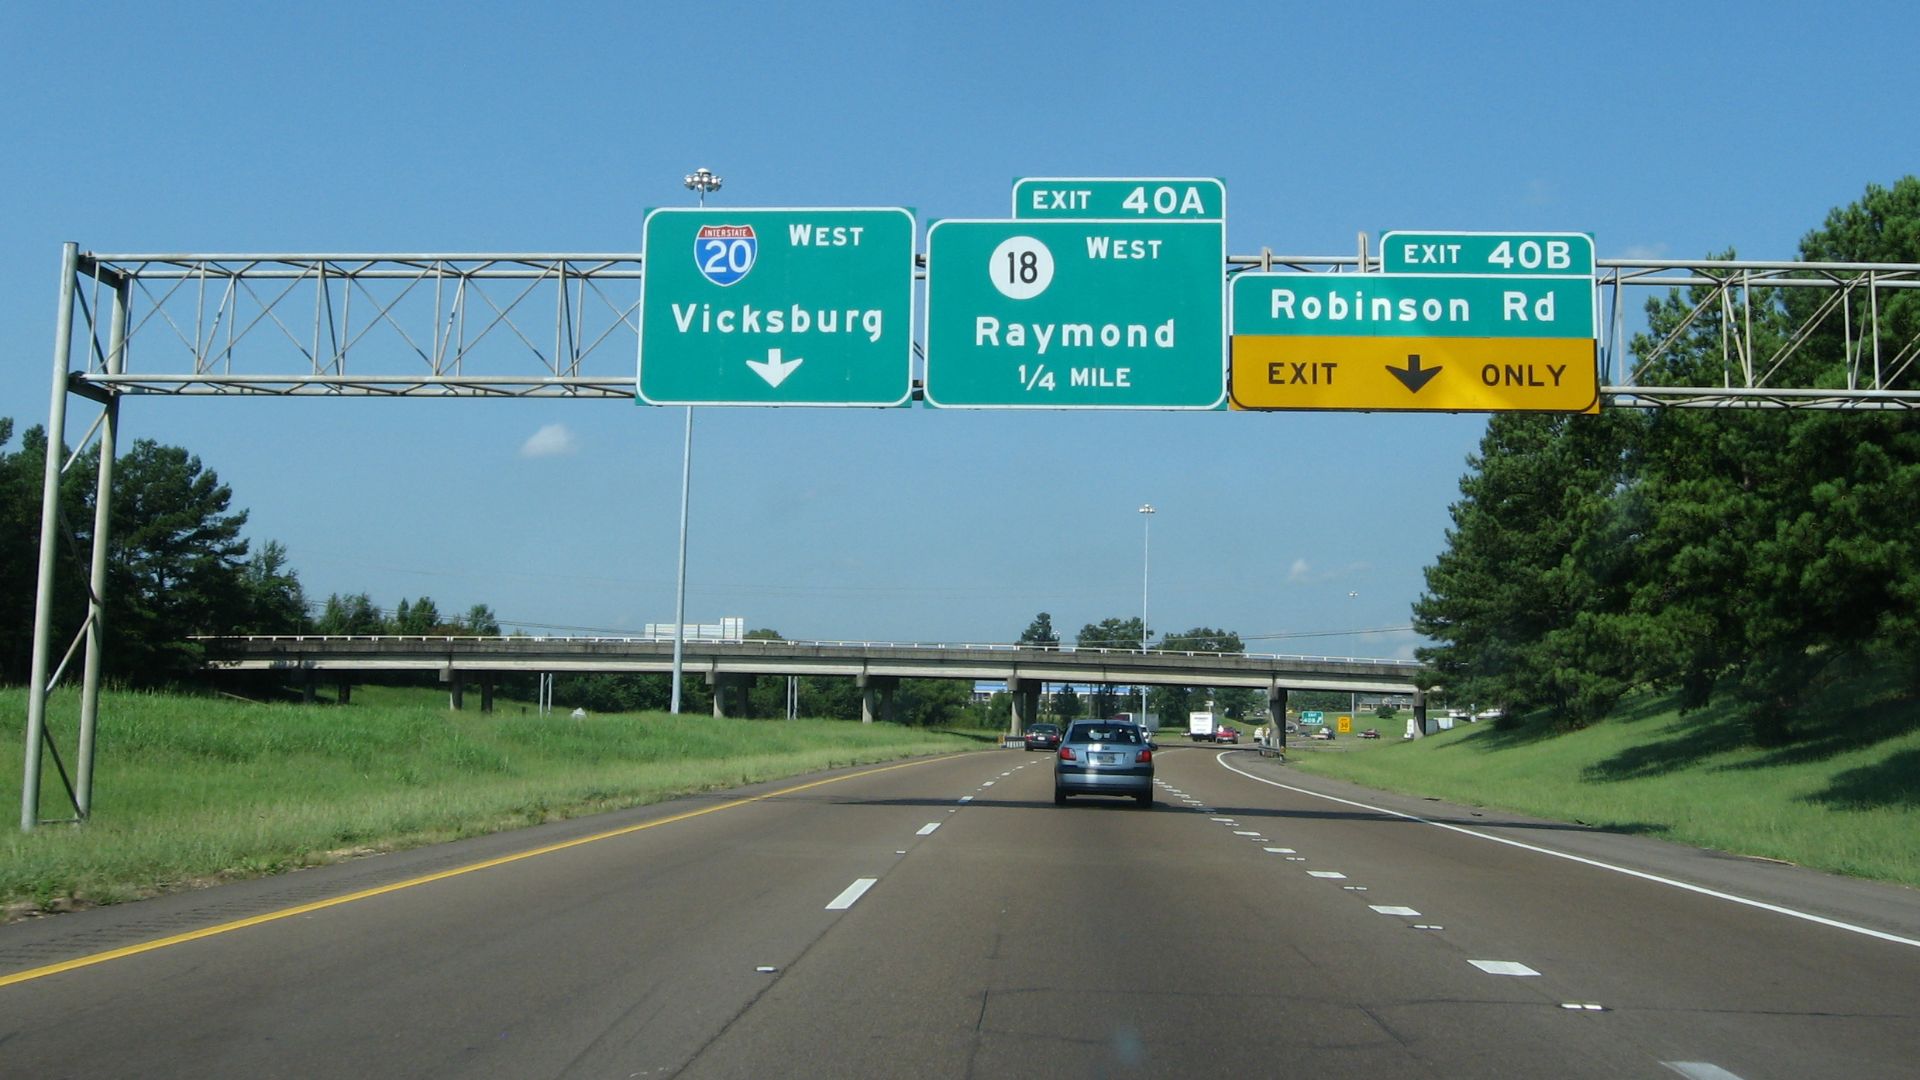
4: Mississippi
Road Rage Index: 81.3
High ARRI presence and extremely elevated aggressive fatal crash factors place Mississippi among the most volatile driving environments in the country. Speeding further compounds the risk.
 Ken Lund from Las Vegas, Nevada, USA, Wikimedia Commons
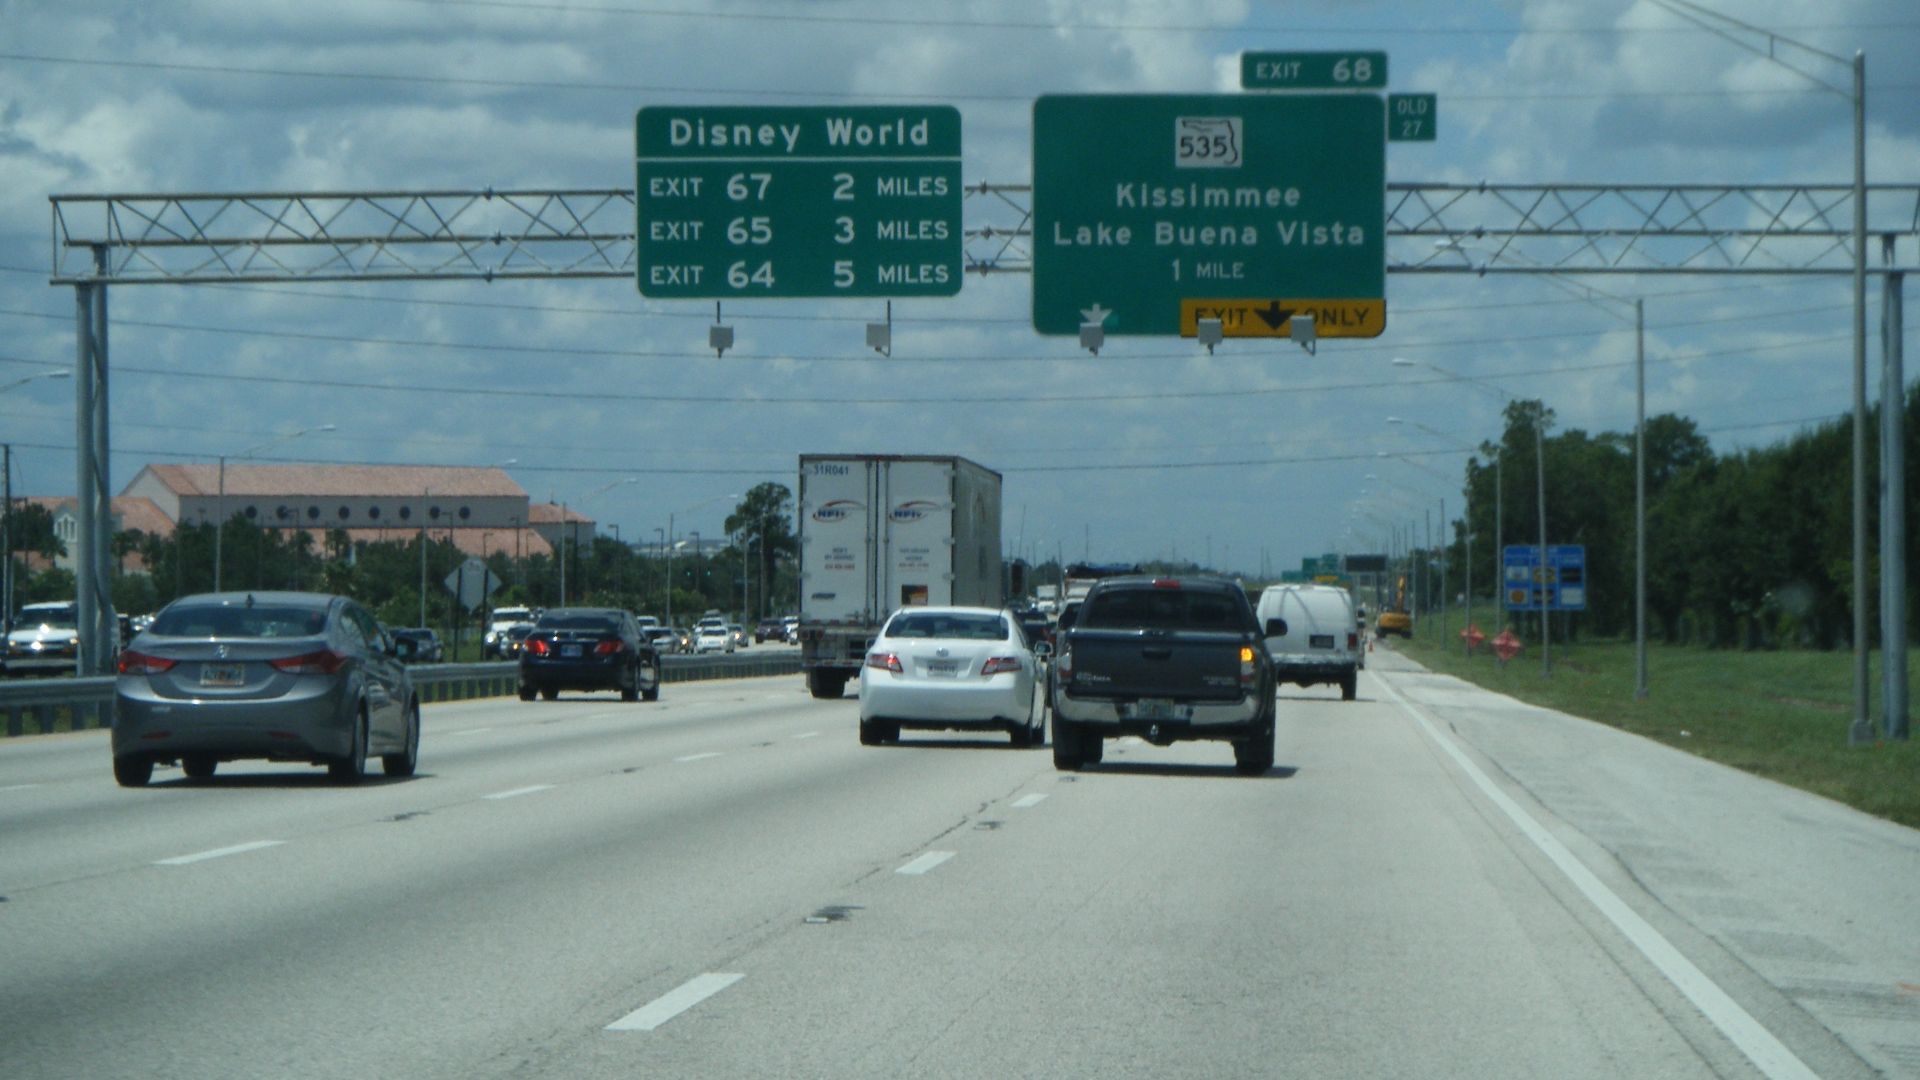
3: Florida
Road Rage Index: 84.6
High ARRI totals combined with elevated aggressive-driving fatal crash indicators push Florida into the top three. Persistent speeding-related fatalities across major metro corridors reinforce the state’s aggressive roadway profile.
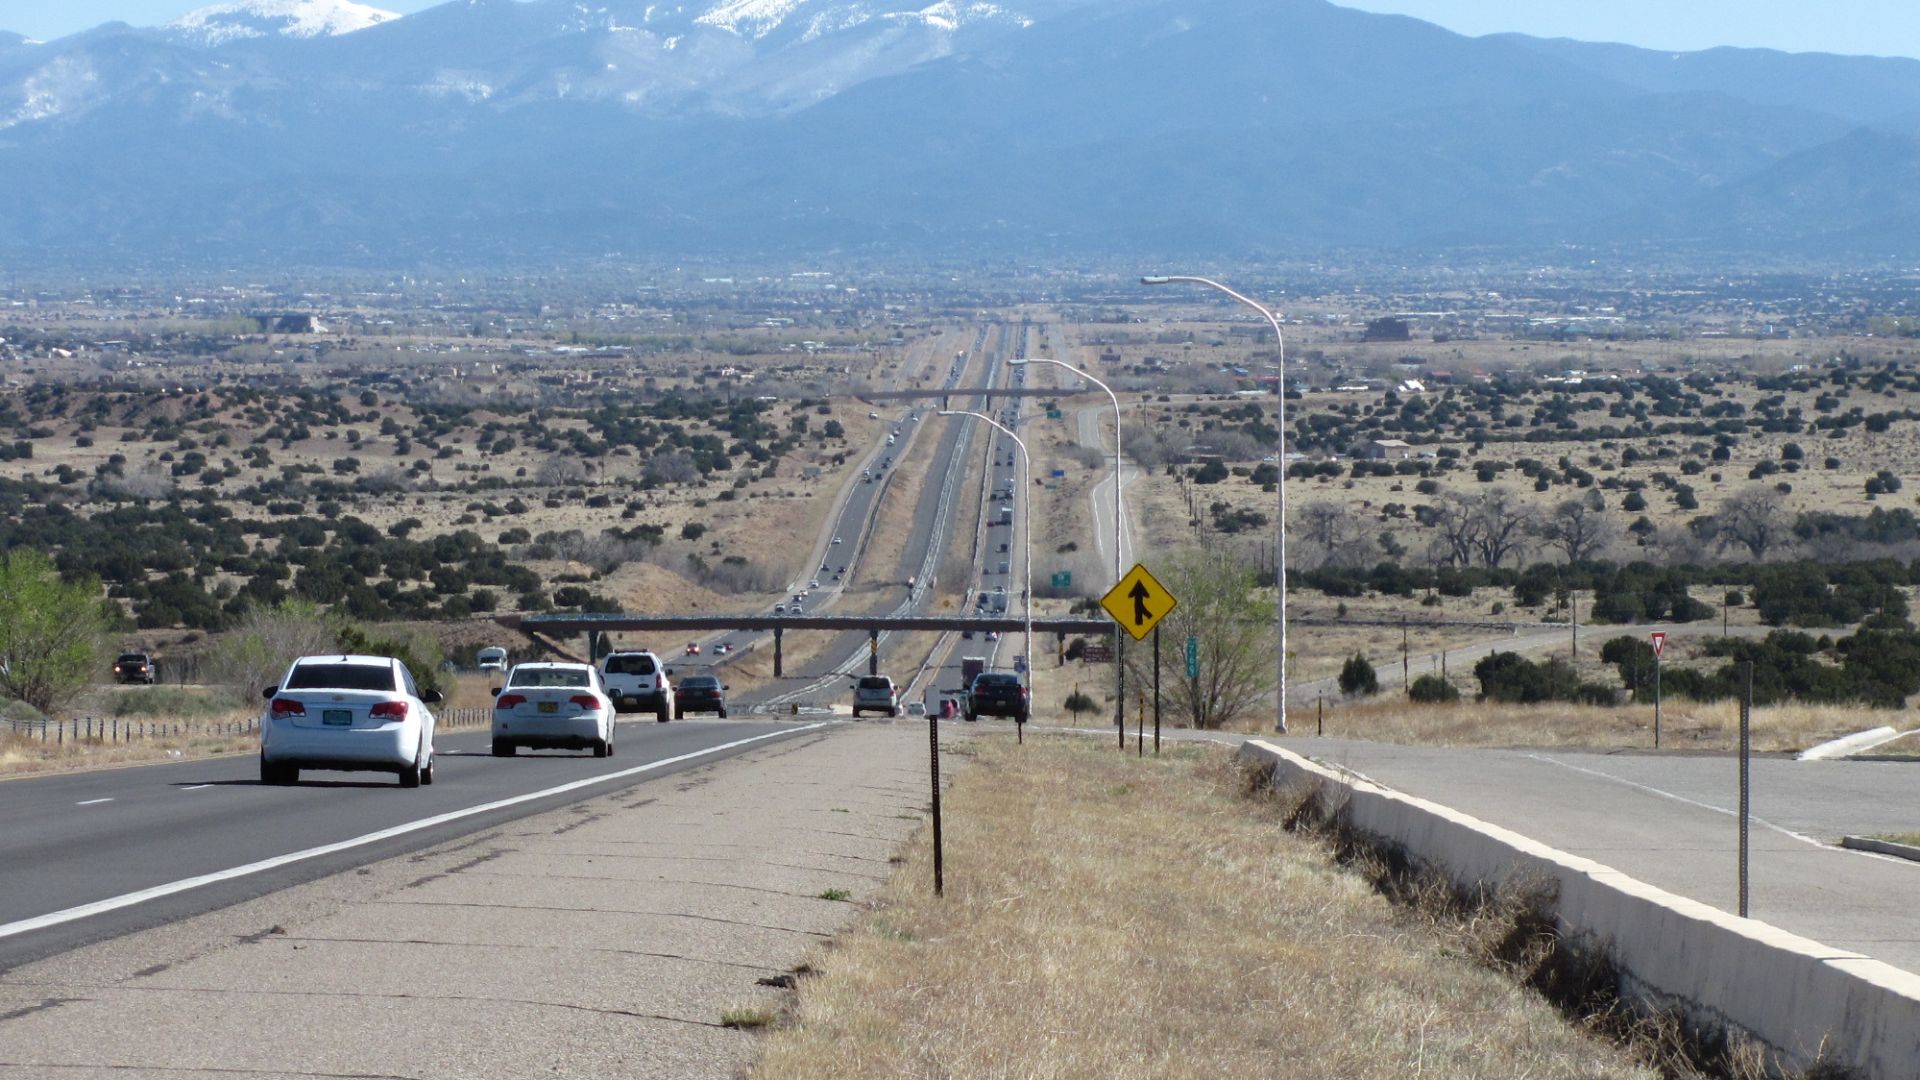
2: New Mexico
Road Rage Index: 89.1
One of the highest ARRI rates in the country, paired with extreme aggressive-driving fatal crash coding across multiple years. Speeding further reinforces the state’s elevated confrontation profile.
 John Phelan, Wikimedia Commons
1: Louisiana
Road Rage Index: 93.8
Louisiana ranks worst overall, combining some of the nation’s highest ARRI rates with extremely elevated aggressive-driving fatal crash factors. Persistent speed-related fatalities solidify its position at the top.
 Evil saltine, Wikimedia Commons
You Might Also Like:
The Nicest People In America Live In These States, According To The Data
Latest Numbers Reveal The Best States To Raise A Family In America In 2026