

Wallet-Friendly Living, State by State
Looking to stretch your dollars? Well, as many of us know, some states make life a lot more affordable than others. To find out which ones, we went ahead and ranked every U.S. state using an Affordability Score—a composite of median home value (40%), average rent (30%), household electricity price/bill as a utilities proxy (15%), and the overall Cost of Living Index (15%). Each metric was normalized (lower = cheaper), then combined with those weights. The lower the Affordability Score, the more affordable the state.
50: Hawaii
Affordability score: 184.2
Median/typical home value: ~$835k
Average rent: ~$2,400/mo
Utilities: ~40% above avg
Cost of living index: 184.2
Paradise is expensive—Hawaii ranks as the least affordable state.
 ArdentArbitration, Wikimedia Commons
49: California
Affordability score: 142.5
Median/typical home value: ~$790k
Average rent: ~$2,200/mo
Utilities: ~25% above avg
Cost of living index: 142.5
California living means sunshine—and sky-high housing costs.
 Crown Point Design, Adobe Stock
48: Massachusetts
Affordability score: 135.0
Median/typical home value: ~$640k
Average rent: ~$2,100/mo
Utilities: ~15% above avg
Cost of living index: 135.0
History and education are rich here—so is the cost of living.

47: New York
Affordability score: 127.0
Median/typical home value: ~$490k
Average rent: ~$2,100/mo
Utilities: ~20% above avg
Cost of living index: 127.0
The Empire State’s appeal comes with an empire-sized price.

46: Alaska
Affordability score: 125.5
Median/typical home value: ~$365k
Average rent: ~$1,450/mo
Utilities: ~45% above avg
Cost of living index: 125.5
Remote living and harsh winters push costs higher.

45: Oregon
Affordability score: 124.0
Median/typical home value: ~$485k
Average rent: ~$1,750/mo
Utilities: ~5% above avg
Cost of living index: 124.0
Oregon offers outdoor beauty at a premium.
 Spicypepper999, Wikimedia Commons
44: Washington
Affordability score: 122.5
Median/typical home value: ~$570k
Average rent: ~$1,950/mo
Utilities: ~8% above avg
Cost of living index: 122.5
Booming tech growth means high prices statewide.

43: Maryland
Affordability score: 120.0
Median/typical home value: ~$430k
Average rent: ~$1,850/mo
Utilities: ~10% above avg
Cost of living index: 120.0
Living near D.C. drives Maryland’s costs skyward.

42: New Jersey
Affordability score: 119.5
Median/typical home value: ~$460k
Average rent: ~$1,900/mo
Utilities: ~12% above avg
Cost of living index: 119.5
Big-city access makes Jersey living pricey.

41: Connecticut
Affordability score: 117.5
Median/typical home value: ~$420k
Average rent: ~$1,750/mo
Utilities: ~18% above avg
Cost of living index: 117.5
Quaint New England life comes with high costs.

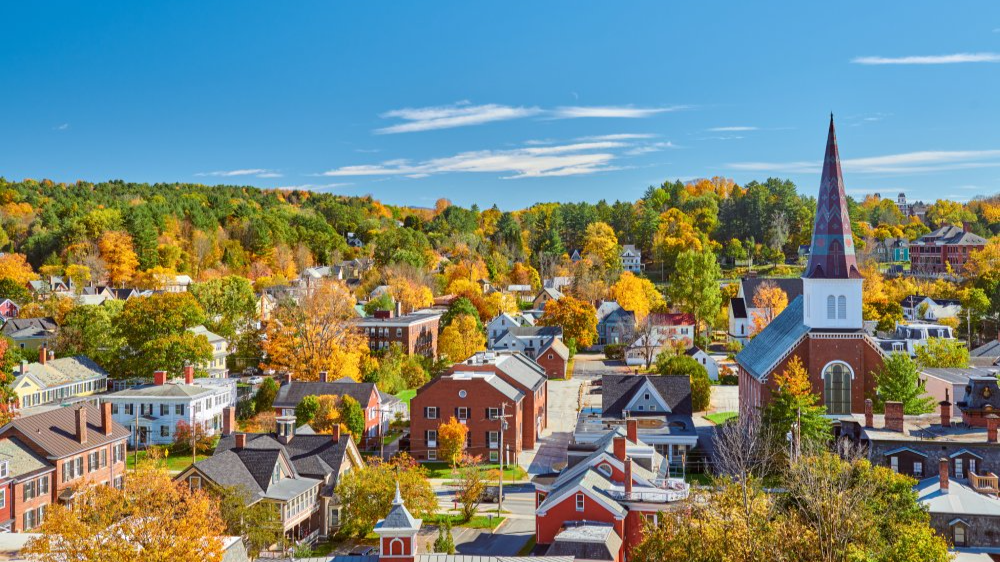
40: Vermont
Affordability score: 116.0
Median/typical home value: ~$390k
Average rent: ~$1,600/mo
Utilities: ~15% above avg
Cost of living index: 116.0
Charming but costly, Vermont isn’t budget-friendly.
39: Colorado
Affordability score: 114.5
Median/typical home value: ~$525k
Average rent: ~$1,850/mo
Utilities: ~7% above avg
Cost of living index: 114.5
Rocky Mountain living looks great—but isn’t cheap.

38: Rhode Island
Affordability score: 113.0
Median/typical home value: ~$410k
Average rent: ~$1,700/mo
Utilities: ~10% above avg
Cost of living index: 113.0
The Ocean State is small but expensive.

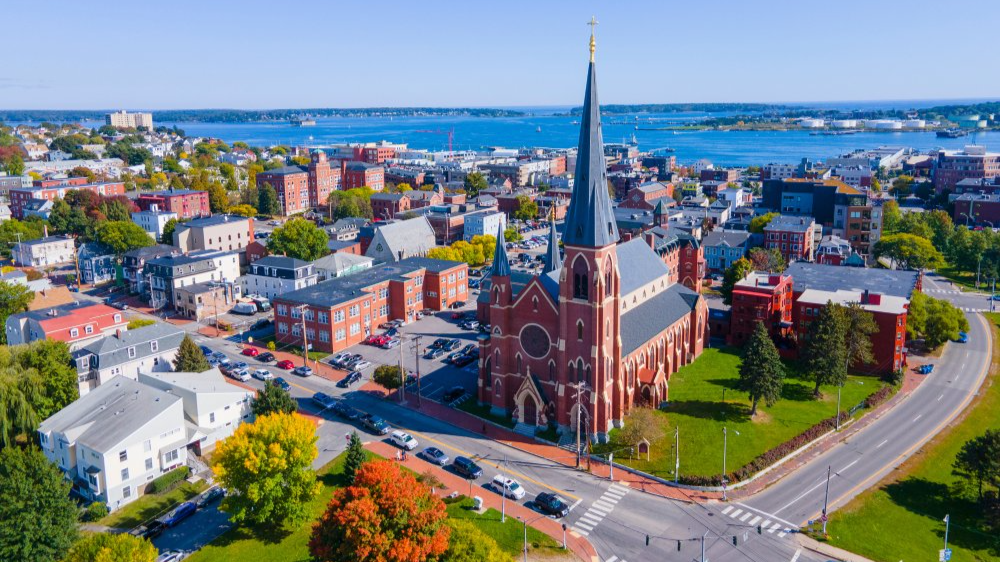
37: Maine
Affordability score: 112.5
Median/typical home value: ~$365k
Average rent: ~$1,500/mo
Utilities: ~20% above avg
Cost of living index: 112.5
Seafood may be fresh, but bills are high.
36: Virginia
Affordability score: 111.0
Median/typical home value: ~$395k
Average rent: ~$1,600/mo
Utilities: ~3% above avg
Cost of living index: 111.0
Northern Virginia costs tilt the state’s balance.
 Bruce Emmerling, CC BY-SA 4.0, Wikimedia Commons
35: New Hampshire
Affordability score: 110.5
Median/typical home value: ~$430k
Average rent: ~$1,550/mo
Utilities: ~12% above avg
Cost of living index: 110.5
Freedom comes at a price in New Hampshire.
 Quintin Soloviev, CC BY 4.0, Wikimedia Commons
34: Delaware
Affordability score: 109.5
Median/typical home value: ~$380k
Average rent: ~$1,500/mo
Utilities: ~7% above avg
Cost of living index: 109.5
No sales tax helps—but housing costs don’t.
 Tim Kiser (User:Malepheasant), CC BY-SA 2.5, Wikimedia Commons
33: Montana
Affordability score: 109.0
Median/typical home value: ~$445k
Average rent: ~$1,400/mo
Utilities: ~5% above avg
Cost of living index: 109.0
Big skies, big bills—Montana isn’t cheap.
 Quintin Soloviev, CC BY 4.0, Wikimedia Commons
32: Nevada
Affordability score: 108.5
Median/typical home value: ~$415k
Average rent: ~$1,550/mo
Utilities: ~2% above avg
Cost of living index: 108.5
Vegas lights shine bright—but bills add up.

31: Arizona
Affordability score: 108.0
Median/typical home value: ~$405k
Average rent: ~$1,550/mo
Utilities: ~6% above avg
Cost of living index: 108.0
Arizona living isn’t as cheap as it used to be.
 DPPed, CC BY-SA 3.0, Wikimedia Commons
30: Florida
Affordability score: 107.5
Median/typical home value: ~$400k
Average rent: ~$1,750/mo
Utilities: ~5% above avg
Cost of living index: 107.5
Warm weather comes with rising housing prices.

29: Pennsylvania
Affordability score: 104.5
Median/typical home value: ~$275k
Average rent: ~$1,400/mo
Utilities: ~2% below avg
Cost of living index: 104.5
Affordable towns balance pricier metro hubs.

28: Minnesota
Affordability score: 104.0
Median/typical home value: ~$325k
Average rent: ~$1,450/mo
Utilities: ~1% below avg
Cost of living index: 104.0
The Land of 10,000 Lakes is still reasonable.

27: Wisconsin
Affordability score: 103.5
Median/typical home value: ~$285k
Average rent: ~$1,300/mo
Utilities: ~3% below avg
Cost of living index: 103.5
Affordable housing makes Wisconsin wallet-friendly.

26: Michigan
Affordability score: 103.0
Median/typical home value: ~$250k
Average rent: ~$1,250/mo
Utilities: ~4% below avg
Cost of living index: 103.0
Michigan keeps costs lower than many neighbors.

25: Illinois
Affordability score: 102.5
Median/typical home value: ~$285k
Average rent: ~$1,350/mo
Utilities: ~5% below avg
Cost of living index: 102.5
Chicago is pricey, but elsewhere Illinois is affordable.
 Andrew Horne, CC BY 2.0, Wikimedia Commons
24: North Carolina
Affordability score: 102.0
Median/typical home value: ~$310k
Average rent: ~$1,350/mo
Utilities: ~6% below avg
Cost of living index: 102.0
From mountains to coast, NC stays moderate in cost.
 Precisionviews, CC BY-SA 4.0, Wikimedia Commons
23: South Carolina
Affordability score: 101.5
Median/typical home value: ~$295k
Average rent: ~$1,300/mo
Utilities: ~8% below avg
Cost of living index: 101.5
Southern charm meets fair pricing in South Carolina.

22: Georgia
Affordability score: 101.0
Median/typical home value: ~$300k
Average rent: ~$1,250/mo
Utilities: ~7% below avg
Cost of living index: 101.0
Georgia keeps costs sweeter than most.

21: Texas
Affordability score: 100.5
Median/typical home value: ~$315k
Average rent: ~$1,350/mo
Utilities: ~10% below avg
Cost of living index: 100.5
No state income tax helps Texas stay competitive.

20: Kentucky
Affordability score: 98.5
Median/typical home value: ~$225k
Average rent: ~$1,000/mo
Utilities: ~12% below avg
Cost of living index: 98.5
Kentucky bourbon isn’t the only thing affordable.
 Grindstone Media Grp, Adobe Stock
19: Missouri
Affordability score: 98.0
Median/typical home value: ~$235k
Average rent: ~$1,050/mo
Utilities: ~10% below avg
Cost of living index: 98.0
Missouri’s affordability makes everyday life easier.

18: Indiana
Affordability score: 97.5
Median/typical home value: ~$230k
Average rent: ~$1,050/mo
Utilities: ~11% below avg
Cost of living index: 97.5
Low housing costs keep Indiana high on affordability.

17: Ohio
Affordability score: 97.0
Median/typical home value: ~$220k
Average rent: ~$1,000/mo
Utilities: ~9% below avg
Cost of living index: 97.0
Ohioans enjoy affordable living across the board.
 Nicholas J. Klein, Adobe Stock
16: Alabama
Affordability score: 96.5
Median/typical home value: ~$205k
Average rent: ~$950/mo
Utilities: ~8% below avg
Cost of living index: 96.5
Affordable housing keeps Alabama budget-friendly.
 Carol M. Highsmith, Wikimedia Commons
15: Tennessee
Affordability score: 34.8
Median/typical home value: ~$308k
Average rent: ~$1,230/mo
Utilities: ~12.7¢/kWh
Cost of living index: 90.5
Music, mountains, and manageable bills put Tennessee just inside the top 15.

14: Iowa
Affordability score: 34.1
Median/typical home value: ~$236k
Average rent: ~$1,010/mo
Utilities: ~12.1¢/kWh
Cost of living index: 89.7
Low housing and a below-average COL keep Iowa wallet-friendly.
 Grindstone Media Grp, Adobe Stock
13: Arkansas
Affordability score: 33.6
Median/typical home value: ~$201k
Average rent: ~$980/mo
Utilities: ~11.9¢/kWh
Cost of living index: 88.7
Housing is inexpensive and day-to-day costs stay comfortably below average.

12: Kansas
Affordability score: 33.2
Median/typical home value: ~$235k
Average rent: ~$1,020/mo
Utilities: ~12.3¢/kWh
Cost of living index: 87.0
A steady Midwestern cost profile helps Kansas punch above its weight.
 Quintin Soloviev, CC BY 4.0, Wikimedia Commons
11: Oklahoma
Affordability score: 32.7
Median/typical home value: ~$204k
Average rent: ~$960/mo
Utilities: ~11.5¢/kWh
Cost of living index: 85.7
One of the nation’s lowest COL indices plus cheap housing drives Oklahoma’s rank.
 Nicholas J. Klein, Adobe Stock
10: West Virginia
Affordability score: 31.9
Median/typical home value: ~$171k
Average rent: ~$860/mo
Utilities: ~12.3¢/kWh
Cost of living index: 84.1
America’s cheapest home values keep West Virginia squarely in the top ten.

9: North Dakota
Affordability score: 31.3
Median/typical home value: ~$280k
Average rent: ~$1,050/mo
Utilities: ~10.8¢/kWh
Cost of living index: 91.9
Low utility prices and moderate housing costs make ND a quiet bargain.

8: South Dakota
Affordability score: 30.7
Median/typical home value: ~$273k
Average rent: ~$1,000/mo
Utilities: ~11.0¢/kWh
Cost of living index: 92.2
Stable housing and mild bills push South Dakota near the top.

7: Nebraska
Affordability score: 30.2
Median/typical home value: ~$271k
Average rent: ~$1,020/mo
Utilities: ~11.5¢/kWh
Cost of living index: 93.1
Nebraska’s mix of modest housing and everyday costs keeps budgets in check.

6: Louisiana
Affordability score: 29.6
Median/typical home value: ~$226k
Average rent: ~$1,020/mo
Utilities: ~11.1¢/kWh
Cost of living index: 92.2
Cultural perks at a discount—Louisiana stays broadly affordable.

5: New Mexico
Affordability score: 29.2
Median/typical home value: ~$304k
Average rent: ~$1,090/mo
Utilities: ~12.1¢/kWh
Cost of living index: 93.3
Slightly higher home values are offset by below-average overall living costs.

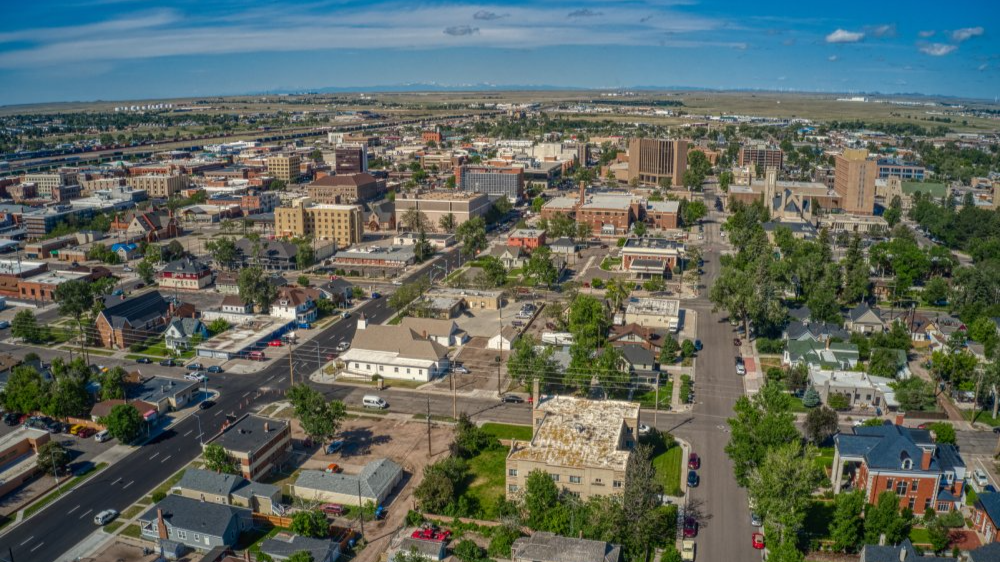
4: Wyoming
Affordability score: 28.7
Median/typical home value: ~$338k
Average rent: ~$1,100/mo
Utilities: ~11.0¢/kWh
Cost of living index: 95.5
Big skies, small bills—Wyoming’s balance keeps it ultra-competitive.
3: Kentucky
Affordability score: 28.1
Median/typical home value: ~$235k
Average rent: ~$990/mo
Utilities: ~11.6¢/kWh
Cost of living index: 93.0
Low rents and a soft COL index give Kentucky a top-three finish.
 Christopher Boswell, Adobe Stock
2: Idaho
Affordability score: 27.9
Median/typical home value: ~$467k
Average rent: ~$1,320/mo
Utilities: ~10.6¢/kWh
Cost of living index: 102.0
Despite pricier homes, cheap utilities and moderate rents keep Idaho high.

1: Mississippi
Affordability score: 27.3
Median/typical home value: ~$209k
Average rent: ~$980/mo
Utilities: ~11.8¢/kWh
Cost of living index: 87.9
Mississippi’s across-the-board value earns it the #1 spot.
 Kaotate, CC BY-SA 4.0, Wikimedia Commons
You Might Also Like:
Countries With The Most Expensive Groceries—And How They Compare To The U.S.
Every Country With A Better Quality Of Life Than The United States—Ranked According To Data
Ranking The Best Countries To Move To If You Want A Simpler Life—According To Data


.jpg)